City, University of London Institutional Repository
Citation:
Wilson, D.T., Hawe, G.I., Coates, G. & Crouch, R.S. (2016). Online optimization
of casualty processing in major incident response: An experimental analysis. European
Journal of Operational Research, 252(1), pp. 334-348. doi: 10.1016/j.ejor.2016.01.021
This is the published version of the paper.
This version of the publication may differ from the final published
version.
Permanent repository link:
http://openaccess.city.ac.uk/14442/
Link to published version:
http://dx.doi.org/10.1016/j.ejor.2016.01.021
Copyright and reuse: City Research Online aims to make research
outputs of City, University of London available to a wider audience.
Copyright and Moral Rights remain with the author(s) and/or copyright
holders. URLs from City Research Online may be freely distributed and
linked to.
ContentslistsavailableatScienceDirect
European
Journal
of
Operational
Research
journalhomepage:www.elsevier.com/locate/ejor
Innovative
Applications
of
O.R.
Online
optimization
of
casualty
processing
in
major
incident
response:
An
experimental
analysis
Duncan
T.
Wilson
∗,
Glenn
I.
Hawe
,
Graham
Coates
,
Roger
S.
Crouch
SchoolofEngineeringandComputingSciences,DurhamUniversity,SouthRoad,Durham,DH13LE,UK
a
r
t
i
c
l
e
i
n
f
o
Articlehistory:
Received 18 July 2013 Accepted 13 January 2016 Available online 22 January 2016
Keywords:
Scheduling
Combinatorial optimization Emergency response Disaster management Dynamic
a
b
s
t
r
a
c
t
Whendesigninganoptimizationmodel foruseinmasscasualtyincident(MCI)response,the dynamic anduncertainnatureoftheproblemenvironmentposesasignificantchallenge.Manykeyproblem pa-rameters,suchasthenumberofcasualtiestobeprocessed,willtypicallychangeastheresponse oper-ationprogresses.Otherparameters,suchasthetimerequiredtocompletekeyresponsetasks,mustbe estimatedandarethereforepronetoerrors.Inthisworkweextendamulti-objectivecombinatorial op-timizationmodelforMCIresponsetoimproveperformanceindynamicanduncertainenvironments.The modelisdevelopedtoallowforuseinrealtime,withcontinuouscommunicationbetweenthe optimiza-tionmodelandproblemenvironment.Asimulationofthisproblemenvironmentisdescribed,allowing foraseriesofcomputationalexperimentsevaluatinghowmodelutilityisinfluencedbyarangeofkey dynamicoruncertainproblemand model characteristics.It isdemonstrated thatthe moveto an on-linesystemmitigatesagainstpoorcommunicationspeed,whileerrorsintheestimationoftaskduration parametersareshowntosignificantlyreducemodelutility.
© 2016TheAuthors.PublishedbyElsevierB.V. ThisisanopenaccessarticleundertheCCBYlicense(http://creativecommons.org/licenses/by/4.0/).
1. Introduction
In the period immediately following a mass casualty incident (MCI),suchastheLondonBombingsofJuly7th2005(London As-sembly,2006),manydecisions needtobe madeina fastand ef-fectivemannerwithinahighpressureenvironment(Paton&Flin, 1999). Withinemergencyresponse organizationssuch asthe Am-bulanceServiceandtheFireandRescueService, decisionmakers mustdecidehowbesttoallocatetheir limitedresources amongst thevarioussourcesofdemand.Thisproblemenvironmentexhibits alargeamountofstructure,withwelldefinedrolesand responsi-bilitiesandacleardecisionmakingsystemasdefinedthroughthe commandandcontrolsystem(Wallace&deBalogh,1985).Inthis respect,the problemrepresentsa strong candidateforthe appli-cationofmathematical modelingandoptimization.However, sig-nificantchallengesremain,particularlywithrespecttothevolatile
nature of the problem environment. That is, the nature of any
decision problem is likely to change over time as the problem
evolves,andtheavailableinformationuponwhichamodelcanbe builtwilltypically be subjecttoa significant levelof uncertainty (Galindo&Batta,2013).
∗ Corresponding author. Tel.: +44 1904 659005.
E-mailaddress:[email protected] , [email protected] ,
[email protected] (D.T. Wilson).
InthemodelingofMCIresponse,aswiththedesignofany op-timization model,it isnecessary to make certain assumptions in ordertoensuretheimplementationremainsfeasible.Inthispaper weseektogainabetterunderstandingofseveralcharacteristicsof theresponseproblem,theirassociatedassumptions,andtheextent towhichtheyaffecttheutilityofascheduling-basedoptimization model.Inordertoproceed wefirst discussanumberof assump-tionscommontooptimizationmodelsforMCIresponse.Wecover the modeling of casualty health, their allocation to hospitals for treatment,thetransportation ofcasualtiesandresponders around theresponse environment, andtherepresentationoftasks which respondersmustcarryout.Wegoontofocusonhowothershave consideredthedynamicanduncertainnatureoftheresponse en-vironmentintheirmodels.Basedonourfindings,weidentifygaps that remain uncovered inthe literature and we discusshow our researchcontributestofillsuchgaps.
1.1. Commonmodelingassumptions
Some commonassumptions madeinthedesignofoperational
researchmodelsfordisasteroperationsmanagementareidentified inGalindoandBatta (2013).Furthercommonassumptions cover-ingthemoregeneralareaofdisasterplanningarelistedinAufder Heide(2006).
Depending on the general form of the model, the
parame-ters needed to specify its form can include variables such as
http://dx.doi.org/10.1016/j.ejor.2016.01.021
commodity supply anddemand levels, resource requirementsfor specific tasks,andthenumberandnature ofcasualties.As noted in GalindoandBatta (2013),it is commonformodels to assume that
1. theinformationneededtodeducetheseparametersisavailable andaccurateuponinitializationofthemodel,and
2. theparametersarenotrequiredtochangeovertime.
Theextenttowhichtheseassumptionsarejustifieddependson the specific problem under consideration, butwill oftenbe lim-itedbytheintrinsicuncertaintyandvolatilitycommontoall emer-gencyresponseproblems.Somespecificexamplesfollow.
1.1.1. Casualtyhealth
Some authorsassume there areno meaningfuldifferences be-tween thehealthlevels ofcasualties(Barbarosoglu& Arda,2004; Barbarosoglu,Ozdamar,&Cevik,2002;Mete&Zabinsky,2010; Rol-land, Patterson,Ward,& Dodin,2010;Wex, Schryen,&Neumann, 2011;2012).Wheredifferencesareacknowledged,itiscommonto assumeallcasualtieshavebeenpartitionedintodiscretecategories reflecting theurgency oftheir treatment (Galindo& Batta,2013), asintheworkofChiuandZheng(2007);GongandBatta(2007);
Yi andOzdamar(2007).Thisisreasonable, asitis normalforan assessmentofthehealthofeach casualty(knownastriage)tobe completedbeforetheremainderoftheresponseisenacted(Group, 2011). Itisoftenassumedthatindividual casualty healthwillnot changeovertime,andthatassessmentsofhealtharealways accu-rate.Theattractionoftheformerassumptionisunderstandable,as thetaskofaccuratelyforecastingthechanginghealthofcasualties intheseenvironmentsischallenging.Someattemptsaredescribed in Cotta (2011); Fiedrich, Gehbauer, andRickers (2000); Tatomir and Rothkrantz (2006). These models, however, do not provide any wayto correcterrors inprediction, an occurrencewhich we can assume to be likelydue tothe complexityof theunderlying process.
1.1.2. Hospitals
Manymodelsassumethattheallocationofcasualtiesto hospi-tals willbe done automatically andappropriately.Limited exam-ples of including hospital allocation into a wider decision prob-lemcan befoundinJotshi,Gong,andBatta (2009);Mysoreetal. (2005);Wilson,Hawe,Coates,andCrouch(2013a).InWilsonetal. (2013a)anoftenignoredaspect ofcasualty management,self pre-sentation, is discussed. It is oftenassumed that all casualties are transported to hospital by the Ambulance Service only (Auf der Heide, 2006), with the casualty undergoing triage andtreatment operations prior to this. In reality, it is commonfor some casu-alties to remove themselves fromthe incident site andtransport themselvestoahospitaloftheirchoosing.InWilsonetal.(2013a)
it is assumed that thisprocess could be predicted accurately.In scenarios where thisisnot possible, a dynamicapproach, updat-ing the model regarding the numberof casualties who have left theincidentsceneandwhohavearrivedateach hospital,maybe effective.
1.1.3. Transportation
The transport networkwithin the problemenvironment is of-tenassumedtobeknown,bothintermsoftopologyandthetravel timesbetweenlocations(Yi&Kumar,2007;Zhang,Li,&Liu,2012). As noted in Galindo and Batta (2013), the former assumption is morejustifiedthanthelatter.Examplesofremovingthelatter as-sumptioninclude(Wilson,Hawe,Coates,&Crouch,2013b).Inthis work it isdemonstrated that disruption to thenetwork resulting inuncertaintyin traveltimescan haveasignificant effectonthe performanceofanoptimizationmodel.Assuch,thisproblem char-acteristicshouldnotbeignored.
Uncertaintyinthedisruptionofthetransportnetworkhasbeen incorporatedtoalimitedextentusingstochasticprogramming for-mulations.Examples include(Barbarosoglu &Arda,2004; Mete& Zabinsky, 2010;Rawls& Turnquist,2010),which considera finite number of scenarios, each with assigned probability and associ-ated network parametrization. Uncertainty is also acknowledged in the work of Jotshi et al. (2009), which extends the ambu-lanceallocationmodelpresentedinGongandBatta(2007)by in-cluding a data fusion step to estimate the level of damage and
disruption on each road link. A solution methodology for
find-ing optimal paths in a disrupted network following a disaster
is presented in (Zhang, Zhang, Zhang, Wei, & Deng, 2013). The
authors employ the network representation described by Yuan
and Wang (2009), where the travel time associated with each edge of the transport network is assumedto increase over time in a manner which reflects its proximity to the disaster. A dy-namictransport networkstructureisalsomodeledintheworkof
Fiedrich et al. (2000), withnodes and edges being added or re-movedtoreflecttheimpactofboththedisasterandtheresponse operation.
1.1.4. Taskdurations
Where the modeling methodology involves the allocation of
discrete tasks to available responder units, the times needed to
complete these tasks are necessary problem parameters.
Exam-ples include the scheduling models presented in Rolland et al. (2010) and Wex et al. (2011). In the former, the authors pro-posea specific solution algorithm which, through its fast execu-tion,isdesignedto facilitatethesolving oftheir proposed model innear-realtime.Theauthorsarguethiswillallowdecision mak-ersto re-solve any particularresponse problem when conditions change,although thiscapabilityisnotexplicitlytestedand evalu-ated.InWexetal.(2011)asimilarmodelingmethodologyis
pro-posed, where all necessary parameters are assumed to be fixed
and known upon model initialization. This model is extended
in Wex, Schryen, and Neumann (2012), allowing for task dura-tions to be represented by fuzzy values inan effortto acknowl-edge the uncertainty inherent in available information. The au-thors suggest the model should be regularly rebuilt and solved
when the problem environment has evolvedby some significant
degree.
1.2.Modelinguncertaintyanddynamicity
All the assumptions mentioned relate to model parameters
whichchangeovertime,eitherbecausetheyare estimatesof un-knownreal valuesandcan thereforebe revised asnew informa-tioncomes to light, orbecausethe realvalues themselvesare of a dynamicnature,or both.In theworst casestheseassumptions willrenderamodelunusableinmanyrealistic scenarios.General strategiestotheirremovaltendtotakeeitherastochasticyetstatic approach,applyingstochastic (Barbarosoglu & Arda,2004;Chang, Tseng,& Chen, 2007;Mete &Zabinsky, 2010) orrobust ( Bozorgi-Amiri, Jabalameli, Alinaghian, & Heydari, 2012) programming to findsolutionswhichwillremainvalidastheproblemevolvesover time,oradynamicapproach,allowingforthemodeltobeupdated atanumberofsetlengthintervalstohelpensureitremains appli-cable(see,forexample,Lee,Ghosh,&Ettl,2009;Ozdamar,Ekinci, & Kucukyazici,2004; Yi & Kumar,2007). Onlylimitedsteps have beentaken withthe latter approach. In the context of manufac-turerorretailer response to hurricanes, thesupply chainmodels proposed in Lodree andTaskin (2009); Taskin and Lodree (2011)
Table1
Task types and their dependency relations.
Task: Pre-rescue stabilization → Rescue → Pre-transportation stabilization → Transportation Responder: HART SAR Ambulance / MERIT / HART Ambulance / HART Condition: Trapped and unstable Trapped Unstable All
looktodevelop modelswhichoperateincontinuoustime. Thisis echoed in Chiu and Zheng (2007), where the authors state that
“froma real-timeimplementationstandpoint,a cyclicrollinghorizon basedupdatingandre-optimizingframeworkandschemeneedtobe developedtoimproveaccuracyandrobustnessofthemodelunderthe highlyunpredictable environment”.In orderto move towards such areal-timesystem, theworkreportedinEngelmannandFiedrich (2007); Englemann and Fiedrich (2009); Fiedrich (2006); Jotshi etal.(2009)linktheirproposeddecisionsupportmodelsto simu-lationsoftheactualresponseenvironment,allowingforthetesting oftheabilityofeach modeltocopewithchangesininformation.
However, in these cases the whole decision problem is
decom-posedinto a sequence of singledecisionpoints, wheretasks are allocatedto respondersoneatatimeasandwhentheresponder becomesavailable. Thisstructuredoesnot allowforthepotential benefitsofforwardplanning,aswouldbeavailableinascheduling model,tobeexplored.Therehasbeennodetailedinvestigationof thepotential forreal-timedecisionsupportconsideringtheentire planninghorizon.Theneedforsuchresearchisfurtherhighlighted inthereviewofJiang,Yuan,Huang,andZhao(2012).
1.3.Contribution
In this paper we describe such a real-time system, building upon the static model presented in Wilson et al. (2013a). The model,coupledwithaddressingmanyofthelimitingassumptions discussedabove,allowingforinformationtobeupdatedina real-isticmannerandforthisinformationtobeusedtoimprovefuture predictionsaswellascorrectpasterrors,formstheprincipal con-tributionofthispaper.Inadditionto thiscontribution,thepaper presentsa detailedcomputationalanalysisofmodelperformance, identifyinganumberofpotentialexplanatoryparametersand ex-ploringto what extent they impact upon the utility of the opti-mizationmodel.
The remainder of this paper is structured as follows. In
Section2we brieflydescribeapreviouslypublisheddecision sup-portmodelforcasualtyprocessing, giveninWilsonetal.(2013a). Followingthis,Section3detailshowthismodelhasbeenextended to allow forits use in real-time duringan MCI characterized by uncertaintyand volatility. The results ofextensive computational experimentsare thenreportedanddiscussedinSection4.Finally,
we draw conclusions and identify promising avenues for future
research.
2. Astaticmodelofcasualtyprocessing
In this work we build upon the multi-objective combinatorial optimizationmodeldescribedinWilson etal.(2013a).Originally, themodelwasdesignedforuseina staticmanner,being initial-izedat a point where all relevant informationwas available and runningforthedesiredlength oftimebeforedelivering the solu-tionoutput,whichtooktheformofaworkscheduledetailing the allocationandordering ofresponsetasks to availableresponders. Whilethemodeldidincorporateaprobabilisticapproachwhen de-scribingtheevolutionofcasualtyhealth,nootherparameterswere ofastochasticnature.
As this model is designed to perform a period of
pre-computationbefore delivering a single solution, we denote it as modelMpc.Inthissectionwewilldescribethekeycomponentsof
thismodel,withtheaimofconveyingitsnaturewhileminimizing
the technical detail which can instead be found in Wilson etal. (2013a).Inthefollowingsection we willdiscussits extensionfor
useindynamic, evolvingproblemswhere manymore parameters
aresubjecttouncertainty.
2.1. Solutionspace
AsolutiontothecasualtyprocessingproblemfacedinMCI re-sponseconsistsof:
• anallocationofcasualtiesc∈Ctohospitalsh∈H, • anallocationoftaskst∈T torespondersr∈R,
• anorderingofthetasksassignedtoeachresponderr.
The types oftasks which can be found in T are summarized
inTable1.Eachcasualtyrequires thecompletionofa transporta-tion task, to be carried out by an Ambulance responder unit, in orderforthemtobetakenfromtheincidentsitetotheirallocated hospital. Inaddition,ifthe casualty’s healthis unstablethey will alsorequirea pre-transportationstabilizing treatmenttaskto en-sure their safe transportation. Such tasks may be carried out by
ambulance responder units, a Medical Emergency Response
Inci-dent Team (MERIT), ora Hazardous AreaResponseTeam (HART).
MERIT units are medical teams who attend incident sites to as-sist the triage and treatment of casualties (London Emergency ServicesLiaisonPanel,2015).HARTteamsarespeciallytrainedand equippedforworkingwithin thehazardousinner cordonarea. In some cases,casualties may require extrication fromthe incident siteby aSearchAndRescue(SAR)responderunit,whichweshall refertoasa‘rescue’task.Shouldthisbethecase,itispossiblethat apre-rescuestabilizingtreatmenttaskbe requiredinorderto re-ducethelikelihoodofthehealthofthecasualtydeteriorating dur-ing theextricationoperation.Thesetasksmayonlybe completed byHARTunits.
2.2. Objectivefunctions
Given a solution asdefined in Section 2.1, a schedule can be constructeddetailingtheworkplanforeachresponder,identifying thetime atwhich theresponder(a) beginstravelingtothe loca-tionoftheirnexttask,(b)beginsworkonthistask,and(c)finishes workonthistask.Inconstructinga schedulefromasolution,the spatialnature oftheproblemis takenintoaccount inestimating thetraveltimesofrespondersasthey movebetweensitesand/or hospitals.Theseestimatesarecombinedwithestimatesoftask du-rationwhenconstructingtheschedule.
For a given (estimated) schedule, a number of measures are
calculated and used to evaluate and compare solutions during
the optimization process, together measuring fatalities and
suf-fering. We will briefly describe these functions here and
re-fer the reader to Wilson et al. (2013a) for further details and discussion.
2.2.1. Fatalities
In manycountries it is standard practice inMCI response for afull triageofcasualtiestobecarriedout beforeanysubsequent tasksmaybegin.Theresultisanassessmentofthehealthofeach casualty, which is classified according to the four possible cate-gorieslistedinTable2.
OurmodelusesaMarkovchainconsistingofastatespace{T1,
[image:4.595.100.489.77.107.2]Table2
Triage levels assigned to casualties. Category Description Explanation
T1 Immediate Require immediate life-saving procedure
T2 Urgent Require surgical or medical intervention within 2–4 hours
T3 Delayed Less serious cases whose treatment can safely be delayed beyond 4 hours Dead
over the course of the response operation. We assume that the
health of casualtieswill only ever decreasewhen in an unstable environment, that is,before they havebeenextricated and taken to asafedesignatedarea. Foreach casualty, themodelisusedto calculatetheprobabilitythattheywillhavediedbeforetheyreach hospital. These probabilities are summed together to produce an objectiveofthecasualtyprocessingproblem,
minf1
(
s)
=
c∈C
P(cdeadonarrivalathospital), (1)
wheresisasolutiontothemodel.
Wenotethatourmodelassumesthetransitionprobabilitiesof this chain are known. In practice, this may not be possible due totheinherentlowfrequencyofMCIsandthelackofdata collec-tionwhichoccursduringthem.However,wehaveattemptedtoset transitionprobabilitieswhichreflectthequalitativedescriptionsof triage states, asgiven in Table 2. Forexample, we have ensured thattheprobabilityofdeathofaT1casualtywhoisleftuntreated inanunstableenvironmentforthirtyminutesapproaches1,while for aT3casualty it reachesonly 0.1. In selectingthese transition probabilities we aimto consider themostgeneric MCI scenarios.
Were the model to be applied to more unique and idiosyncratic
scenarios, theseparametervaluesshould be adjustedaccordingly. It is noted that due to the inherent low frequency of MCIs and the lack ofdata collectionwhich occurs duringthem, estimating these probabilities presentsa significant challenge. However, one suggestedapproachtoestimatetransitionprobabilitieswouldbeto analyzepatientdatafromnon-MCIemergencysituationsinwhich there are fewer casualties and their health states are monitored moreclosely.Whileacknowledgingthatsuchdatawouldoriginate from non-MCIs, it would provide a more realistic basis for their estimation.
2.2.2. Suffering
AsecondobjectiveofMCIresponse,f2,istominimizesuffering.
We consider suffering tobe quantified throughtwo components.
Firstly,foreachcasualtythetimetakenfrommomentofinjuryto theirarrivalathospitalisnoted.Thesetimesaresummedtogether witheachindividual contributionweightedbytheseverityofthat casualty’s health.Secondly,thestandard oftreatment availableat thehospitalstowhichcasualtieshavebeenassignedismeasured. Thisis donethrough forecastingthearrival timesofcasualties at eachhospitalandcontrastingwithpredictedresourcelevelsin or-dertoestimatetheamountoftimecasualtieswillcollectivelywait at a hospital before treatment is administered.To this we add a penalty termforevery casualtywho hasbeenassignedtoa hos-pitalwhichdoesnotprovideanyspecialisttreatmenttheirinjuries require(e.g.,thosesufferingfromsevereburnsshouldbe encour-aged tobe sent toa hospital witha specialistburnsunit).These twomeasuresarecombinedtoformthesinglesufferingobjective,
f2,usingtheweightedmetricmethodofleastsquares.
2.2.3. Lexicographicordering
The objectivesf1 andf2 are combinedinalexicographic
man-ner to reflectthefact that thesaving oflivesisalways of higher priority than the reduction of suffering. The full multi-objective
modelcannowbedefinedas
min
s∈S f1
(
s)
, f2(
s)
. (2)2.3.Solutionmethodology
2.3.1. Localsearch
AVariableNeighborhoodDescentmetaheuristicisemployedin ordertofindhighqualitysolutionstotheschedulingproblem de-scribed above. Four neighborhood structures are employed, each withvariablesize,whichfacilitatesthelocalsearchprocess escap-inglocaloptimathroughconsiderationoflargerneighborhoods. A similarapproachhasbeenshowntoperformwellonaflexiblejob shopproblem(Amiri,Zandieh, Yazdani,&Bagheri,2010),whichis ofasimilarstructuretothemodeldescribedinSection2.1.As de-scribed inWilson et al.(2013a),the algorithm employs four dif-ferentneighborhoodstructures,cyclingbetweenthemateach iter-ation.Whenacertainneighborhoodstructureresultsinno neigh-boringsolutionswhichimproveuponthecurrentsolution,thesize ofthatneighborhoodisincreased.Forexample,oneneighborhood structureallowsforanytwotaskstobeswapped,intermsoftheir responderallocationandtheirpositioninthat responder’s sched-ule. Increasing the size of this neighborhood allows for two of these‘swap’ operationstobecarriedout inasinglestep. Accord-ingly,increasing the size of theneighborhood increases the like-lihoodoffindingan improvingsolution.Thisstrategy enablesthe searchprocesstoescapeanylocaloptimaitfindsitselfin.
2.3.2. Constructiveheuristic
Inadditiontoalocalsearchsolutionmethodology,Wilsonetal. (2013a) also provides details of a heuristic routine which can be applied in a constructive manner. Specifically, the construc-tor builds a solution by allocating tasks to the end of respon-ders’ schedules until all tasks have beenallocated. At each deci-sionpoint,theresponderchosenistheonewhichisduetofinish alltheirtasksfirst.Atasktobeallocatedtotheendoftheir sched-uleischosenbyconsideringanumberofcriteria,suchasthetime atwhichthetaskcouldbeginandthehealthoftheassociated ca-sualty,in a lexicographic manner. The constructor is designed to
approximatehow decisions wouldbe made on theground ofan
MCI,focussingontheimmediatesituationasopposedtoplanning ahead.
3. Anonlinemodelofcasualtyprocessing
Havingdescribedthepre-computationmodelMpc inSection2,
wenow considerits extension tomorerealistic problemssubject tohighvolatilityandassociateduncertaintyinmodelparameters. We denote thisonline model by Mo. Inthe following discussion
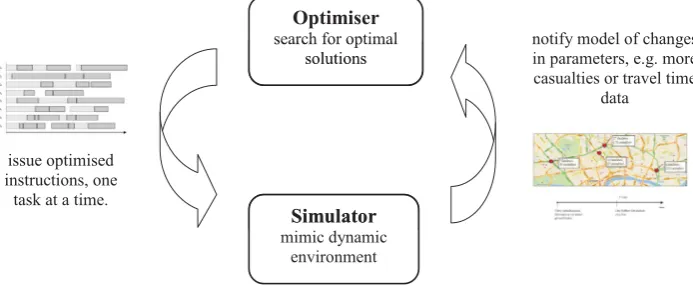
Fig.1. Two-way communication between optimization and response environment.
Wedescribeproblemswhichdonotincludeanydynamic char-acteristics as static problems. Those which include dynamic ob-jectivespacesare describedaspartiallydynamicproblems.Finally, thoseproblemswhichexhibit dynamicbehavior inboth the solu-tionand objectivespaces are denoted fully dynamic problems.In thissectionwe will firstdescribe howthe modelcan beused in real-timebyallowinginstructionstobeissuedtoresponders grad-ually,onetaskata time,asopposedtoissuingafull scheduleat asingletime point. We thengo on todescribe dynamicfeatures oftheproblemwhichresultinchanges tosolutionsspace param-eters,beforefinally consideringfeaturesleadingtochangestothe objectivespace.
3.1.Real-timeandonlineoptimization
Anecessaryfirststepinadaptingthemodelisallowingforthe modeltopassinstructiontotheproblemenvironmentinagradual mannerasopposedtoatonesinglepointintime.Thisis accom-plishedthroughthepartitioningofalltaskswithinthemodelinto
two complementary sets: fixed, denoting tasks which have been
givenasinstructionsandwhich aresponderunit hasbegun; and
free,denotingalltasksyettobeissuedtoaresponderunit. Employingthelocalsearchoptimizationprocedureinreal-time
meansthat, atanygivenpointin theresponseoperation, the lo-calsearchprocedureiscarriedoutoveronlythesetoffree tasks, adjusting their positions in the schedulein an attempt to finda solutionofhigherquality.Attheoutsetoftheoperation, optimiza-tioniscarriedoutoveralltasksinthemodel.Towardstheendof theoperation, where the majority of tasks havebeen carried by responders andare now fixed in their positions in the schedule, optimizationmayinvolveonly a handfulof remaining free tasks. Whenaresponder unitbecomesavailable, theirnext taskis cho-sen based on the best overall schedule found so far by the op-timizationalgorithm.After thistaskis issuedandbecomesfixed, optimizationcontinues consideringtheremaining fee tasks.Thus, aresponder’sscheduleis notfixed attime
τ
= 0,butrather con-tinuouslybuiltastheresponseoperationprogresses.Inthis man-ner,theoptimizationmodelcanbeusedinreal-timeastheevent unfolds,regularlyissuinginstructions.Thisisincontrastwiththe usualoffline approach,wherethe modelissuesa full scheduleof instructionsonce,attheoutsetoftheresponseoperation.It should be emphasized that by employing the optimization
procedureinreal-time,thecommonconcernofalgorithm compu-tationtimeisnolongerofdirectrelevance.Usually,theevaluation ofan algorithm wouldconcern both the quality ofthe solutions it suggests, and the time required to do so. In designing an al-gorithm,one wouldtrade-off thesetwo characteristicsto achieve theright balancefor the problemathand.In our case, however, wecontinuetooptimiseoverthe currentset offree tasksuntila
responder requires instruction. There is no benefit in pausing or terminatingtheoptimizationprocedurebeforethis,andsoweare notconcernedwithtradingoff computationtimeforsolution qual-ity.Aninefficientorslowalgorithmwillimpactthequalityofthe proposed solutions, butthisimpact will be entirelyencapsulated by thefinalsolution qualityobservedupon completion ofthe re-sponseoperation.
The continuouspassing ofinstructions fromthe modelto the
response environment is complemented by the continuous
feed-back ofinformation fromthe environmentto the modelin what
we term online optimization.There, any changes in the environ-mentwhicharerelevantto themodelare notedandpassedback to themodel asthey are observed,to allow forthe modelto be updated andreflectthe problemmoreaccurately.Thisprocess of continuoustwo-waycommunicationisillustratedinFig.1.
In the remainder of this Section, we describe the various
changesintheresponseenvironmentwhichcanbeupdatedwithin themodel,andhow thesechanges can besimulatedforthe pur-posesofexperimentalevaluation.
3.2. Solutionspaceparameters
AsdescribedinSection2.1,thedecisionproblemmodeled con-sistsofassigninganorderedlistoftaskstoanumberofresponder unitsand allocatingcasualties to appropriate hospitals. Since the setoftasksT isdeterminedbythesetofcasualtiesC,wecan re-ducetheparametersassociatedwithsolutionspacechangetobe:
• C,thesetofallcasualties,
• R,thesetofallresponderunits,
• H,thesetofhospitals.
As the hospitals available for use in the response operation are unlikelyto alter, wedo notconsider anydynamicchanges to thesetH.Regardingthesetofavailableresponderunits,we note that this can both increase and decrease as the response opera-tion progresses. Asdiscussed in Aufder Heide (2006),it is com-monforrespondersfromareasneighboringtheaffecteddistrictto self-dispatch,thusarriving withlittleornonotice andincreasing the setofresponders. Althougha reduction can occurdue to
in-jury sustained when working ina hazardousenvironment, given
theshorttime-scaleofproblemscenariosconsideredinthispaper wedonotaccountforthispossibility.
[image:6.595.124.471.60.203.2]Fig.2. Changes in the numbers of casualties and responders over the course of an example MCI response operation.
Fig.2whichchartsthecorrespondingsetsizeoverthefirstfifteen minutesoftheproblemwhichwillbeconsideredinSection4.
In order to extend the model to allow for these changes, we require (a) a heuristic procedure to govern the re-assignment of tasksassignedtoaresponderwhenhe/sheleavestheset,and(b) a heuristic procedure to govern the assignment of tasks associ-ated witha newly discovered casualty. The constructiveheuristic procedure describedin Section 2.3.2 can easily be employed for thispurpose.Oncetaskshavebeeninitiallyassignedinthis man-ner, the local search procedure can go on to find higher quality allocations.
3.3. Objectivespaceparameters
Regarding theobjectivevalues assignedtoanyproposed solu-tion,anumberofparametersuponwhichthesevaluesdependare subjecttouncertainty,orareofadynamicnature,orboth. Specif-ically, thehealth parameterassociatedwitheach casualtywill be
subject tomeasurement error, known morecommonly as
under-triageorover-triage.Inaddition,healthwillevolvewithtime and so this evolution must be predicted, introducing further uncer-tainty. Schedule parameters will also be subject to uncertainty; boththetimeneededtotravelfromonedestinationtoanotherand
thedurationofcertaintasksmustbeestimatedfromthe informa-tionavailable atthatpoint intime,andwillgenerallyhavesome degreeoferror.Moreover,weallowforpossibledelaysinthe com-municationofsuchinformationfromtheproblemenvironmentto themodel.Thedynamicanduncertainnatureoftheseparameters resultsinaschedulewhichevolvesoverthecourseoftheresponse operation.
AsimpleexampleofanevolvingscheduleisgiveninFig.3.The illustration showsthe schedule of a single responder, as viewed
from the perspective of the optimization model, and how this
schedulechangeswithtime. Thesechanges areillustrated on the vertical axis. Note that, in this case, the tasks assigned to the responderdonotchangeintheir ordering,onlyintheparameters describing their timings. As time progresses, tasks move from a freestate(darkgreenorblue)toafixedstate(lightgreenorlight blue).We alsoobservethepointsatwhichinformationregarding the timings of tasks are sent, and the delay in these messages reaching the optimizer, at which point the schedule is updated toreflectthe newinformation.Forexample,theinitial estimated completion time of task t1 is shown to be 7 minutes. However,
thetruedurationisinfact6minutes.Thus,atthe5minutemark, amessageis sentfromthe simulationtothe optimizationmodel notifyingitthatthetruedurationoftaskt1is6minutes.However,
there isa delay of2 minutes in thismessage reaching the opti-mizationmodel. It istherefore not untilthe 8 minutemarkthat theoptimizationmodelisupdated,withthedurationparameterof taskt1 changed fromtheoriginal estimate of7to thetruevalue
of6.Similarbehaviorwilloccurwithrespecttothetimestakento travelbetweentasklocations,asillustrated inthefigure.Thefinal sectionofthefigureillustratesascenariowhereatask,specifically task t2, takes longer to complete than initially forecast. During
the simulationand optimizationof a full problem instance,such evolutionofmodelparameterswillclearlyoccuronamuchlarger scale.
Inordertoimprovetheoptimizationmodelwithrespectto ad-dressingthesechallenges,a numberofalterationsmustbemade. Inwhat followswe give detailsofthese alterations,anddescribe theunderlyingsimulationmodelswhichgoverntheuncertainand dynamicnatureoftheseparameters.
[image:7.595.46.288.58.182.2] [image:7.595.105.504.500.720.2]Table3
The probability of health assessment outcomes with error level .
True health state P( A[ T1]) P( A[ T2]) P( A[ T3])
T1 1 −/2 /2 0
T2 /3 1 −2 /3 /3
T3 0 /2 1 −/2
3.3.1. Casualtiesandhealth
AsdiscussedinSection2.2,thehealthofacasualtyisdescribed throughthediscretetriageclassificationsystemwithstatesT1,T2,
T3 and dead. We wish to increase the realism of the triage as-sessment process by allowing for the fact that the classification assignedto some casualties maynot accurately reflecttheir true healthstate.
Denoting by A[Ti] the eventthat a triage assessment has led toacasualtybeingclassifiedinstateTi,theprobabilitiesofthese events conditional on the true health state of the casualty are givenin Table3. The parameter
∈ [0,1] allows for thedegree
of error to be modified, where
=0 corresponds to completely
accurateclassification. The resultingprobability distribution leads tounbiasederrors, wheretheprobability ofunder-triageisequal totheprobabilityofover-triageincaseswherebothoutcomesare possible.In practice,a significant bias towards theover triage of casualtieshasbeen observed (Frykberg, 2002). We do not model thissystematicbias for two reasons. Firstly, to doso whilst also modelingimprecisionintriageassessmentwouldleadtodifficulty ininterpreting theresults oftheexperimental analysis presented inSection 4.3,asitwouldnotbe clearifanyobservedeffectwas dueto alack ofaccuracy,a bias,orboth. Assuch, removing bias allowsustofocusonevaluatingtheeffectofimprecisiononly. Sec-ondly,whileabiashasbeendocumented,itsprecisenaturehasyet tobeadequatelydescribedinquantitativeterms.
In addition to allowing for errors in the triaging of casual-ties, we wish toallow for thedynamicnature of casualty health inthe online model. The simulation of this dynamicbehavior is
achievedthrough using the same Markovchain model described
inSection 2.2which is usedin predictingfuturevariation in ca-sualtyhealth.Bysimulatingtheactualvariationsinhealthstateof allcasualties,wemaynowperiodicallyupdatethemodeltoreflect anysuchchanges.Thisupdating correspondstoanothertriage as-sessmentbeingcarriedout.ThisisreflectiveofrealMCIresponse operations,wherecasualtiesareregularlyre-assessedandchanges inhealth are noted. The frequencyof anysuch triage operations isavariableofthemodel,whichwewill denote
λ
tri,andwillbeadjustedintheexperimentalanalysisofSection4.2.
Another aspect of casualty behavior which may be captured
viaan onlinemodeling approachis their tendency toself-present
athospital. Self-presentationis knownto occur in MCIresponse, whencasualtieswithlesssignificantinjuries(specifically,thosein healthstateT3)maydecidetoleavetheincidentsiteandtransport themselvestoahospitaloftheir choosing.Selfpresentationleads tochanges in thesolution space, asanycasualty who has trans-portedthemselvestohospitalwillnolongerrequireanyattention fromrespondersandsocanberemovedfromthecasualty process-ingmodel.Self-presentationwillalsoleadtochangesinthe objec-tivespace,withinformationregardinganyself-presentationbeing usedtoupdate modelparameters andallowforbetter prediction ofsolution quality.In particular, upon receiving notification that acasualty hasarrived ata specific hospital itis possibleto infer howlongsaidcasualtyremainedattheirincidentsitebefore leav-ing.Denotingthisobserveddataasx,werequirethataprobability densityfunction p(x|
θ
) relatingx to an unknown parameterθ
is defined, together witha prior probability distribution onθ
,p(θ
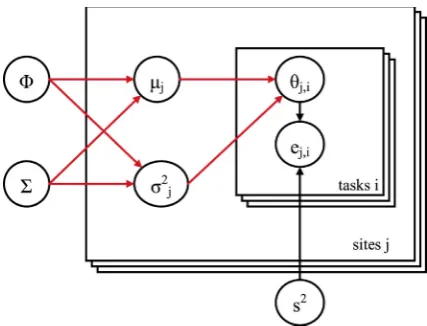
).Fig.4. A hierarchical model of task durations.
Theposteriorprobabilitydistributionoftheunknownparameter
θ
canthenbecalculatedthroughtheusualapplicationofBayesrule:p
(θ
|
x)
= p(
x|
θ
)
p(θ
)
p
(
x)
(3)Inthismanner,estimatesoftheparameter
θ
willimproveoverthe course ofthe responseoperation asrelevant datais accrued, po-tentiallycorrecting anyinaccurate initial specifications. Notethat thisapproachisgenericandmaybeappliedregardlessoftheform oftheprobabilitydistributiondescribingthelengthoftimea casu-altywillwaitbeforeleavingtoself-present.However,casesleading toconjugatepriorswillenablethecalculationofposterior proba-bilitydistributions without anysignificant computationalburden. Asanexample,wemayconsiderself-presentationtimestofollow an exponential distribution.In thiscase, theparameterθ
will be of one dimension andmay be interpreted asthe average rateat whichcasualtiesleavetheincidentsitetoself-present.3.3.2. Taskdurations
As described in more detail in Wilson, Hawe, Coates, and
Crouch(2012),theuncertainnature oftaskdurationsis encapsu-latedthrough a hierarchicalmodel reflecting thedifferent nature ofincidentsitesinamulti-siteMCI.Wediscussthecaseofrescue tasks, notingthat the model fortreatment tasks(pre-rescue and post-rescue)isidentical.
Thetrueduration ofa rescuetaskrelatingtocasualtyi atsite
j,
θ
j,i,isarandom variablewithmeanμ
jandvarianceσ
2j.These
site-specific parameters are themselves considered to be random variables,withjointmean
andcovariancematrix
. This hier-archicalmodel,illustratedinFig.4,willallowforincidentsitesof varying severity(in termsofthedurationsofthetasks tobe un-dertaken there) to be modeled. As in the case of modeling self-presentationtimes,a lackofempiricaldatapreventsusfrom
rec-ommendingaspecificparametricmodeltodescribetheserandom
variables.
Uncertaintyis introduced by generatingunbiased estimatesof each duration
θ
j,i,denoted byej,i,bysamplingfromnormaldis-tributionswithmean
θ
j,iandvariances2.Thisvariance,whichde-terminesthe accuracyofduration estimates,isspecified as prob-lem input. Given these estimates and assumed distribution, the true duration of each task is known to follow the distribution
N(ej,i,s2).Forexample,givenavariances2=0.7 anda simulated
truetaskduration of
θ
j,i=4,the estimatedtaskdurationwill besimulated froma normaldistribution N(4, 0.7).A resulting value of,say, ej,i=5.2 would then be used by the optimizationmodel
[image:8.595.320.534.54.217.2] [image:8.595.73.246.84.134.2]Table4
Problem scenario time line.
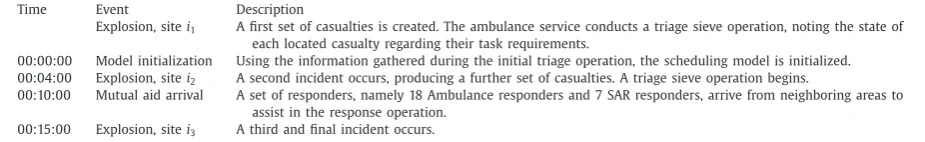
Time Event Description
Explosion, site i1 A first set of casualties is created. The ambulance service conducts a triage sieve operation, noting the state of
each located casualty regarding their task requirements.
0 0:0 0:0 0 Model initialization Using the information gathered during the initial triage operation, the scheduling model is initialized. 0 0:04:0 0 Explosion, site i2 A second incident occurs, producing a further set of casualties. A triage sieve operation begins.
0 0:10:0 0 Mutual aid arrival A set of responders, namely 18 Ambulance responders and 7 SAR responders, arrive from neighboring areas to assist in the response operation.
0 0:15:0 0 Explosion, site i3 A third and final incident occurs.
As itis knownthat
θ
j,iwill followthe distributionN(ej,i,s2),thenatural(mostlikely)estimateof
θ
j,iwillbeej,i=5.2.However,weallowforthemodeltomakeother estimatesinordertoreach adesiredlevelofconfidencethatthetruevaluewillbeequaltoor lessthantheestimatedvalue.Thatis,foragivenconfidencelevel
ψ
∈[0, 1]we estimate the durationof tasksto beθ
ˆj,i=Fj−,i1(ψ
)
where Fj,i denotes the relevant cumulative distribution function.
Forexample,setting
ψ
=0.8wouldresultinconservativetask du-rationsestimateswhichwillover-estimatethetruedurationswith probability0.8.3.3.3. Traveltimes
Travel times are initially estimated by applying Dijkstra’s
al-gorithm (Skiena, 1990) to the road network which covers the
problemenvironment.Thisproceduregeneratesaroute,following whichadistancedtravelledcanbecalculated.Anestimateforthe traveltimeusingthisdistanceisprovidedbythemodelofKolesar, Walker,andHausner(1975),asrecentlyvalidatedbyBudge, Ingolf-sson, andZerom (2010). The function, denoted KWH(d), gives an estimateofthemediantraveltime.Themediantraveltimeisthen estimatedas
ˆ
m=KWH
(
d)
=2.42√d,d≤4.13kilometer
2.46+0.596d,d>4.13kilometer (4)
where4.13=
v
2c/2adenotesthedistancerequiredtotravelinorder
toreach‘cruisespeed’
v
c,andaistheaverageaccelerationofthevehicle asit increasesspeed fromrest to
v
c.The valuesof theseparameters aretakenfromtheanalysisofambulancetraveltimes inCalgary,Canada,presentedin(Budgeetal.,2010).
The actualtravel timeissimulatedthrough applyinga disrup-tion to the transport network, resulting inan uncertain increase inthetimeneededtotraverseeacharc.Thisdisruptionprocedure consistsofrandomlygeneratingamultiplyingfactorforeachroad link, to be applied to the link’s ‘length’ parameter. The level of disruptioniscontrolled byaparameterdenoted
κ
.Thedisruption modelisdescribedinmoredetailinWilsonetal.(2013b).We arerequiredtogenerateandupdatethe probability distri-butionofthetraveltime associatedwitheachjourney,asdefined by a location pair A−B. To do so, we assume travel times are independent andidentically distributedaccording to alognormal distribution, X∼ logN(
ν
,ρ
), withan assumed, constant precisionρ
,asdiscussedinWestgate,Woodward, Matteson,andHenderson (2011). Note the variation in travel times may arise from either variation in the route chosen by responders making the journey in question, or variation the time taken to traverse any specific route. Given the dynamic nature of the problem asdiscussed inSection3,weemploythepreviouslyoutlinesBayesianapproachin revisingtheestimateoftheunknown parameter
ν
asmoretravel time databecomesavailable.Giventheassumedlognormal distri-bution andthe associatedconjugate prior distributionforν
,ν
∼ N(ν
0,ρ
0),wecancalculatetheposteriordistributionfollowingtheobservationofndataxi,
ν
∼N(ν
n,ρ
n)whereν
n=ρ
0ν
0+ρ
n
i=1ln
(
xi)
ρ
0+nρ
(5) and
ρ
n=ρ
0+nρ
. (6)Theexpectationofthisposteriordistribution,
ν
ˆ=E(ν)
,isthen usedasanestimate ofν
,givingX∼logN(
ν
ˆ,ρ)
.Themediantravel timefortherouteinquestioncanthenbeestimatedasmˆ=eνˆ.4. Evaluationandanalysis
Inthis section we report the resultsof severalcomputational experimentsanalyzingtheperformanceofthedescribedmodel.In particular,weaimtoanswerthefollowingkeyquestions:
1.Towhatextentarepre-computedstaticschedulesapplicablein
dynamicproblems?
2.Cantheschedulingmethodologycope withsolutionspace dy-namicsaswellasnon-predictivemethodscan?
3.Howsensitive isthemodeltounderlyingvariationand uncer-taintyinobjectivespaceparameters?
Inordertodosowefirstidentifyproblemcharacteristicswith potential to influence the answers to these questions, and vary theseinacomprehensiveexperimentaldesignto producea large, spacefillingdataset.Thisdataisthenanalyzedthroughthefitting oflinear regressionmodels in order to identifykey relationships
betweenproblemparametersandperformance.
4.1. Problemscenario
Thefollowing elementsoftheproblemscenario areheld con-stantthroughallvariantsusedthroughoutthesetofcomputational experiments:
• Incident sitesI=
{
i1,i2,i3}
– theirlocation,time ofeventandresultingsetofcasualties;
• RespondersR – including initiallocation andarrivalsthrough mutualaid(includingtime(s)ofarrival);
• HospitalsH=
{
h1,h2,h3}
– theirlocation,initialoccupancylev-els,maximumcapacitiesandspecialisttreatmentfacilities.
The sequenceandtimings ofevents occurringinthe problem scenarioisgiveninTable4.
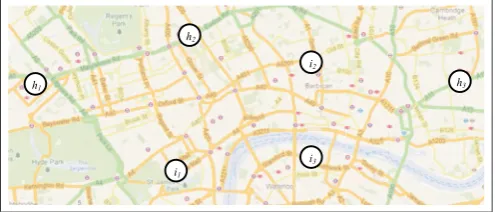
Eachofthethreeincidentsitesresultsinasetofseventy casu-altieswithanidenticalprofileintermsoftheirinitialstate (their healthlevelandwhetherornottheyaretrapped).Respondersare giveninitiallocationswhichcorrespondtooneofthethree hospi-tals’locationsin Fig.5(for Ambulance,MERITandHART respon-ders)or,forSARresponders,oneofseveralfirestationsinthearea (notshown).
In terms of distributional assumptions, we use normal distri-butionsinthehierarchicalmodelofFig.4.Tosimulatetask dura-tions,weuseacommonvaluefortheproblemlevelmeanoftask durationsandcovariance. Thatis,foreach tasktype thevalue of
=
(
μ
¯,σ
¯2)
hasfixedμ
¯ andcovariance,while
σ
¯2 will beal-teredintheexperimentaldesign(seeSection4.2).Forrescuetasks, ¯
[image:9.595.72.535.78.149.2]Fig.5. Three incident sites and three hospitals in central London, as part of the test problem environment.
treatment,
μ
¯ is set to five minutes.We emphasise that these values areexampleonly, andhavebeenchosen todifferentiate between tasktypes.Thecovarianceforalltasktypesis=
1 0.5
0.5 0.5
. (7)
We assume that the times which casualties will wait at inci-dentsitesbeforeleavingtoself-presentatahospitalare indepen-dentandidenticallydistributedfollowingananexponential distri-bution,
τ
csp∼exp(λ
sp)
.Giventhisassumeddistribution,themodelestimateofparameter
λ
spcanbecontinuallyrevisedfollowingthegeneralBayesian strategy outlined in Section 3.3.Specifically, we notethattheGammadistributionactsasaconjugatepriorforthe parameter,
λ
sp∼Gamma(α
,β)
. (8)Here,thehyperparameters
α
andβ
aresettoreflecttheinitial es-timateoftheself-presentationrate.Uponobservingawaitingtimeτ
spc ,theposteriordistributionisupdatedtobe
λ
sp∼Gamma(α
+1,β
+τ
csp)
, (9)andthe parameterofinterest isestimatedas
λ
˜sp=E(λ
sp)
.With-outsufficientdataregardingactualtimesspentwaitingbefore self-presentinginrealMCIs,itisnotpossibletoverifytowhat extent an exponential distribution is a realistic choice in modeling this process.However,givenitscommonuseinqueuingmodels,which areofasimilarnature,itappearstobeanappropriatechoiceand willallowforaninitialanalysisoftheeffectofself-presentationin anonlinemodel.
Finally,wesimulatethegradualdiscoveryofcasualtiesat inci-dentsitesbyrandomlygeneratingatimeatwhichtheyare discov-eredandaddedtothemodel.Thesetimesaregeneratedaccording to an exponential distribution, parametrized so that the average timeforacasualtytobediscoveredisequalto
ρ
.4.2.Experimentaldesign
Consideringthetwomodelsdescribedinthispaper,namelythe pre-computationmodelMpc andtheonlinemodelMo,wewishto
evaluateperformance inproblems exhibiting differentdegrees of dynamicbehavior.PriortoconsiderationoftheonlinemodelMo,it
isofinteresttoevaluate theperformance ofthepre-computation modelMpc in a partially dynamicenvironment. Thatis, we wish
to investigate to what extent a pre-computed, optimized sched-ule will lead to high quality solutions when applied to a more realistic problem scenario than was considered in Wilson et al. (2013a).Followingthis, theonlinemodel Mo willbe evaluated in
fullydynamicproblemenvironments. Theseanalyzes complement
thatpresentedinWilsonetal.(2013a),wherethemodelMpcwas
evaluated in static problemenvironments. In each case, summa-rizedinTable5,evaluationconsistsofcomparingtheperformance
Table5
Model and problem pairs analyzed. Model Problem
Static Partially Fully dynamic dynamic Pre-computed, Mpc Wilson et al. (2013a) 4.3.1 n/a
Online, Mo – – 4.3.2
ofthefull,localsearchbasedschedulingmethodologywiththatof theconstructiveheuristicapproach.
TheproblemscenariodefinedinSection4.1isusedinall prob-leminstancestobeconsideredintheexperimentalprocedure. In-dividualproblem instances mayvary inthe nine dimensions de-scribed in Table 6.For some parameters, namely
λ
1 andλ
5, thechoiceofrangeisanaturalone.Forotherparametersajudgement hasbeenmaderegardingfeasiblelevels;forexample,weconsider itunlikely thatthecommunicationdelaydescribedinSection3.3
willbelargerthanfiveminutes.
The frequency of triage hasbeen allowed to vary from every minutetoevery 20minutes.This includestherateofonce every 15minutes,currentlyusedinpractice.The varianceintask dura-tionstakesvaluesfrom0,correspondingtoalltaskdurationsbeing identical,to 3,which wouldleadto 95 percentoftaskdurations
to be within a range of +/− 3.46 minutes.The maximum delay
in communicating information,denoted
ν
from theresponseen-vironment tothe optimizationmodel hasbeen set to 5minutes, reflectingthefactthatmodelcommunicationtechnologywill pre-vent anymore significant delayfromoccurring. We have consid-ereda rate ofcasualty discovery ranging from an average often per minuteto one every tenminutes, reflectingthe wide variety ofincidentsandthecorresponding difficultyofsearch andrescue operations.Fortheaveragetimeacasualtywillwaitbeforeleaving thesiteto self-present,arangeofbetween5and20minuteshas beenconsidered.
All experimentsfollow a Sobol sequence of500 pointsin the 9dimension experimental design space, asconstructed usingthe R package randtoolbox (Dutang & Savicky, 2013). This provides a set of pointsin the experimentparameter space which is‘space filling’,inthesense thatpointsareevenly distributedaroundthe space.Incontrastwithanexperimentaldesignwhichplacespoints only atthe edges ofthe parameterspace (i.e.,where parameters aresetattheendpointsoftheirranges),aspacefillingdesignwill allowfornon-linearrelationshipsbetweentheparametersandthe responsetobeidentifiedintheanalysisofthedata.
4.3. Results
Inthis section we report theresults ofthe computational ex-perimentsdefinedinSection4.2.
4.3.1. Pre-computedschedulinginpartiallydynamicproblems
Theapplicabilityofthestaticschedulingmodeltodynamic
en-vironments maynow be evaluated through employingthe
simu-lation routine described in this paper. Each experiment involves spending fiveminutes searchingthesolution space.Attheendof thistimethebestsolutionfoundisissuedandtheresponse oper-ationproceedstofollowthecorrespondingschedule,withthe dy-namicanduncertainnature ofall objectivespaceparameters
be-ing simulated.Bymeans ofcomparison,the same problemsetup
[image:10.595.35.283.58.164.2] [image:10.595.320.536.76.138.2]Table6
Experiment design parameters, denoting (a) the coefficients associated with each parameter when fitting linear regression models to the simulated data, and (b) the ranges considered for each parameter.
Parameter Regression coefficient Range Description
Triage assessment error, β1 [0, 1] Error in the triage classification process.
Triage frequency, λtri β2 [1, 20] Time between each triage assessment of any given casualty.
Task duration variance, σ2 β
3 [0, 3] Inherent variation in the durations of all tasks.
Task duration assessment error, s2 β
4 [0, 2] Error in the estimation of durations of all tasks.
Task duration confidence, β5 [0.1, 0.9] Level of confidence required that task duration estimates will not be short.
Communication delay, ν β6 [0, 5] Average wait between a temporal event being recorded and the optimization
model being notified.
Road network disruption, κ β7 (0.5, 2] Extent to which the road transport network is disrupted.
Casualty discovery rate, ρ β8 [0.1, 10] Average time taken to locate a casualty following an incident.
Casualty self-presentation rate, λsp β9 [5, 20] Average time an eligible casualty will wait at scene before leaving to
self-present.
Table7
Descriptive statistics of final objective values across all partially dynamic problem instances, for both search and constructor solution methods.
f1 f2
Mean Min Median Max Mean Min Median Max
Mpcsearch 20.82 9 21 33 31124 18265 30768 51365 Mpcconstructor 17.63 7 18 29 49808 33172 49295 76954
Fig.6. Density plots of final objective values obtained by constructive and search methodologies, pre-computed case.
thejointdistributionofobjectivevaluesascontourplotsforboth cases,wherewelabeltheconstructiveheuristicmethodas‘Heur’. The differences in objective values observed when comparing theexpectedvaluesattheendofthesearchprocesswiththe sim-ulatedvaluesarepresentedinFig.7.
Itisofinterestatthisstagetoconsidertheperformanceofthe staticsearch methodologyinmore detail.Todoso,linear regres-sionmodelsrelatingeachobjectivemeasuretothevariedproblem parameters were fittedinR by considering a‘full’ model, includ-ing potential interactionand higherorder terms,and performing a backwards stepwise variable selection procedure. The resulting estimatesofcoefficientsremaininginthemodelfollowinga back-wardsstepwiseeliminationprocedurearegiven,withtheir95 per-centconfidence intervals, inTables 8and 9. We notethat coeffi-cient
β
0denotesthemodelintercept,whileβ
iisthecoefficientofthetermdenotingtheinitialsolutionvaluegeneratedbythe con-structiveheuristicmethod.
Fig.7. Final simulated values minus initial estimated values of the pre-computed search procedure, where marginal distributions are shown in red. (For interpreta- tion of the references to color in this figure legend, the reader is referred to the web version of this article.)
Table8
Regression coefficients, f1, pre-computed case.
Mean Standard error 2.5 percent 97.5 percent ˆ
β0 16 .43 2.674 11 .17 21 .68
ˆ
βi 0 .2177 0.0503 0 .1188 0 .3165
ˆ
β7 −6 .660 2.282 −11 .14 −2 .177
ˆ
β72 1 .528 0.9030 −0 .2464 3 .302
4.3.2. Onlineschedulinginfullydynamicproblems
[image:11.595.71.540.83.201.2] [image:11.595.47.307.219.515.2] [image:11.595.315.558.308.521.2] [image:11.595.330.541.593.653.2]Table9
Regression coefficients, f2, pre-computed case.
Estimate Standard error 2.5 percent 97.5 percent ˆ
β0 28740 2392 24041 33443
ˆ
βi 1 .220 0 .1078 1 .008 1 .431
ˆ
β1 −1101 605 .4 −2291 88 .47
ˆ
β6 663 .5 13 .44 399 .3 927 .6
ˆ
β7 −26230 2624 −31384 −21074
ˆ
β72 8141 134 .4 6101 10182
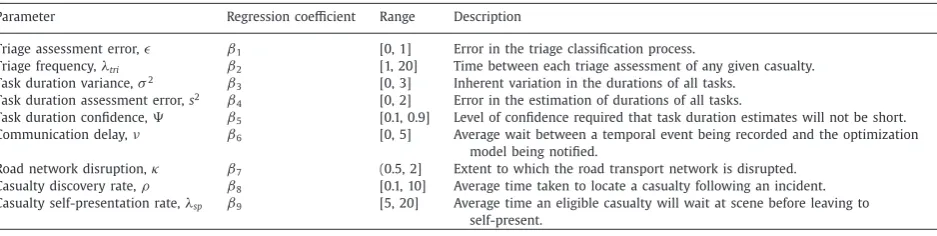
algorithm by that point in time. It is possible, however, that it is instead beneficial to wait a short period of time before issu-ing instructions to responders in the hope that the solution al-gorithmwillfindascheduleofhigherquality.However,anysuch delayinresponderscompletingtaskswillalsohaveanegative im-pactonthequalityoftheoverallresponseoperation.Toassessthe trade-off betweenthesetwofactors,weconductedan experiment wherebythelocalsearchalgorithmwasallowed1,2,3,4or5 min-utestosearchforasolutionscheduleatthestart oftheresponse operation,after which point tasks beganto be issued to respon-ders.Thedistributions ofthequalityoftheresultingsolutions,as expressedbytheirpercentageimprovementoverthesolution pro-ducedbytheconstructiveheuristic,arepresentedinFigs.8and9
asboxplots.
In Fig.8 itcanbeseen thatinthecaseofthefatalities objec-tivef1,anybenefitbroughtthroughtheoptimizationprocessisnot
enoughtocounteractthepenaltyofdelayingactionforanyvalue ofsearch time considered.In contrast,asindicated inFig. 9,this isnot thecase forthe suffering objective f2,which shows
mod-erateimprovementforallsearch timesconsidered.Thus, the lex-icographic ordering ofthese objectives suggests that the optimal policy(fortheexampleconsidered)istoissueinstructionsassoon asresponders become available, ratherthan waitingfor a period
oftime toallowthesearch algorithmto locatehigherquality so-lutions.
Havingestablishedthebenefitsofimmediatelyissuing
instruc-tions, we now consider the performance of the online model in
fully dynamic problem instances. As in Section 4.3.1, both the
scheduling and constructive heuristic methodologies were
em-ployed.TheresultsaresummarizedinTable10andFig.10. Further linear regression models were fit to the data corre-spondingtotheschedulingapproach.Coefficientestimatesare pro-videdinTables11and12.
In order to better appreciate the resulting trends, graphical residualandcomponentplotsofthemostsignificantpredictorsof objectivef2aregiveninFigs.11–13.
4.4. Discussion
The resultsgiven inSection 4.3allow usto answer the ques-tionsposedinSection4.
4.4.1. Towhatextentarepre-computedstaticschedulesapplicablein dynamicproblems?
Consideringtheresultsofthepre-computationcase(Table7&
Fig. 6), we note that the local search approach outperforms the constructiveapproachintermsofobjectivef2.However,inthecase
of objective f1 it is the constructive methodology which results
inbest averageperformance. Incontrast,the resultspresentedin
Wilson et al.(2013a) suggested that the pre-computed approach couldleadtoimprovementsinbothobjectives.Theseresults high-lightashortcomingofthesearchmethodologywhichwasnot ev-ident fromprevious studies. The dangers ofevaluating optimiza-tionmodels forMCIresponseusingunrealisticallystaticand pre-dictableproblemsscenariosisclear.
We note that the initial estimates of fatalities and
suffer-ing resulting from pre-computed solutions are systematically
100 105 110 115
1 2 3 4 5
Time (mins)
P
ercentage change
Fig.8. Percentage change in f1as search time increases (box plots).
80 90 100 110
1 2 3 4 5
Time (mins)
P
ercentage change
[image:12.595.50.270.76.153.2] [image:12.595.134.457.434.562.2] [image:12.595.125.462.590.727.2]Table10
Descriptive statistics of final values across all fully dynamic problem instances, for both search and constructor solution methods.
f1 f2
Mean Min Median Max Mean Min Median Max
Mosearch 19.49 11 20 28 29008 18920 28784 44789 Moconstructor 21.50 10 21 31 31663 21793 31329 43168
Fig.10. Density plots of final objective values obtained by constructive and search methodologies, online case.
Table11
Regression coefficients, f1, online case.
Mean Standard error 2.5 percent 97.5 percent ˆ
β0 24 .34 1.495 21 .41 27 .28
ˆ
β1 −0 .9790 0.2681 −1 .506 −0 .4522
ˆ
β3 −0 .3027 0.1803 −0 .6570 0 .0517
ˆ
β5 2 .477 0.6794 1 .142 3 .812
ˆ
β6 0 .1842 0.1209 −0 .0534 0 .4218
ˆ
β7 −6 .597 2.352 −11 .22 −1 .976
ˆ
β72 1 .764 0.9300 −0 .0637 3 .591
Table12
Regression coefficients, f2, online case.
Estimate Standard error 2.5 percent 97.5 percent ˆ
β0 33285 1596 30149 36420
ˆ
β3 295 .9 193 .2 −83 .68 675 .4
ˆ
β4 1209 287 .1 644 .8 1773
ˆ
β6 286 .6 129 .5 32 .11 541 .1
ˆ
β7 −8168 2518 −13116 −3219
ˆ
β72 1697 995 .9 −259 .9 3654
ˆ
β8 106 .0 58 .31 −8 .55 220 .6
different fromthose realized upon completing the simulation, as shown in Fig. 7. Specifically, the number offatalities is typically over-estimated whereas the level of suffering is typically under-estimated. Thesediscrepancies illustratethe difficulty inensuring accurateforecastswithinthedynamicanduncertainMCIresponse environment.
ConsideringthelinearregressionmodelsfittedinSection 4.3.1
(Tables8and9)wenotethattheleveloferrorintheestimationof taskdurationwasnotidentifiedasasignificantpredictorinterms of either fatalities or suffering. This suggests that the proposed
Fig.11. Residual and component plot for task duration assessment error effects, ˆ
β4s2, with the fitted trend shown in red. (For interpretation of the references to
color in this figure legend, the reader is referred to the web version of this article.)
Fig.12. Residual and component plot for communication delay effects, βˆ 6ν, with
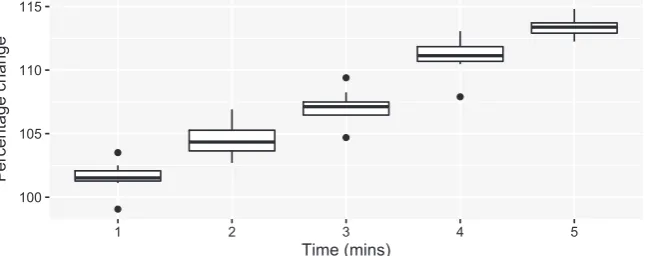
the fitted trend shown in red. (For interpretation of the references to color in this figure legend, the reader is referred to the web version of this article.)
modelisrelativelyrobustto anymisspecificationoftaskduration distributions.Incontrast,errorsinthetriageassessmentof casual-tiesdohavea significantandnegativeassociation withsuffering, asdoesadelayincommunication.Theformereffectdemonstrates theimportanceofhavingaccurateinformationwithregardstothe healthofcasualties,andshowsthatanassumptionthatall health
datais known withcomplete accuracycould produce misleading
conclusions regarding the utility of the model. As would be ex-pected,theinitialexpectedvalueofthepre-computedsolution in-fluences thefinal objectivevalues,confirmingthat some value is retainedthroughoutthesimulation.
Finally, we note that the problem scenarios considered in
the pre-computed case only allowed for dynamic and uncertain
behavior in the objective space. Were such behavior to exist in
[image:13.595.47.302.83.359.2] [image:13.595.313.560.95.322.2] [image:13.595.313.562.371.533.2] [image:13.595.66.272.414.503.2] [image:13.595.65.272.535.622.2]Fig.13. Residual and component plot for road network disruption effects, βˆ 7κ+
ˆ
β2
7κ2, with the fitted trend shown in red. (For interpretation of the references to
color in this figure legend, the reader is referred to the web version of this article.)
scheduleswhichwouldquicklybecomeirrelevantastheresponse operationprogressed.
4.4.2. Canthesearch-basedsolutionmethodologycopewithsolution spacedynamicsaswellasnon-predictivemethodscan?
Intheonlinecase,thelocalsearchsolutionmethodologyresults inimproved performanceinbothobjectives, onaverage(Table10
andFig.10).Thedifferenceinthebivariatedistributionsisshown to be statisticallysignificant undera Hotteling’sT2 test (p≈ 0).
We can therefore conclude that the search based methodology
equippedforonlineuseinthemannerdescribedinthispapercan deliver improved performance over the alternative heuristic ap-proach.
4.4.3. Howsensitiveisthemodeltounderlyingvariationand uncertaintyinobjectivespaceparameters?
Consideringtheregressionmodelsfitted(Tables11and12)we seethat, incomparisonto thepre-computed case, alarger num-berofrelationshipsbetweenparametersandobjectivevalueswere identifiedintheonlinecase.Indeed,allparametersother than
λ
2(frequency of triage) and
λ
9 (rate of casualty self-presentation)were identified as potential predictors of at least one objective
outcome. The omission oftriage frequency may be explained by
thefact that the model onlyallows for thehealth of casualtyto changewhenthey areinahazardousarea.Asthemajorityof ca-sualtieswillbe removedfromsuch areasrelatively quickly,there mayonlybelimitedscopeforhealthtochange.Assuch,increasing frequencyoftriagewillhavelimitedscopetoimpactthequalityof theresponse.
Road network disruption is important, as we would expect
sinceit leadsto longertravel times.The delayincommunication betweentheproblemenvironmentandthemodelalsohasa signif-icanteffectonperformance,asdoestheaccuracyofinitialtask du-rationestimates.However,whilestatisticallysignificantlinear rela-tionshipswiththeseparameterswereidentified,alargeamountof otherwiseunaccountedforvarianceinperformanceremains.
Bothfatalitiesandsufferingareassociatedwithadelayin com-munication,although the associated parameter estimate is lower than in the pre-computed case (see Table 9). This suggests that theonline solution methodology successfully reducesthe impact ofpoorcommunicationby allowing forflexible adaptationofthe schedule.
We notethat theparameterdescribing the‘taskduration con-fidence’,i.e.theconfidencethedecisionmakerrequiresthattheir estimates of taskdurations will be greater than or equal to the
realizedvalue, is identifiedasa significant predictorofthe fatal-ities objective. The relationship is positive and linear, suggesting thatby estimatingtaskdurationinamanner whichwillresultin under-estimatesonaveragecanleadtoimprovedperformance.
5. Conclusions
The dynamicand uncertain nature ofmass casualty incidents representsasignificantchallengetothedesignofarobustand ef-fective optimization model. In this paper we have described the extension ofsuchamodel,whichemploys ataskscheduling rep-resentationofanMCIresponseoperation,tobettercopewiththis volatility.Inparticular,themodelhasbeenextendedforuseinan
online manner, allowing for communication between model and
problemenvironmenttobecarriedoutcontinuallyastheresponse progresses. This has resulted in the removal of several common assumptions madeinsuch models,ashighlighted inGalindoand Batta(2013).
Through the design andanalysis of severalcomputational ex-periments,theperformance ofthemodelina simulated environ-menthasbeenassessed. Ithasbeenshownthatthe extensionof themodelfromitsinitial‘static’ designtotheonlinecasehas re-sultedinsignificantimprovementintermsofbothexpected fatal-itiesandthesufferingofcasualties.Statistically significant associ-ationsbetweenparametersandmodelutilityhavebeenidentified, highlightingtheimportanceoffastcommunicationbetween
prob-lem environment andmodel andthe accurate estimation oftask
durations.Ofequalvalueisthelackofsuchassociationsfoundin
other parameters, whereit maybe naturaltoassume one would
exist,suchasthefrequencyoftriage.
5.1. Furtherwork
Thecomputationalburdenarisingfromevaluatingtheproposed methodologythroughsimulationhasplacedapracticallimitupon
thenumber ofscenarioswhich could beconsidered and
compar-isons which could be made. Furtherwork could, therefore,focus on extending the simulationstudy presented inSection 4.3. One studywhichwouldbeofvaluewouldbetheapplicationofthe on-linemodelMotopartiallydynamicproblemscenarios.Thiswould
thenenableadirect comparisonofthemodels MpcandMoto be
made,helpingtodemonstratethesuperiorityofthelatter. Intheprocess ofdesigningthesimulationoftheMCIresponse
operation, we have made a number of decisions regarding the
nature ofprobability distributions andtheir parameters.
Unfortu-nately, due to the inherently low frequency of MCI events and
the limiteddata collection which occursduringthem, it has not been possibleto basethesedecisions on theresults ofstatistical models.Whiletheassumptionsmadehaveenabledavaluable ex-ploration of the sensitivity ofthe optimization model to the dy-namicanduncertainnatureofMCI responseoperations, itwould beofvaluetoexaminehowrobusttheresultsgeneratedareto vi-olationsof theseassumptions. Forexample,thesensitivity ofthe model to changes in the assumed transition probabilities of the MarkovchaindescribedinSection2.2couldbeassessed.
Asdiscussed inGalindoandBatta (2013),a Bayesianapproach toprocessinginformationinthedynamicenvironmentofdisaster responsemaybeapplicable.Whilethemodelpresentedinthis pa-peremployssuchanapproachwhenconsideringparameterswhich
govern travel times in the road network and the rate at which
[image:14.595.35.281.57.220.2]