City, University of London Institutional Repository
Citation
:
da Silva, I. and Zisman, A. (2012). A Framework for Trusted Services. Paper
presented at the Service-Oriented Computing - 10th International Conference, ICSOC 2012,
12 - 15 Nov 2012, Shanghai, China.
This is the unspecified version of the paper.
This version of the publication may differ from the final published
version.
Permanent repository link:
http://openaccess.city.ac.uk/1605/
Link to published version
:
Copyright and reuse:
City Research Online aims to make research
outputs of City, University of London available to a wider audience.
Copyright and Moral Rights remain with the author(s) and/or copyright
holders. URLs from City Research Online may be freely distributed and
linked to.
City Research Online:
http://openaccess.city.ac.uk/
[email protected]
A Framework for Trusted Services
Icamaan da Silva and Andrea Zisman
Department of Computer Science, City University London, United Kingdom [email protected], [email protected]
Abstract. An existing challenge when selecting services to be used in a
service-based system is to be able to distinguish between good and bad services. In this paper we present a trust-based service selection framework. The framework uses a trust model that calculates the level of trust a user may have with a service based on past experience of the user with the service and feedback about the service received from other users. The model takes into account different levels of trust among users, different relationships between users, and different levels of importance that a user may have for certain quality aspects of a service. A prototype tool has been implemented to illustrate and evaluate the work. The trust model has been evaluated in terms of its capacity to adjust itself due to changes in user ratings and its robustness.
Keywords: Trust model, direct interaction, and recommended feedback.
1.
Introduction
Despite the advances in the area, service selection is still a challenging problem for service-oriented computing. Several approaches have been developed to support the selection of services based on one, or a combination of, functional, behavioural, quality, and contextual aspects [3][17][18][26]. However, given the large number of existing (similar) services and the open characteristics of SOC in which anyone can freely publish services, it is necessary to have mechanisms to distinguish between “good” and “bad” services.
The use of QoS information supplied by service providers [8], or even behavioural information as assumed in certain approaches [17][23], is not enough to distinguish between good and bad services during the selection process. (After all, this information can be inaccurate or exaggerated by service providers.) The use of service level agreements (SLAs) to guarantee certain quality aspects of a service does not assist with the selection process (SLAs are created after services have been selected). In addition, SLA requires extra cost and time to establish and monitor the agreement between the involved parties. As outlined in [9][22], it is important to use mechanisms for service selection that rely on feedback from consumers such as trust
Trust and reputation have been the focus of research in several open systems such as e-commerce, peer-to-peer, and multi-agent systems [5][10][15][16]. Some trust and reputation approaches have been suggested for web-service systems [8][19][22]. In general, web-services based approaches are limited and immature [22]. For example, the majority of these approaches present one or more of the followings issues: (i) assume that information given by service providers can be trusted; (ii) assume that feedbacks provided can always be trusted; (iii) give the same importance for feedbacks provided by different users; and (iv) demand a large number of interactions or non-intuitive information from users.
In this paper we describe a trust-based service selection framework to support the selection of services based on the level of trust a user may have with a service. More specifically, the framework uses a trust model that we have developed to calculate the level of trust a user may have with a service based on past experience of the user with the service (viz. direct interactions), and feedback about the service received from other users (viz. recommended feedback). Unlike existing approaches and models [1][4][5][24], the trust model that we describe in this paper considers different levels of importance that a user may have for the various quality aspects of a requested service, different levels of trust among users, and different relationships between users. For a user U, the approach considers three groups of related users, namely (a)
trusted group, composed by people that U trusts; (b) non-trustedgroup, composed by people that U does not trust; and (c) unknown group, composed by people that U does not know and cannot say anything about the level of trust with them. The different types of relationships will interfere on how the recommended feedbacks are used during the computation of the trust values. The framework also supports the identification of malicious users.
The remainder of this paper is structured as follows. In Section 2 we describe an overview of the framework. In Section 3 we present the trust model used in the framework. In Section 4 we discuss implementation and evaluation aspects of our work. In Section 5 we give an account of related work. Finally, in Section 6 we discuss concluding remarks and future work.
2.
Overview of the Framework
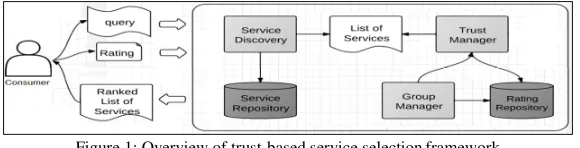
Figure 1 shows an overview of the architecture of trust-based service selection framework with its main components, interactions, and different types of data used as input or generated as output by the main components.
Figure 1: Overview of trust-based service selection framework
The service discovery component identifies candidate services for a service request (query). The framework uses the service discovery component that was developed by one of the authors of this paper to identify services that match functional, behavioural, quality, and contextual aspects of a query. Details of this component are out of the scope of this paper and can be found in [18][26].
The trust manager component is responsible to calculate trust values of services based on a trust model that we have developed (see Section 3). The trust value of a service S is calculated by considering the past experiences that the consumer had with S, the level of trust that the consumer has with other users, the feedbacks about S from other users, and the level of importance the consumer may give for quality aspects of S. All feedbacks about S are stored in the rating repository.
The group manager component assists the framework with the concepts of groups associated with a user; i.e., trusted, non-trusted, and unknown groups. It decides on the group to which a user should be allocated and when a user should move from one group to another. For a user U, the groups of trusted, non-trusted, and unknown users associated with U are defined based on the level of trust that U has with these other users. The level of trust is calculated by comparing the ratings provided by U and the ratings provided by the other users for the services. The framework assumes valid and invalid ratings provided for a service S. More specifically, for two users U and U’ and a service S, a rating for S provided by U’ is valid when the rating matches the rating for S given by U, and it is invalid otherwise. When the rating is valid, the level of trust between U and U’ increases; when the rating is invalid, the level of trust between U and U’ decreases. It is possible to move a user U’ from one group to another group of users associated with U, depending on the level of trust between U and U’. For a service S, the feedbacks of the users in the non-trusted group are ignored during the calculation of the trust value of S.
The rating repository stores ratings provided by the users, the level of importance of the quality aspects for a service, the levels of trust associated with the users, and information about the various groups.
3.
Trust Model
As described before, the trust value that a user Ui has for a service S is based on direct
interaction of user Ui with service S, and recommended feedback from other users for
service S, given by the function below:
!"#$%& ' ()*"#$%& +,(-."#$%& (1)
• TUi(S): is the final trust value calculated for a service S for user Ui;
• DUi(S): is a score for service S based on past interactions of user Ui with S;
• FUi(S): is a score for service S based on recommended feedback from other users
considering the relationships that Ui has with these users (i.e., trusted group,
non-trusted group, and unknown group);
• wd ,wf: associated weights, with wd + wf= 1.
In the case where a user did not have a past interaction with the service, or there are no feedback from other users for the service, these respective values are not considered to calculate the trust value.
Direct Interaction. The score given for the direct interaction with a service (DUi(S))
is calculated based on the work proposed by Josang et al. [6] that uses multinomial Dirichlet probability distribution. In this case, a user provides continuous rating values between 0 and 10, which are mapped to one of the following five categories, namely (i) mediocre, (ii) bad, (iii) satisfactory, (iv) good, and (v) excellent. The rationale for using Dirichlet distribution is to allow support for several category values with a solid statistical foundation, and to be able to represent discrete ratings as a function of a continuous rating.
In the model, the mapping of a rating c [0,10] into a discrete 5-component variable (v1, v2, …, v5) representing the categories (i) to (v) above is based on the calculation
of the level of membership of c for each vi variable according to the function
presented in [6]. The levels of memberships are represented as a vector /01 of size five (viz. membership vector) and c is a rating provided by the user divided by 10. The sum of the values of the vi representing c in vector /01 is equal to 1. For example, in the
situation in which a user gives rating 7.0 for a service S, the values for categories (i) to (v) above (represented as v1, v2, v3, v4, v5) are /01 = [0, 0, 0.2, 0.8, 0], respectively[6].
Our approach considers membership vectors for all the past ratings for a service S
provided by user Ui, as well as the level of importance that Ui gives for different
quality aspects of S. When a user requests a particular service, the user can specify the importance of the service quality aspects by using different weights for each of the aspects. For example, it is possible to use the weights 2: most important aspect; 1: less important aspect; and 0: non-important aspect. A rating given by a user is associated with the service as a whole. The weights given for each of the quality aspects are used to measure the level of similarity between different interactions with the service and to support distribution of ratings with the various quality aspects.
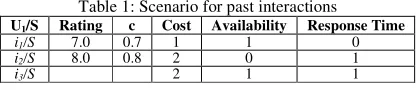
In order to illustrate, consider the scenario in Table 1 in which user U1 had two
past interactions with service S (i1 and i2), with ratings 7.0 (c=0.7) and 8.0 (c=0.8)
respectively. For this scenario, assume the quality aspects of cost, availability, and response time with their respective importance for U1 as shown in the table. Suppose i3 the current interaction of the user. The direct interaction score will be calculated
[image:5.612.202.410.603.648.2]based on the similarities that exist between the quality aspects considered in interaction i3 and the other interactions.
Table 1: Scenario for past interactions
U1/S Rating c Cost Availability Response Time
i1/S 7.0 0.7 1 1 0
i2/S 8.0 0.8 2 0 1
In the model, the similarity between the different interactions is calculated by:
23' ,4 5
6 789; 3:;5 ,9<;=7
4> ,,,,,,,,,,,,,,,,,,,,,,$?& where:
• dl: is the similarity distance between the current and the l-th previous interactions;
• pl,x: is the weight associated with each service quality aspect x in the l-th previous
interaction;
• p’x: isthe weight associated with each service quality aspect x in the current
interaction.
The score for a service S based on past interactions of user Ui with S is calculated
by the function below:
*"#$%& ' , 6CADE@ABA,,, with @A'$AFE&$CFE&,,,,,,,,,,BA'6M G01HAIJK8G01HLIJK=
NOP ,,,,,,,,,,Q01 ' 6 23/013
R
3DE STU,,,,,,,,,,,,$V& where:
• Q01: is the aggregated vector calculated by the weighted sum of all the vectors /00013; • /00013: is the membership vector for a past interaction of Ui;
• n: is the total number of past interactions of Ui; • k: is the total number of categories (k=5);
• dl: is the similarity value for the various quality aspects of S calculated as in (2);
• @A: is a value assigned to each category v1,…,vk to provide a value in an interval;
• C: is a constant used to ensure that all values in the elements of vector Q01,are greater than 0, to allow a posterior analysis of the Dirichlet distribution;
• !!tis the aging factor, where !is a constantand"t is the difference between the time of a user’s request and the time of past interactions with S.
Consider the scenario in Table 1. In this case, the membership vectors for each interaction i1 and i2 are: V1 = {0, 0, 0.2, 0.8, 0} and V2 = {0, 0, 0, 0.8, 0.2}; the
similarity distances are calculated as in (2), with d1 = 0.8 and d2 = 0.9; the aggregated
vectorQ01 = {0, 0, 0.16, 1.36, 0.18}; and DUi(S) = 0.625.
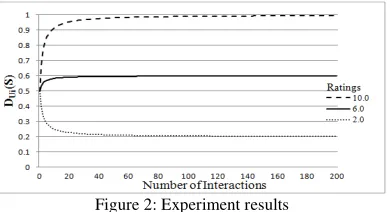
In the model, the number of past interactions of a user with a service S interferes with the calculation of DUi(S). In order to demonstrate this consider an evaluation of
the trust model in which there is an increase in the number of past interactions from a user from 0 to 200 interactions. For this evaluation, suppose the same weights associated with DUi(S) and FUi(S) (wd= wf= 0.5), and C=0.4 (see function (3)). For
each of these past interactions assume the ratings provided by the user as (a) 10.0, (b) 6.0, and (c) 2.0. In all the cases (a) to (c), the evaluation assumes the same level of importance for the service quality aspects (cost = availability = response time = 1).
Figure 2 shows the results of the experiments for the cases (a), (b), and (c) executed in a prototype of the trust model that we have developed. As shown in the figure, when there are no past interactions, the value of DUi(S) is 0.5, given that there
DUi(S) =0.2 after approximately 30 interactions. This is expected since in practice a
[image:7.612.210.405.179.285.2]higher level of trust is achieved with more opportunities of interactions (e.g., the level of trust between individuals usually increases with time).
Figure 2: Experiment results
Recommended Feedback. The score calculated based on recommended feedback
from other users (FUi(S)) uses an associated level of trust between a user Uj and user Ui, and a score for service S calculated based on past interactions of Ujwith S
(DUj(S)). User Uj is classified in one of the three groups (trusted, non-trusted, and
unknown) depending on the level of trust between Uj and Ui. The associated level of
trust for a user Uj is calculated based on the Beta distribution given below:
W"#:"A'
S + 4
$S + X + ?&,,,,,,,,,,,,,,,,$Y& where
• Uj: is a user in one of the groups;
• S: is the number of “valid” recommended feedback provided by Uj;
• X: is the number of “invalid” recommended feedback provided by Uj.
The calculation of the score of recommended feedback from other users (FUi(S)) is
given by the function below. In this case, the approach considers users classified in the trusted and unknown groups.
."#$%& '
6RADEW"#:"A*"A
6RADEW"#:"A
,,,,,,,,,,,,,,$Z&
where
• DUj(S): is the score for service S calculated based on past interactions of user Uj
with service S (see function (3))
• W"#:"A: is the associated level of trust for a user Uj;
[image:7.612.171.436.549.615.2]• n: is the total number of users in the trusted and unknown groups.
Table 2: Scenario for recommended feedback
User Group Previous Interactions Interaction Results [\]:\^ DUj
U2 TG 12 10V, 2I 0.79 0.82
U3 TG 20 16V, 4I 0.77 0.75
U4 UG 2 1V, 1I 0.5 0.88
U5 TG 0 0 0.78 0.65
U6 UG 0 0 0.5 0.31
In order to illustrate the computation of FUi(S), consider the scenario shown in
represent valid and invalid feedbacks. In this case, the level of trust for users U4 and U5 are calculated as the average of the level of trusts for the other users in their
respective groups. For this scenario, FUi(S) = 0.70. Considering the scenarios shown
in Tables 1 and 2, with wd = wf = 0.5, the trust value for service S is TUi(S) = 0.66.
In the model, the number of users in a certain group interferes with the calculation of FUi(S). To demonstrate how the number of users in a group influences the value of FUi(S), consider an evaluation of the trust model in which there is (a) an increment in
the number of users in the trusted group from 0 to 100 with a fixed number of five users in the unknown group, and (b) an increment in the number of users in the unknown group from 0 to 100 with a fixed number of five users in the trusted group. For each above case we analysed the values of the calculated recommended feedback with ratings provided by users as 10.0 and as 0.0. Suppose the same weights associated with DUi(S) and FUi(S) (wd= wf= 0.5), and C=0.4 (see function (3)). Figure
[image:8.612.225.390.340.451.2]3 shows the results of the evaluation for the cases (a) and (b) for ratings of value 10.0. As shown in the figure, the users in the trusted group have a higher influence in the recommended feedback value than the users in the unknown group (the line in the graph for the trusted group is always above the one representing the unknown group). A similar situation occurs when the rating is 0.0.
Figure 3: Results of experiment
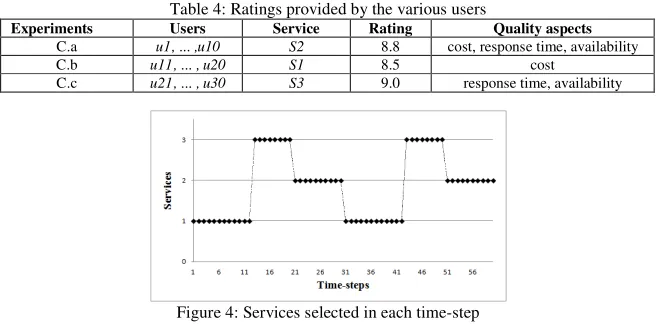
We also analysed how the different service quality aspects used in the model may influence the trust values computed by the model and, therefore, the selection of a service that best matches the request of a user. In this analysis we considered cost, response time, and availability service quality aspects. We executed an experiment in a scenario for 60 units of time (time-steps) with one main user requesting a service with a different importance for a quality aspect in each set of ten time-steps. Table 3 summarises the relevant quality aspects for the user in the different sets of time-steps. We considered three services S1, S2, and S3 with similar functionalities, and 30 other users interacting with one of the three services and providing ratings accordingly to their satisfaction with respect to a service and certain quality aspects. Table 4 summarises the ratings provided by the various users for a service and the respective quality aspect considered for each case in the experiment.
Table 3: Quality aspects with respect to the time-steps
Time-steps 1-10 11-20 21-30 31-40 41-50 51-60
Quality aspects
cost resp. time, availability
cost, resp. time, availability
Cost resp. time, availability
Table 4: Ratings provided by the various users
Experiments Users Service Rating Quality aspects
C.a u1, ... ,u10 S2 8.8 cost, response time, availability
C.b u11, ... , u20 S1 8.5 cost
C.c u21, ... , u30 S3 9.0 response time, availability
Figure 4: Services selected in each time-step
Figure 4 shows the services that were selected in each time-step for the above scenario. In this case the services were selected taking into consideration the quality aspects of the services and the user requests, and not necessarily the service with the highest rating provided by the users (S3 in this scenario).
4.
Implementation Aspects and Evaluation
A prototype tool of the framework has been implemented. The trust manager and group manager components were implemented in Java (J2SE), and the rating repository was implemented in MySQL database. The service discovery component was also implemented in Java and is exposed as a web service using Apache Axis2. To simulate the different behaviours of the users in the evaluation, we implemented a simulator in Java for requests and ratings provided by different users.
The work was evaluated in terms of Case (1): the time required by the trust model to adjust trust values due to changes in user ratings; and Case (2): the robustness of the trust model against unfair ratings, as described inthe following.
Case (1): This case is concerned with the level of match that exists between the trust
value of a service S and user ratings given for this service. More specifically, we measure the time that it takes the trust model to adjust itself with respect to changes in the ratings provided by users, so that the trust value of S matches the rating values received by users of S. The matching levels (ML) are in a scale of 0.0 to 1.0, where a full match has a matching level of 1.0, and are calculated using the function below:
_` ' 4 5 7,$a"b$%& 5 ,!$%&&7,,,,,,,,,,,,,,,,,,,,,$c&
where:
• µUr(S) is the expected value for the user ratings for service S, calculated based on rating intervals;
• T(S) is the trust value for service S.
service quality can be caused due to modifications in the services by service providers, in order to satisfy new requirements and demands, or new rules and regulations. The changes in the service quality can also be caused due to deviations in the expectations of the users of a service. For example, users are always demanding faster responses for their online requests, or expecting to pay less for a service.
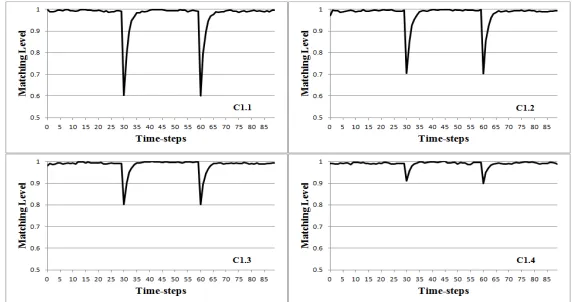
The evaluation was executed in a scenario in which one main user requests the trust value of a service S and 100 other users interact with S and provide ratings for S, within a certain interval of values, for a certain moment of time. In the evaluation we considered 90 units of time (time-steps). We also assumed that for each interval of 30 time-steps there is a change in the ratings provided by the users. We considered aging factor of !=0.5 (see function (3)), and the times for the user requests and past iterations as the values of the time-steps. We executed the experiments for four different cases with respect to the interval of ratings provided by the users in each time-step (C1.1, C1.2, C1.3, and C1.4). In each case, we started with the highest rating interval (values [10.0, 8.0]) for the first set of 30 time-steps; dropped the ratings for the second set of 30 time-steps to intervals of [0.0, 2.0[, [2.0, 4.0[, [4.0, 6.0[, and [6.0, 8.0[, respectively; and raised the rating values within the interval of [10.0, 8.0] again in the third set of 30 time-steps, to provide different values across the range of possible ratings. The ratings within each of the intervals are randomly generated, by using a module that we have implemented, based on uniform distribution.
[image:10.612.154.440.484.635.2]Figure 5 shows graphs with the results of the experiments for the four cases above. As shown in the figure, the matching level of the trust values with the ratings given by the users in each case drops after each 30 time-steps (when there is change in the rating). The results also show that the approach takes between four and seven time-steps for a full match between the interval of the trust value and the interval of the ratings given by the users, depending on the variation level in the rating intervals. For example, in the case of interval ratings between [0.0, 2.0[ (case C1.1), the approach takes seven time-steps to achieve a match between the trust value and the rating. In the case of interval ratings between [6.0, 8.0[ (case C1.4), the approach takes four time-steps to achieve the match. Similarly, in the cases C1.2 and C1.3 the approach takes five and six time-steps to achieve the match, respectively.
Figure 6: Minimum Matching levels according to the rating variation
Figures 5 and 6 show the minimum values achieved for the match between the trust and rating interval values. As shown in Figure 6, these values grow linearly with respect to the reduction in the difference of the rating intervals (continuous line in the figure). More specifically, the drops in the matching values are 0.60 in the case C1.1; 0.703 in the case C1.2; 0.802 in the case C1.3; and 0.898 in the case C1.4.
Based on the experiments, we also noticed that the use of an aging factor influences the amount of time it takes for the trust value to reach a match with a given rating interval. This was observed by executing the above experiments (C1.1, C1.2, C1.3, C1.4) without taking into account the aging factor for past rating values and, therefore, considering the same importance for all rating values throughout all time-steps ("t=0 in function (3)). Table 5 summarises the number of time-steps for each case in the experiment when the trust values match the respective interval of the rating values. The minimum values achieved for the match between the trust and rating values are shown in Figure 6 (dashed line). These values are smaller when compared to the situation in which an aging factor is used. However, they are still linear with respect to the rating variation values.
[image:11.612.209.405.149.263.2]The above results are expected given that when using an aging factor, older past ratings have very little importance when compared to more recent past ratings for a certain time-step. Contrary, in the case in which the aging factor is considered, the older past ratings have the same level of importance than the most recent ones, requiring more user iterations for the trust values to match the rating values.
Table 5: Number of time-steps needed to reach a full matching level without the aging factor
Cases C1.1 C1.2 C1.3 C1.4
Number of Time-steps 240 183 124 60
Case (2): This case is concerned with the robustness of the trust model with respect to
unfair ratings provided by malicious users. By robustness we mean the capacity of the model to provide trust values that are not influenced by unfair ratings. In the approach, this is achieved by identifying unfair ratings and not considering them in the calculation of the trust values. Unfair ratings are a major challenge to approaches based on users’ feedbacks since it is possible to have users providing ratings to either promote or discredit a particular service according to their interests.
[image:11.612.139.475.516.547.2]Section 2, the feedbacks provided by users are classified as valid or invalid. This classification is used to update the trust level among users and to move users to the non-trusted group, when applicable. Feedbacks from users in the non-trusted group are ignored during the trust calculation process.
As in the Case (1), the evaluation was executed in a scenario in which one main user requests a particular service S, and considering 90 units of time with 100 users providing ratings for S in each time-step. We assumed service S with excellent quality level; i.e.; fair feedback ratings for S are in the interval [10.0, 8.0]. We considered unfair feedback ratings for S as values in the interval [0.0, 4.0]. We also considered that the main user requesting service S provides a fair feedback rating for S. The 100 users in the experiments are divided into two sets with 50 users in each set. We assumed users in the first set always providing fair feedback ratings, and users in the second set giving unfair ratings (malicious users).
We executed the experiments for five different cases (C2.1 to C2.5) with respect to the percentage of unfair ratings provided by the 50 users in the second set. In the case C2.1, 100% of the ratings provided by the 50 users in the second set were unfair ratings (values between [0.0, 4.0]); while in the cases C2.2, C2.3, C2.4, and C2.5, 80%, 60%, 40%, and 20%, respectively, of the provided ratings by the users in the second set were unfair. The rating values within each of the situations considered in the experiments are randomly generated, for the interval of fair and unfair ratings. In time-step 0 of the experiment, we considered that there has been no feedback ratings provided for service S and assumed an initial default trust value for this service as 0.5.
We analysed the robustness of the model by considering situations in which the concept of the different groups are used and when the concept of groups are not used. We considered that a user moves to the non-trusted group when the associated level of trust between this user and the user requesting the service is less than 0.3 (see Section 3); furthermore, we considered that a user in the non-trusted group moves out of this group (becomes a trusted user) when the associated level of trust is greater or equal to 0.7. The use of a high value for the associated level of trust to remove a user from the non-trusted group is to reflect the fact that, in general, when an individual looses trust with someone else, it is necessary to have more evidence of good attitude to restore trust between the individuals.
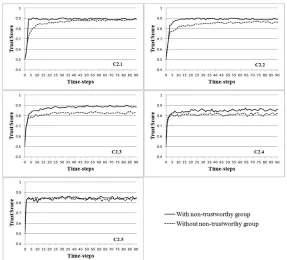
Figure 7 shows the results of the experiments for the cases C2.1 to C2.5, respectively, with and without the existence of the groups. As shown in Figure 7, when using the concept of groups, for the case C2.1 the model reaches the trust value of 0.9 for S faster than in the cases C2.2 and C2.3. In the case C2.1 this happens because the approach quickly identifies malicious users and moves them to the non-trusted group. For the cases C2.2, and C2.3, the same happens, although it takes the model more time to identify the non-trusted users. In the cases C2.4 and C2.5, the model never reaches the value of 0.9, given the low percentage of unfair ratings provided by the users in the second set, not allowing the approach to move a large number of users to the non-trusted group. Table 6 shows a summary of the number of users that are moved to and from the non-trusted group for each case.
The graphs also show that in the cases C2.1 and C2.2, the differences in the trust values for using and not using the concept of groups start bigger and are reduced with time, while in the cases C2.3 and C2.4; these differences are more constant since the beginning. This is because the reduction in the number of unfair ratings given by the users in the second group (reflected in the various percentages) makes it more difficult to distinguish between malicious and non-malicious users. For the case C2.5, there is no difference when using or not the concept of groups. This is because the low number of unfair rates (20%) yields on few users moving to the non-trusted group and a high percentage of those users to leave the group (see Table 6).
Figure 7: Trust scores according to unfair ratings with and without the non-trusted group
[image:13.612.162.449.242.502.2]The above results demonstrate that the concept of groups provide better results than when not using the groups for the majority of the cases, or the same result when there is a low percentage of unfair ratings. Moreover, the approach supports the identification of the majority of malicious users (all of them for the cases C2.1, C2.2, and C2.3). The way the approach considers the notion of valid and invalid ratings also contributes to the results achieved by the approach.
Table 6: Number of users moved from and to the non-trusted group
Cases C2.1 C2.2 C2.3 C2.4 C2.5
Users that moved to 50 50 50 28 9
5.
Related Work
Several approaches have been proposed to support service selection, trust, and reputation management systems [5][10][15][16]. Some of these approaches propose different ways to combine feedbacks from users of services in order to calculate appropriate reputation scores [5][13][14][11][20]. Many of these approaches are concerned with only reputation management aspects and do not consider QoS attributes and different levels of trust between users, as in the case of our work.
Existing trust models can be classified as (i) Bayesian models [5][13], when trust values are calculated based on probabilistic distribution; (ii) belief models [4][24], that associates degrees of belief to the possible output supported by the model; and (iii) discrete models [1], that associate discrete categories to determine the level of trust with other users or services. The reputation model in [5] is based on beta distribution and considers direct experience as well as feedback from other users to model the behavior of a system. The belief model in [4] uses metrics called opinion to describe belief and disbelief about a proposition, as well as the degree of uncertainty regarding probability of an event. The discrete model in [1] takes into account the perception a user has from another user. The trust model described in this paper is based on the combination of concepts from Bayesian and discrete models. More specifically, we extend the approach in [5] to support the calculation of trust values considering different levels of importance for quality aspects of a requested service and different relationships between users (group concept). Similar to our model, in [5] the model supports different levels of trust between users. However, our model calculates these levels of trust based on a beta distribution, while in [5] this are calculated based on opinion. The concepts of discrete model used in our approach are represented by the notion of groups.
A large number of works have been proposed to support service selection in which more than one feedback from users are considered [2][25][19][12][11][21][7]. However, the majority of these approaches fail to provide a good reputation management system as they consider the available feedbacks in the same way when calculating trust values [2][25][19][12][11]. This causes a significant drawback given that these approaches are not able to distinguish between malicious users and do not provide proper importance to users’ feedback with a good history of past interactions. Furthermore, some of these approaches usually demand a large amount of information from the service consumers [2][25][19][11][12]. In some cases these approaches even demand non-intuitive information such as graphs curves to calculate the trust values, or several parameters to be configured in order to achieve a good performance [21].
The work in[2] proposes a framework for quality of service management based on user expectations. The users are responsible for providing ratings and expectation values on QoS attributes. The approach described in [25] uses a reputation manager to calculate reputation scores and assumes that service consumers will provide QoS requirements, weights to be associated to the reputation score, QoS scores, and ratings to assess the services. This approach considers the most recent rating of each user and assumes that all users provide non-malicious and accurate ratings.
several interactions with the users. The proposal to mitigate this issue is based on the presentation of non-intuitive curves. The work in [12] does not have any mechanism to prevent malicious feedback and does not provide ways of checking whether the same feedback in different websites is used more than once. The framework in [11] uses an ontology-based approach to assist providers to advertise their services and consumers to express their preferences and ratings.
The QoS-based service selection and ranking solution in [21] supports prediction of future quality of web services. The authors introduce a mechanism to avoid unfair ratings based on statistical analysis of the reports from users. The success of the proposed methodology depends on the selection of an optimal configuration for the design parameters. On another example, in[7] a method to calculate reputation based on users’ ratings, service compliance, and verity is described. Compliance refers to performance history with respect to delivering the agreed level of qualities. Verity represents the success of a web service or service provider in meeting the agreed quality levels and is calculated based on the variance of the compliance levels. No mechanism to avoid malicious users and unfair feedbacks is provided.
The framework and trust model described in this paper complement existing service selection reputation approaches. It differs from existing approaches by providing a model to calculate trust values of services based on different trust levels between users of the services, level of importance of service quality aspects, and weighted recommended feedback. The approach also considers the notion of valid and invalid feedbacks when calculating the trust values of the services.
6.
Conclusion and Future Work
In this paper we presented a framework for trust-based service selection. It uses a trust model to calculate the trust value of a service based on past experience of the user of the service and feedback ratings about the service received from other users. The trust model also considers the level of trust among users, and level of importance for different quality aspects of the services. The users can be classified in three groups, namely trusted, non-trusted, and unknown users. This classification is considered when using feedback ratings from users to calculate trust values. The approach also supports identification of malicious users based on the comparison of rating values.
References
[1] A. Abdul-Rahman and S. Hailes. Supporting Trust in Virtual Communities. HCISS, 2000.
[2] V.Deora, J.Shao, W.A.Gray, N. J. Fiddian. A Quality of Service Management Framework Based on User Expectations. Intl. Conference on Service Orienting Computing, 2003.
[3] J.Hausmann, R.Heckel and M.Lohmann. Model-based Discovery of Web Services. Intl. Conference on Web Services 2004.
[4] A. Josang. A Logic for Uncertain Probabilities. International Journal of Uncertainty, Fuzziness and Knowledge-Based Systems, 9(3):279311, 2001.
[5] A. Josang and J. Haller. Dirichlet Reputation Systems. 2nd International Conference on Availability, Reliability and Security (ARES 2007), Vienna, April 2007.
[6] A. Josang, X. Luo, and X. Chen. Continuous Ratings in Discrete Bayesian Reputation Systems. Proceedings of the IFPIM 2008.
[7] S. Kalepu, S. Krishnaswamy, and S. W. Loke. Reputation = f(User Ranking, Compliance,
Verity). Proc. of the IEEE International Conference on Web Services, 2004.
[8] Y. Liu, A. Ngu, and L. Zheng. QoS computation and policing in dynamic web service selection. Proc. of World Wide Web Conference, 2004.
[9] Z. Malik and A. Bouguettaya. Reputation Bootstrapping for Trust Establishment among Web Services. IEEE Internet Computing, v. 13, n.1, 2009.
[10] Y. Matsuo and H. Yamamoto. Community gravity: Measuring bidirectional effects by trust and rating on online social networks. World Wide Web Conference, 2009.
[11] E. M. Maximillen and M. P. Singh. Multiagent System for Dynamic Web Services Selection. Proc. 1st Workshop on Service-Oriented Computing and Agent-Based Engineering, 2005.
[12] L. Meng, Z. Junfeng, W. Lijie, C. Sibo, and X. Bing. CoWS: An Internet-Enriched and Quality-Aware Web Services Search Engine. Intl. Conference on Web Services, 2011.
[13] L. Mui, M. Mohtashemi, and A. Halberstadt. A computational Model of Trust and Reputation. Proc. of the 35th Hawaii International Conference on System Science, 2002.
[14] H.T. Nguyen, W. Zhao, and J. Yang. A Trust and Reputation Model Based on Bayesian Network for Web Services, IEEE International Conference on Web-Services 2010, Miami.
[15] S. Ruohomaa and L. Kutvonen. Trust Management Survey. Proc. of iTrust, 2005.
[16] J. Ben Scharfer, D. Frankowski, J. Herlocker, and S. Sen. Collaborative Filtering and Recommender Systems. Lecture Notes in Computer Science, V. 4321, 2007.
[17] Z. Shen and J. Su. Web Service Discovery Based on Behavior Signature. IEEE SCC 2005.
[18] G. Spanoudakis and A. Zisman. Discovering Services during Service-based System Design using UML, IEEE Transactions of Software Engineering 36(3): 371-389, 2010.
[19] A. Srivastava and P. G. Sorenson. Service Selection based on customer Rating of Quality of Service Attributes. IEEE International Conference on Web Services, 2010.
[20] L. Tan, C. Chi, and J. Deng. Quantifying Trust Based on Service Level Agreement for Software as a Service. Proc. Of Intl. Computer Software and Applications Conf., 2008.
[21] L. Vu, M. Hauswirth, and K. Aberer. QoS-based Service Selection and Ranking with Trust and Reputation Management. Proc. of the Cooperative Information System Conf., 2005.
[22] Y. Wang and J. Vassileva. Towards Trust and Reputation Based Web Service Selection: A Survey. International Transaction Systems Science and Applications, v. 3, n. 2, 2007.
[23] X. Wang, T. Vitvar, T. Kerrigan and I. Toma. A QoS-Aware Selection Model for Semantic Web Services. 4th Int. Conf. on Service Oriented Computing, 2006.
[24] Y. Wang, and M.P. Singh. Evidence-Based Trust: A Mathematical Model Geared for Multiagent Systems. ACM Transactions on Autonomous and Adaptive Systems, 2010.
[25] Z. Xu, P. Martin, W. Powley, and F. Zulkernine. Reputation-Enhanced QoS-based Web Services Discovery. IEEE International Conference on Web Services, 2007.