Citation:
Eberhard, R., Thorburn, P., Rolfe, J., Taylor, B., Ronan, M., Weber, T., Flint, N., Kroon, F., Brodie, J., Waterhouse, J., Silburn, M., Bartley, R., Davis, A., Wilkinson, S., Lewis, S., Star, M., Poggio, M., Windle, J., Marshall, N., Hill, R., Maclean, K., Lyons, P., Robinson, C., Adame, F., Selles, A., Griffiths, M., Gunn, J., McCosker, K., 2017. Scientific Consensus Statement 2017: A synthesis of the science of land-based water quality impacts on the Great Barrier Reef, Chapter 4: Management options and their effectiveness. State of Queensland, 2017.
© State of Queensland, 2017
The Queensland Government supports and encourages the dissemination and exchange of its information. The copyright in this publication is licensed under a Creative Commons Attribution 3.0 Australia (CC BY) licence. Under this licence you are free, without having to seek our
permission, to use this publication in accordance with the licence terms. You must keep intact the copyright notice and attribute the State of Queensland as the source of this publication. For more information on this licence, visit creativecommons.org/licenses/by/3.0/au/deed.en.
Contents
Executive summary ... 1
Introduction ... 16
Synthesis process ... 16
Scope and limitations ... 16
The questions this chapter seeks to answer ... 16
Chapter structure ... 17
Wicked problems—tackling complexity in the Great Barrier Reef ... 17
Why the Great Barrier Reef is a wicked problem ... 17
General principles for addressing wicked problems ... 18
Values at risk ... 18
Environmental ... 18
Economics ... 19
Community values ... 21
Indigenous values ... 22
Conclusions ... 24
Management goals and targets ... 26
Reef Water Quality Protection Plan targets ... 26
Progress against targets ... 28
Catchment condition targets ... 29
End-of-catchment load reduction targets ... 29
Expected outcomes of meeting Reef Water Quality Protection Plan targets ... 31
What is success? ... 31
What does success mean for the Great Barrier Reef? ... 33
The Great Barrier Reef governance system ... 33
Great Barrier Reef water quality programs ... 35
Partnerships ... 35
Planning ... 36
Education and incentives ... 37
Regulation ... 38
Market instruments ... 38
Monitoring, evaluation and reporting ... 39
Issues beyond current programs ... 39
Climate change ... 40
Impact assessment and management of major infrastructure projects ... 40
Policy alignment ... 40
Conclusions ... 41
Agricultural practice change ... 45
Effectiveness of agricultural practice change... 45
Sediments ... 45
Pesticides ... 64
Conclusion... 71
Economic dimensions of agricultural practice change ... 75
The costs of improving water quality at the farm level ... 75
Factors influencing adoption ... 81
Assessing overall cost effectiveness of management practices ... 82
Mechanisms to achieve change ... 88
Prioritisation ... 88
Conclusion... 89
Social dimensions of agricultural practice change ... 92
Understanding adoption ... 92
Characteristics of the practice and ‘best practice’... 93
Awareness of the problem... 93
Working with diversity among landholders ... 94
Values, motivations and goals ... 94
Primary income source ... 95
Personal reputation and ‘cultural capital’ ... 95
Joint decision-making and social learning ... 95
Information, intermediaries and advice networks ... 96
Participation in practice improvement or conservation programs ... 96
Conclusion... 97
Prioritising investments in agricultural practice change ... 101
The effectiveness of other land management practices in improving water quality ... 102
Urban ... 102
Urbanisation risks ... 102
Managing the risks of urban areas ... 103
Future research and data needs ... 109
Conclusions ... 110
Ports ... 112
Factors influencing port water ... 112
Conclusion... 114
Wetlands and treatment systems ... 116
Wetlands and coastal ecosystems ... 116
Treatment systems ... 120
Reinstatement of wetland function (‘system repair’) ... 121
Conclusion... 123
Land use change ... 126
Other pollutants ... 127
Marine debris ... 127
Sewage treatment plants ... 127
Acronyms, units and definitions
AcronymsAPSIM = Agricultural production systems sIMulator model
BMPs = Best management practices as defined by the Reef Water Quality Risk Frameworks
(Australian and Queensland governments, 2013a). Where industry programs are specifically referred to these are described as ‘industry best management practices’.
DIN = dissolved inorganic nitrogen
ICTs = information and communications technologies ISO = International Organization for Standardization NRM = natural resource management
PN = particulate nitrogen PP = particulate phosphorus
PSII herbicides = photosystem II inhibiting herbicides TN = total nitrogen
TSS = total suspended sediment1
Units
$/t = dollars per tonne
g/m2/yr = grams per square metre per year
gN/m3/d = grams of nitrogen per cubic metre per day gP/m3/d = grams of phosphorus per cubic metre per day ha = hectares
kg/ha = kilograms per hectare
kgN/ha = kilograms of nitrogen per hectare kgN/ha/yr = kg of nitrogen per hectare per year kgP/ha = kilograms of phosphorus per hectare kgP/ha/yr = kg of phosphorus per hectare per year km = kilometres
km2 = square kilometres m = metres
m3/yr = per annual cubic metre ML/d = megalitre per day mm/yr = millimetres per year t/ha = tonnes per hectare
Definitions
Economic surplus measures: technical measures to estimate the benefits associated with commercial, recreation, amenity and non-use benefits.
Marginal Abatement Cost Curves: the extra cost per unit of pollutant reduction achieved ordered from lowest to highest.
Non-use values: These are values that people hold for protecting the reef and can include aspects such as wanting their children to visit the reef and have it exist in good condition.
Acknowledgements
This chapter was led by Eberhard Consulting with contributions from several representatives from Alluvium Consulting, the Australian Institute of Marine Science (AIMS), Central Queensland
University (CQU), the Commonwealth Scientific and Industrial Research Organisation (CSIRO), Earth Environmental, Griffith University, James Cook University (JCU), Queensland Department of
Agriculture and Fisheries, Department of Environment and Heritage Protection (DEHP), Queensland Department of Natural Resources and Mines (DNRM) and the Queensland Department of Science, Information Technology and Innovation (DSITI).
Unlike the other chapters in the Scientific Consensus Statement, this chapter presents discrete components that were led by the lead authors identified below.
• Overall chapter coordination and lead author– Rachel Eberhard • Agricultural practice change – water quality – Peter Thorburn • Agricultural practice change – economic dimensions – John Rolfe • Agricultural practice change – social dimensions – Bruce Taylor • Wetlands and treatment systems – Mike Ronan
• Urban – Tony Weber and John Gunn • Values and governance – Rachel Eberhard
We would like to thank Richard Margerum (University of Oregon), Karen Vella (Queensland
University of Technology) and Allan Dale (JCU) for the advice and review on the governance section of this chapter.
We acknowledge the advice and recommendations on the drafts of the social dimensions section from Ruth Nettle (University of Melbourne), John Pickering (Behaviour Innovation), Sharyn Rundle-Thiele (Griffith University) and Jeanette Durante (DSITI).
We also acknowledge the contribution of Stuart Whitten (CSIRO) on the economic dimensions section and that of Andrew O’Neill (Healthy Land and Water) on the urban section.
We thank David Toms (DEHP) and Neil Saintalin (Macquarie University) for their evaluations and comments on the wetlands and treatment systems section.
Executive summary
This chapter seeks to answer the following questions: 1. What are the values of the Great Barrier Reef?
2. How effective are better agricultural practices in improving water quality? 3. How can we improve the uptake of better agricultural practices?
4. What water quality improvement can non-agricultural land uses contribute? 5. How can Great Barrier Reef water quality improvement programs be improved? Each section summarises the currently available peer reviewed literature and comments on implications for management and research gaps.
This chapter has a wider scope than previous Scientific Consensus Statements, including, for the first time, the social and governance dimensions of management and the management of
non-agricultural land uses. These new sections are constrained by a lack of Great Barrier Reef–specific data and information. The relevance of information from other locations must be carefully considered. In comparison, the agricultural practice change and economics sections provide an update on material compiled as part of the 2013 Scientific Consensus Statement.
This report has been confined to peer reviewed literature, which is generally published in books and journals or major reports. There is additional evidence in grey literature, such as project and
program reports, that has not been included here. Each section of this chapter has been compiled by a writing team and then revised following a series of review processes.
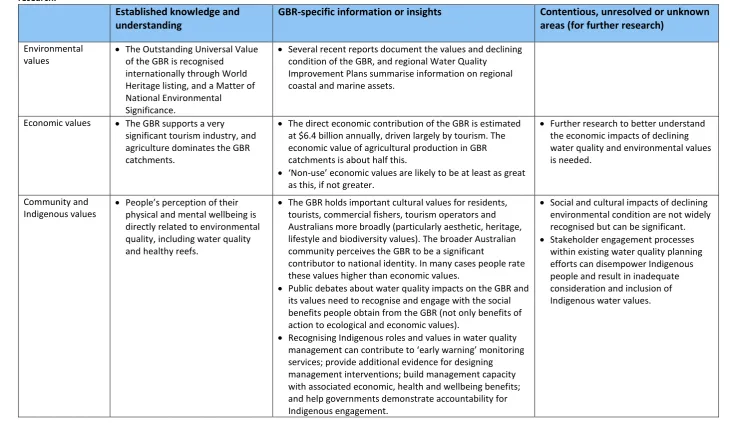
The values of the Great Barrier Reef
Evidence of the environmental, economic, social and cultural values of the Great Barrier Reef includes:
• The environmental values of the Great Barrier Reef are recognised as globally significant (outstanding universal value) in its World Heritage listing and nationally as a Matter of national environmental significance under the Environment Protection and Biodiversity Conservation Act 1999.
• The declining condition of the environmental values of the Great Barrier Reef is widely reported. Regional Water Quality Improvement Plans summarise information on regional coastal and marine assets.
• The annual direct economic contribution of the Great Barrier Reef is estimated at $2.9 billion in the Great Barrier Reef regions and $6.4B in Australia overall, driven largely by tourism. The economic value of agricultural production in Great Barrier Reef catchments is about half that.
• ‘Non-use’ economic values are likely to be at least as great as these estimates, if not greater. The Great Barrier Reef holds important cultural values for residents, tourists, commercial fishers, tourism operators and Australians more broadly (particularly aesthetic, heritage, lifestyle and biodiversity values). The broader Australian community perceives the Great Barrier Reef to be a significant contributor to national identity. In many cases, people rate these values higher than economic values.
• Public debates about water quality impacts on the Great Barrier Reef need to recognise the social benefits people obtain from the Great Barrier Reef (not only benefits to ecological and economic values) and the reciprocal benefits to the reef of good stewardship.
Key knowledge gaps include:
• understanding the social, cultural and economic impacts of declining water quality and environmental values on communities and industries
• incorporating and valuing the benefits to reef condition (and human wellbeing) that arise from stewardship actions
• how to effectively harness the strong values that the community places on the Great Barrier Reef to support more effective management
• improving Indigenous engagement in Great Barrier Reef water quality planning and programs.
Management goals and targets
Reef Water Quality Protection Plan targets
The Reef Water Quality Protection Plan (2013) includes land and catchment management targets to address improved agricultural management practices and the protection of natural wetlands and riparian areas. These targets are based on the understanding of the link between land condition, management practice standards and water quality outcomes.
The management practice and land condition targets to be achieved by 2018 are:
• 90% of sugarcane, horticulture, cropping and grazing lands are managed using best management practice systems (soil, nutrient and pesticides) in priority areas • minimum 70% late dry season ground cover on grazing lands
• the extent of riparian vegetation is increased
• no net loss of the extent, and an improvement in the ecological processes and environmental values, of natural wetlands.
The water quality targets to be achieved by 2018 include:
• at least a 50% reduction in anthropogenic end-of-catchment dissolved inorganic nitrogen loads in priority areas
• at least a 20% reduction in anthropogenic end-of-catchment loads of sediment and particulate nutrients in priority areas
• at least a 60% reduction in end-of-catchment pesticide loads in priority areas. The pesticides referred to are the photosystem II inhibiting herbicides hexazinone, ametryn, atrazine, diuron and tebuthiuron.
The annual Reef Report Card reports progress against the plan targets, with the most recent being Report Card 2016 for the 2014-2015 year (Australian and Queensland governments, 2016). Most of the indicators are reported annually, except for the wetland and riparian extent indicators which are reported every four years (most recently in 2014).
Progress against targets
Best management practices are defined in Water Quality Risk Frameworks for each major
Overall progress towards land management targets from 2009 and 2015 is summarised below: • Graziers manage 31.1 million ha of land and over 100,000 km of streambank in the Great
Barrier Reef catchments. Best management practices including improved pasture
streambank and/or gully management had been adopted over 32% of this area as at June 2015. Approximately 28% of grazing land is managed using best management practice systems for reducing erosion risk from pastures (8.8 million ha), 54% for practices relating to streambank erosion (60,000 km of streambanks) and 25% for practices relating to gully erosion (7.6 million ha). However, against the Great Barrier Reef target of 90% adoption of best management practices this scored ‘D’ (poor on a scale from ‘E’ very poor to ‘A’ very good).
• Sugarcane growers operate 3777 enterprises on 400,000 ha in the Great Barrier Reef. Between 2008 and 2015, 32% of this area implemented best management practices for sediment, nutrients and/or pesticides. Approximately 32% of cane land has adopted best management practices for pesticides (139,000 ha), 16% for nutrient management
(69,000 ha) and 23% for soil (101,000 ha). With a target of 90% best management practices uptake, this scored ‘D’ (poor).
• Higher rates of adoption were achieved in horticulture (47% of the area, scored as ‘C’) and grains (57% of the area, scored as ‘C’), although there is less comprehensive data for these industries.
While the rates of adoption appear to have slowed in recent years, this is partly a consequence of a change to more focused targets. As the understanding of water quality risk has improved, more robust measurement frameworks have been adopted (Australian and Queensland governments, 2013a; Australian and Queensland governments, 2013b).
In terms of catchment condition targets, the late dry season ground cover in 2013-2014 was
reported as ‘A’ or very good (73%) (Australian and Queensland governments, 2015). In 2014-2015 it was also ‘A’ or very good (77%) (Australian and Queensland governments, 2016) although there were significant areas of low ground cover in the Burdekin and Fitzroy regions that were drought declared in both years. This indicator appears to be on track to meet the Reef Water Quality Protection Plan target, although it may decline if low rainfall conditions continue to prevail.
Wetland loss and riparian extent are reported as part of the Paddock to Reef Integrated Monitoring, Modelling and Reporting Program every four years. In Report Card 2014 (Australian and Queensland governments, 2015), all regions reported very good or good progress, and across the whole Great Barrier Reef catchment it was estimated that there was <0.1% net loss in the extent of natural wetlands between 2009 and 2013. The results for riparian extent were more variable across regions (from good to poor), with losses up to 0.7% (poor) in the Fitzroy and Burnett Mary regions. The overall score for the Great Barrier Reef catchment was moderate (0.4% loss).
Modelled estimates of end-of-catchment pollutant loads are used to assess the water quality benefits of the adoption of best management practices (Waters et al., 2014). In practice, there is a lag between the adoption of new practices and the achievement of water quality benefits. Modelled estimates of the load reductions achieved by the adoption of best management practices facilitated through Great Barrier Reef programs between 2008 and 2016 (Figure i) include:
• an 18% reduction in dissolved inorganic nitrogen against a target of 50% by 2018, score ‘E’ very poor
• a 12% reduction in suspended sediment against a target of 20%, score ‘C’ moderate • a 34% reduction in pesticides against a target of 60%, score ‘C’ moderate.
As illustrated in Chapter 1 (Schaffelke et al., 2017), the overall condition of the inshore marine environment (water quality, seagrass and coral) remains poor and has not changed greatly since Report Card 2011. Marine water quality generally remained in ‘D’ condition in 2015, but some areas have improved to ‘C’ due to lower rainfall and river discharges.
Figure i. Progress towards Reef Water Quality Protection Plan targets (Australian and Queensland governments, 2016).
Expected outcomes of meeting water quality targets
The management of terrestrial pollutant discharge to the Great Barrier Reef implicitly assumes that the impacts of increased loads of nutrients, sediments and pesticides would be reversed if the loads were reduced. Successful restoration has been observed, for example, nutrient management for seagrass in Tampa, Florida. However, there are well-documented cases of eutrophied (nutrient-enriched) marine systems, dominated by algae, where reductions in nutrient loading have not returned the systems to their original ecological status. This may be attributed to the influence of other factors or the relaxation of controls and management efforts. The issues of reversibility, time lags and phase change in coral reef systems are currently the subject of research.
In the Great Barrier Reef, water quality targets are being set on the basis of offshore coral and seagrass ecological requirements. It is assumed that reductions in pollutant loading to the Great Barrier Reef, to the extent of the new targets, will also achieve a restoration of coral (cover, diversity and community structure) and seagrass (cover, biomass, spatial extent, community structure) to a significant degree. This restoration will then also benefit ‘downstream’ species that are dependent on good coral or seagrass status, for example dugongs. A complicating factor is, of course, that other stressors besides pollution are also impacting corals and seagrass of the Great Barrier Reef. The most prominent and important of these other stressors is climate change. As climate change impacts accelerate (e.g. coral bleaching), even highly effective pollution management is unlikely to restore coral and seagrass to restoration objectives.
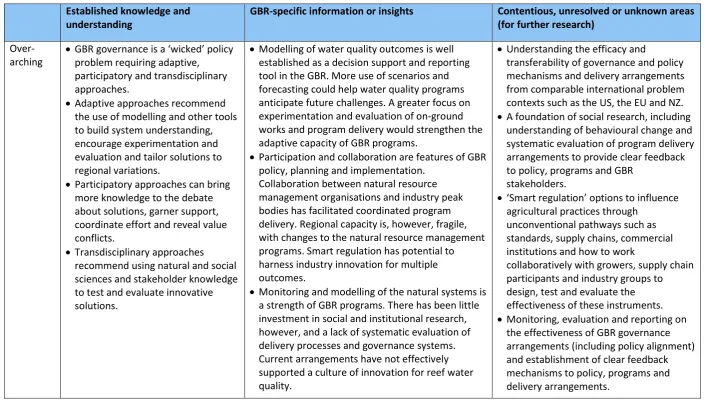
Great Barrier Reef governance
Great Barrier Reef governance is a ‘wicked’ policy problem requiring adaptive, participatory and transdisciplinary approaches.
• Participatory approaches can bring more knowledge to the debate about solutions, garner support, coordinate effort and reveal value conflicts.
• Transdisciplinary approaches recommend using natural and social sciences and stakeholder knowledge to test and evaluate innovative solutions together.
Research insights about the governance of Great Barrier Reef water quality include:
• Climate change, major development projects and poorly aligned and coordinated policies represent critical risks to Great Barrier Reef health.
• Intergovernmental coordination affects all aspects of program design and delivery. Policy alignment (across governments and across related policy areas within government) provides unambiguous policy signals to stakeholders and enables greater impact.
• Researchers have called for the new Reef 2050 Long-Term Sustainability Plan, as the overarching intergovernmental document, to have a stronger mandate, clearer strategies and greater financial commitment.
• Modelling of water quality outcomes is well established as a decision support and reporting tool in the Great Barrier Reef. More use of scenarios and forecasting could help water quality programs anticipate future challenges.
• A greater focus on experimentation and evaluation of on-ground works and program delivery would strengthen the adaptive capacity of Great Barrier Reef programs. • Participation and collaboration are features of Great Barrier Reef policy, planning and
implementation. Collaboration between natural resource management organisations and industry peak bodies has facilitated coordinated program delivery. Regional capacity is, however, fragile, with changes to national and state natural resource management programs, capacity and funding commitments.
• Smart regulation (using multiple pathways to influence behaviours, such as industry
standards, supply chains and financial systems) has potential to harness industry innovation for multiple outcomes.
• There has been little investment in social and institutional research and a lack of systematic evaluation of delivery processes and governance systems.
Implications for management include:
• Many policy areas influence water quality in the Great Barrier Reef, and perverse impacts may negate the benefits of water quality programs. Significant risks in other policy areas should be addressed by:
o advocating for greenhouse gas emissions reductions and developing a strategic approach to climate adaptation in the Great Barrier Reef catchments
o strengthening cumulative impact assessment of projects with risks to the Great Barrier Reef
o influencing related policy areas such agricultural intensification and coastal development that may increase risks to the Great Barrier Reef.
• Mechanisms to strengthen and maintain intergovernmental coordination is critical for effective reef programs. The new Reef 2050 Long-Term Sustainability Plan, as the
overarching intergovernmental document, needs a stronger mandate, clearer strategies and greater financial commitment.
• Sustain and encourage productive collaborations at local, regional and policy levels to access a wider knowledge base, share resources and risk, enable innovation and tailor programs to local contexts. Collaborative processes at different scales need to be effectively linked to share learnings and align effort.
engagement, etc.). Support collaboration efforts with longer term funding tied to locally identified and measured program outcomes.
• Encourage experimentation and innovation by scientists working with local stakeholders to develop, test and evaluate potential solutions.
• Develop stronger alignment between reef programs, wetlands management and other regional planning and management activities such as land-use planning, development assessment and floodplain management.
• Monitor, evaluate and report on the health of the wider governance system, delivery processes and program effectiveness. Incorporate learnings from social research and international case studies into formal Great Barrier Reef policy review cycles.
Key knowledge gaps include:
• understanding of the efficacy and transferability of governance and policy mechanisms and delivery arrangements from comparable international problem contexts such as the United States, the European Union and New Zealand
• a foundation of social research, including understanding of behavioural change and
systematic evaluation of program delivery arrangements to provide clear feedback to policy, programs and Great Barrier Reef stakeholders
• ‘smart regulation’ (using multiple pathways to influence behaviours, such as industry standards, supply chains and financial systems) options to influence agricultural practices through unconventional pathways and how to work collaboratively with growers, supply chain participants and industry groups to design, test and evaluate the effectiveness of these instruments
• monitoring, evaluation and reporting of the effectiveness of Great Barrier Reef governance arrangements (including policy alignment) and how to establish clear feedback mechanisms to policy and programs.
The effectiveness of agricultural practices in improving water quality
New research has confirmed existing knowledge about the efficacy of many agricultural
management practices in reducing water quality impacts, improving confidence in the Water Quality Risk Frameworks used to monitor and evaluate progress against targets. New knowledge that has emerged since the last Scientific Consensus Statement (2013) includes:
• Sediment from gullies and streambank erosion is now recognised as more significant than previously thought and requires greater focus.
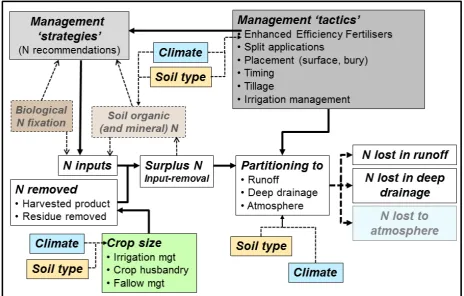
• Enhanced efficiency fertilisers can increase nitrogen use efficiency in sugarcane, although further work is required to establish the extent to which their use reduces nitrogen losses. • Better climate forecasting may help to reduce nitrogen losses.
• Tailoring nitrogen recommendations to site-specific conditions is desirable but requires decision support systems that model the behaviour of fertilisers, including enhanced efficiency fertilisers, under variable soil, climate and management factors.
To reduce sediment loss in grazing lands: • established practices include:
— maintaining ground cover and forage biomass at the end of the dry season — setting appropriate stocking rates
— excluding stock from riparian and frontage country and from rilled, scalded and gullied areas
— targeting hotspots of sediment loss. • insights from new research include:
— increased confidence that reducing stocking rates will improve ground cover and water quality from hillslopes
— increased confidence that cover provided by invasive grass species is less effective in helping productivity and soil infiltration capacity than perennials
— the importance of sediments from gully and streambank sources is clearer, and
sediments from these sources can contain high concentrations of bioavailable nutrients — increased confidence that maintaining land condition on hillslopes above gullies helps
reduce gully erosion
— effective remediation of gullies requires substantial actions such as excluding stock, and engineering (e.g. check dams) or bioengineering (slope battering, seed, mulch, gypsum and fertiliser) approaches
— the effectiveness of managing streambank erosion for water quality has still not been demonstrated in Great Barrier Reef catchments.
To reduce sediment loss in agricultural cropping lands, research supports existing practices including:
• reducing or eliminating tillage and maximising soil cover (via crop residue retention and grassed inter-rows)
• adopting controlled traffic, opportunity cropping and contour embankments • increasing irrigation application efficiency to minimise run-off, deep drainage and
denitrification from the farm.
To reduce nutrient exports from agricultural lands, established practices include: • reducing erosion to reduce particulate nutrient losses
• minimising the nutrient surpluses, that is, the difference between inputs and crop off-take, especially for nitrogen
• practices such as splitting applications, changing the timing of fertiliser applications to avoid irrigation or the chance of rainfall, and burying fertiliser
• targeting hotspots where nutrient surpluses are high (and hence nutrient use efficiency is low).
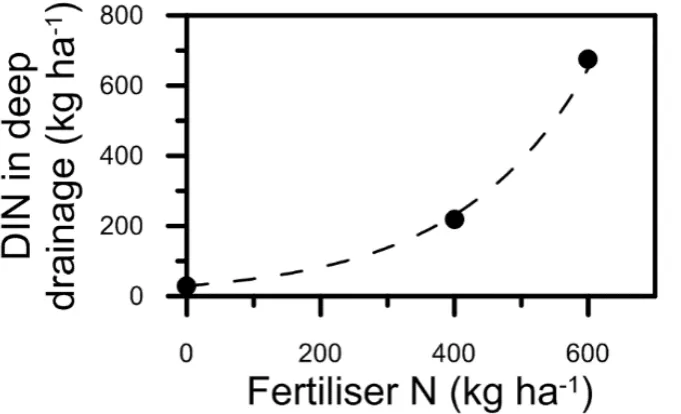
New insights to reducing nutrient exports from agricultural lands include:
• increased confidence that lower nutrient (nitrogen) application rates (to industry best management practices rates) reduce nutrient losses from fields without reducing yield • enhanced efficiency fertilisers can increase nitrogen use efficiency in sugarcane, which
should reduce nitrogen losses if nitrogen application rates are reduced. However, there are only early indications that these fertilisers reduce nitrogen losses. Enhanced efficiency fertilisers need to be targeted according to season, soil and fertiliser technology types • early indications that seasonal climate forecasting can help with optimising nitrogen
fertiliser applications to sugarcane
• a current focus on aligning production goals to block or productivity zone yield potential in the Six Easy Steps framework for sugarcane fertiliser management. However, the sugarcane nitrogen requirement in the framework is also spatially and temporally variable.
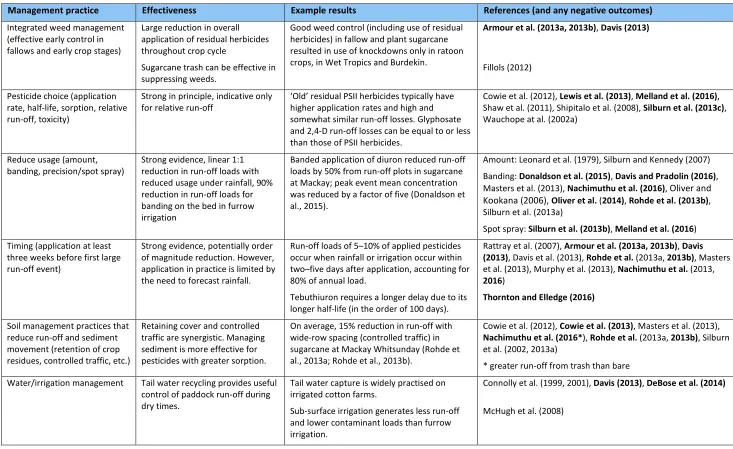
To reduce pesticides exports, established agricultural practices include:
• reducing the amount applied, for example banded spraying and adopting integrated pest and/or weed management
• minimising run-off and sediment loss from the farm
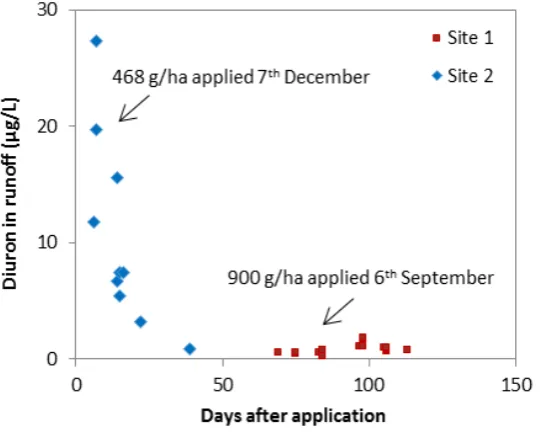
• maximising the time between application and likely run-off events
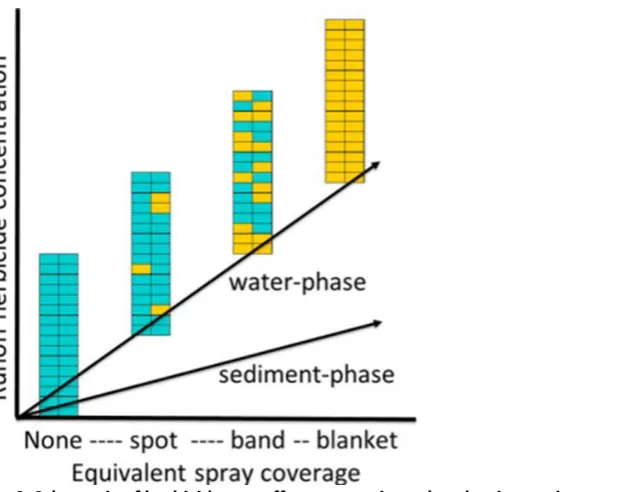
• choosing products with rapid degradation rates (e.g. some ‘knockdown’ herbicides). New insights to reducing pesticide loss from agricultural lands include:
• increased confidence that reducing pesticide applications (e.g. through banded spraying) reduces pesticide losses from fields
• increased confidence that avoiding run-off for three weeks after application substantially reduces pesticide losses
• practices for managing losses also apply to the newly released chemicals
• transport of most pesticides in current use is more dominant in the dissolved phase than previously thought, placing greater emphasis on the management of run-off. More pesticides are lost in deep drainage that previously thought, although the amount is very small
• integrated weed management in sugarcane has demonstrated the successful use of shorter lived herbicides and/or lower application rates
• frameworks to help choose pesticide products (balancing toxicity and run-off potential to reduce risk) are starting to be developed.
Established irrigation practices that reduce water quality risks include:
• increasing irrigation efficiency (i.e. reducing over-application of irrigation), which reduces nutrient and pesticide losses
• delaying irrigation after nitrogen or pesticide applications, which reduces losses.
New insights into the effectiveness of irrigation practices in reducing water quality risks include: • clearer indications (through modelling) that highly efficient irrigation systems reduce
nutrient losses
• increased confidence that avoiding irrigation after nitrogen or pesticide applications substantially reduces losses.
Key knowledge gaps include:
• the effectiveness, costs and suitability of management techniques to address erosion features in gullies and riparian areas, including physical works and grazing management, in priority areas of Great Barrier Reef grazing lands
• the processes, time frames and water quality effectiveness of recovery in land condition following improved grazing practices in areas of high erosion rates, in low vegetation cover and biomass, and in fine-textured and sodic soils
• development and application of decision support tools that use a combination of forage budgeting, forage condition assessment and climate forecasts to set stocking rates across the grazing industry
• assessment of the soil loss benefits of different pasture species and systems, including improved pastured and reduced stocking rates on native pastures
— the water quality benefits of adopting enhanced efficiency fertilisers and the best management of these fertilisers under different soil and climatic conditions — the potential for novel interventions (e.g. incorporating climate forecasting into
nutrient management decisions) to help farmers reduce nitrogen applications — improving site-specific recommendations for nitrogen application in sugarcane,
nitrogen supply from organic sources and optimising the management of enhanced efficiency fertilisers using the Agricultural Production Systems sIMulator model (APSIM). • decision support systems to tailor site-specific fertiliser recommendations, including for
enhanced efficiency fertilisers
• verification of the potential for improved irrigation management and water use efficiency to reduce nutrient losses, including deep drainage as well as run-off, and the efficacy of tail water dams/recycle pits for pollutant trapping in irrigated areas in the Lower Burdekin • the efficacy of various practices for managing nitrogen losses through deep drainage (e.g.
irrigation scheduling, timing of fertiliser applications) need to be better defined and tested • the contribution of organic sources of nutrients (e.g. nitrogen from legumes, nitrogen and
phosphorus from mill mud) to nutrient losses (both dissolved and particulate). If the contribution is significant, methods to manage those losses (e.g. better managing supplementary fertiliser in these situations) need to be developed
• the magnitude and, possibly, management of nutrient losses from grains production areas • understanding of nutrient losses from, or nutrient management in, fertilised grazing lands • the relationship between phosphorus surpluses, soil phosphorus concentrations and
phosphorus lost to the environment in both particulate and dissolved forms
• the relative and additive toxicity of new herbicide products (knockdowns and residuals) • understanding of the run-off potential and half-lives of more pesticide products to enable a
more comprehensive risk assessment framework and guidance on product choice. The social and economic dimensions of agricultural practice change
Social dimensions
Established knowledge about the social dimensions of changing agricultural practices includes: • The adoption of a new practice is dependent upon landholders’ expectations that the
practice will allow them to better achieve their own goals. This decision is based on subjective perceptions and is sensitive to timing, local conditions and the personal, family and business circumstances of individual farmers or industry sectors.
• The perceived benefits of adopting a new practice may be focused on profitability, but may also include social recognition, ease of management, meeting family goals or a reduction in regulatory risk. Landholders with strong profitability goals engage more with productivity best management practices, while those with environmental or stewardship goals engage with vegetation or riparian best management practices. Best management practice
programs may unintentionally exclude some landholders because of the scope of implied or expressed benefits of the program.
• Different groups of landholders can be identified based on their adoption behaviours, goals, attitudes, norms and socio-economic characteristics. These groups trust different
information sources and are more likely to work with some organisations or entities over others. Understanding the character or diversity of these attributes within the landholder target group improves participation and uptake.
Research insights specific to the social dimensions of agricultural practice change in the Great Barrier Reef include:
• Conflicting messages about reef health, blaming farmers and overemphasising science to the exclusion of local or industry knowledge contributes to low acceptance of environmental responsibility.
• Social barriers to participating in Great Barrier Reef best management practices programs include perceptions of working with government; scheme complexity; lack of social recognition; and practice changes that disrupt relationships with peers, harvesting cooperatives, contractors and suppliers. Designing delivery programs that recognise and leverage these social and cultural preferences improves participation.
• Where local industry, farmers, scientists and natural resource management managers work collaboratively to design and evaluate new interventions (e.g. local technical assessment panels or monitoring outcomes of actions at paddock or sub-catchment scales), these processes of joint learning build trust in decisions and in the data, which underpins support for future action.
• Participation in Great Barrier Reef financial incentive programs will be improved by flexibility to tailor contracts and delivery to producers’ circumstances and by working through local, trusted intermediaries (e.g. extension officers).
The general implications of these findings include:
• Regional bodies, governments and industry groups need to be explicit and specific about the target audience for program delivery or intervention and in doing so recognise the goals and circumstances of those landholders, which will vary between and within sectors and regions, and, based on these assessments, they need to set realistic targets for engagement and uptake and select appropriate engagement models.
• Governments and regional bodies continue to work inclusively and collaboratively with landholders and their organisations in the design and delivery of practice improvement programs and look to expand partners to include new actors (public and private) who are a source of information that influence farmer decisions about management practices. • All parties engaged in program delivery work to maintain a conducive or enabling adoption
environment that supports knowledge exchange between farmers, scientists and others (rather than knowledge transfer); that addresses perceptions of risk associated with the practice itself and participation; provides trusted and diverse advisory services; and delivers adequate financial, cultural or social rewards for land managers.
The recent interest in the use of social marketing, community-based social marketing and improving communication practices as an adjunct to good engagement practices needs to be evaluated. Decision support tools for farmers and extension officers can provide sophisticated support and real-time feedback on crop production and environmental outcomes, but barriers to uptake (including privacy and data-sharing issues) need to be overcome for these benefits to be fully realised. Key knowledge gaps include:
• understanding how extension, information and advice provision impacting on practice decisions is collectively governed and coordinated in the Great Barrier Reef catchments, including public, private and non-government organisation sources
• understanding how practice improvement for water quality benefits can be encouraged through the broader social and economic networks that influence management (suppliers, contractors, buyers, family members and peers)
farmer decision-making, monitoring and improvement at different scales (farm to program) and the social and institutional requirements for data sharing
• understanding the efficacy of current behaviour change programs that seek to influence grower behaviour at farm and whole-of-industry level.
Economic dimensions
There is now a large body of work that estimates the benefits, costs, adoption drivers and mechanism design relevant to the Great Barrier Reef. Overall, recent economic analysis using a combination of modelling and evaluation data shows that:
• There are large variations in the costs to improve water quality across regions, programs and industries.
• The total costs of meeting water quality targets are very high (much higher than previously considered). As water quality targets are approached, the costs of additional actions rise sharply.
• Analysis of reef funding programs shows marked variations in cost effectiveness of both management changes and programs.
• Prioritisation can improve the efficiency and effectiveness of practice-change investments. • Different mixes of policy mechanisms may be required.
In terms of the costs to farmers of changing management practices for water quality benefits: • While some farm management changes can be at low (or negative cost), most involve capital
investment and/or trade-offs in production and long time frames until benefits are received. • The cost of management changes and the benefits to the landholder and Great Barrier Reef
water quality vary widely, resulting in large differences in the cost effectiveness of actions. • Risk preferences, transaction costs and other barriers such as complexity are also key drivers
for landholder adoption behaviour.
Economic analysis can contribute to more efficient prioritisation of investment and mechanism design:
• A simple focus on individual sources of pollutants, actions or regions is unlikely to be efficient as the cost effectiveness of management practice change varies across industries, regions and farms.
• Prioritisation should consider:
— environmental (Great Barrier Reef coastal and marine ecosystem health), social and economic benefits
— risks of practice change to landholders and industries — impacts of weather and markets
— performance of past and current investments, delivery models and delivery partners — time lags to implementation, end-of-catchment pollutant reductions and benefits to
Great Barrier Reef health.
• There needs to be some method of assessing the relative benefits and risks of focusing on protecting reef assets in good health versus repairing degraded areas.
Key knowledge gaps include:
• improving approaches to estimate overall costs, including modelling constraints and underlying assumptions
• understanding farmer motivation to change and incorporation of costs and risks associated with weather and markets
• development of prioritisation approaches to take account of the benefits that can be gained and cost effectiveness
• more cost-effective solutions for catchments where targets cannot be reached or can only be reached at very high costs
• determining the optimal suite of incentives, regulation and market mechanisms to effect change.
The effectiveness of other land management practices in improving water quality
For the first time, this Scientific Consensus Statement has included non-agricultural land uses. The science of agricultural land management for Great Barrier Reef water quality has developed over the last 15 years of intensive research effort. Our knowledge about the effectiveness of management practices for water quality improvement across other land uses is much less than in grazing and agriculture. Where there is limited information available from the Great Barrier Reef region, care must be taken in interpreting research from other areas (particularly outside the tropics and subtropics).
Urban
Established water quality management practices in urban areas include stormwater quality management such as vegetated treatment systems, integrated water cycle management, and wastewater management approaches. The integration of water cycle management approaches is critical to improving water quality.
Water quality monitoring in Mackay and Townsville indicates high variability of stormwater quality. Some information and guidance is available for the Great Barrier Reef through local governments. Water Quality Improvement Plans have highlighted the opportunities for specific management actions. There are capacity-building programs for stormwater quality management currently underway in the Great Barrier Reef.
Key knowledge gaps include:
• Great Barrier Reef–specific performance measures for urban water quality management practices
• understanding of the applicability of measures from other parts of Australia
• design modification of specific practices, particularly vegetated treatment systems, for the Great Barrier Reef
• further development of integrated approaches to water cycle management
• understanding of the capacity of agencies and utilities to adopt improved management practices for urban areas of the Great Barrier Reef.
Implications for management:
• While run-off from urban areas is a relatively minor contribution to catchment loads in the Great Barrier Reef, urban run-off contributes high loads per area and can be locally
significant, especially in developing urban areas. Proximity to the inner lagoon means that impacts may be substantial.
• Reducing the impervious surface area of new greenfield developments has potential to improve water quality through hydrological management for the benefit of waterways within and downstream of urban areas.
Ports
Ports impact water quality through a range of direct and indirect impacts, including run-off and discharge from port facilities and portside activities, shipping movements, construction, capital and maintenance dredging and land reclamation. Water quality monitoring in Queensland ports is variable, and public reporting of results is currently limited.
Key knowledge gaps include:
• understanding of the impacts of ports, particularly in estuaries • managing the impacts of land-based disposal of dredge material
• improved water quality monitoring, assessment and reporting in Great Barrier Reef ports.
Wetlands and treatment systems
Natural and modified estuarine and freshwater wetlands have many values, including protection from wave action and storms and reducing the impacts of floods, as well as providing important habitat. Wetlands can absorb and transform pollutants and nutrients in catchment run-off, but the capacity of wetlands to improve water quality for the reef is limited by the size and type of wetland (open water, vegetated, etc.), residence time, wetland location and condition, rainfall and
hydrological connectivity. The capacity of wetlands to improve water quality is highest when hydrologic loads are low to intermediate, such as during early and late wet season, in smaller sub-catchments, or in the dry season, as well as in irrigated areas where flows are supplemented. While wetlands can filter catchment run-off, when poor quality enters wetlands, it can affect the provision of values and services from the wetlands and have consequences for wider reef health. The consideration of natural wetlands and treatment systems in relation to water quality
improvement needs to be framed within the context of the broader landscape and be part of an overall integrated pollutant management process.
Natural and constructed wetlands can remove nitrogen and phosphorus from the water through denitrification, sediment accumulation and plant growth:
• In the Great Barrier Reef, the capacity of wetlands to mitigate nutrient export from the basin is likely to be variable across catchments and wetland types.
• Highly variable flows, especially during extreme drought or flood events, will strongly influence the ability of wetlands to mitigate nutrient exports. Nutrient uptake may be higher at the beginning and end of the wet season.
• Nutrients are removed primarily through denitrification, storage in soils and vegetation. However, input of excess nutrients can damage wetlands functions and threaten their values.
Natural and constructed wetlands can facilitate sedimentation by trapping sediment and the carbon and nutrients associated with it:
• Intertidal wetlands in the Great Barrier Reef, especially mangroves, can trap sediment from the water that floods them.
• Excess sediment can be detrimental to wetlands and, in some cases, can destroy them. • At the landscape level, wetlands can make a substantial contribution to reducing sediment
loads to the marine environment in many regions.
Pesticides are being transported as run-off to wetlands of the Great Barrier Reef:
• Natural and constructed wetlands can trap pesticides and accelerate their decomposition. • In some areas of the Great Barrier Reef, wetlands are accumulating high levels of pesticides.
This can damage wetland functions and threaten their values. Implications for Great Barrier Reef management include:
• Wetland conservation and restoration can complement on-farm practices to reduce nutrient, sediment and pesticide run-off to the Great Barrier Reef.
• Wetlands in the Great Barrier Reef catchment occupy a relatively small area; however, they contribute to the biodiversity, carbon, nutrient and sediment storage of the region.
• While wetlands have the capacity to contribute to water quality improvement in the Great Barrier Reef, it is important to understand that these pollutants can also have significant negative impacts on wetlands, which are part of the broader reef ecosystem.
• Engineered treatment systems can be effective in reducing the concentration of pollutants such as sediment, nutrients and pesticides. Treatment systems include technologies such as constructed wetlands, denitrifying bioreactors, floating wetlands, high-efficiency
sedimentation basins and algae nutrient removal. Key knowledge gaps include:
• the capacity of different types of wetlands to improve water quality, including in relation to seasonal variations, floods and droughts
• the response and tolerance of different wetland types to sediment, nutrient and pesticide pollution and thresholds that could degrade the wetland
• the contribution wetlands make to water quality of the Great Barrier Reef at the landscape level and their effectiveness in different locations and under different hydrological regimes • evaluating the effectiveness, efficiency and costs of using different types of treatment
systems to address sediment, nutrients and pesticides in different locations in the Great Barrier Reef
• the decomposition rates of pesticides in wetlands • the effects of pesticides on flora and fauna of wetlands.
Land-use change
Urban expansion is also expected along the Great Barrier Reef coast, with population growth and inward migration to the region. Expanding urban areas will increase the urban water quality footprint in the Great Barrier Reef.
Expected land-use change and its associated water quality impacts should be incorporated into water quality planning, management strategies and catchment modelling of water quality outcomes. Impacts can be minimised by adoption of best practice systems from the outset. Options for land-use change or land retirement to achieve water quality benefits have not been fully explored and should be reviewed, considering costs, benefits, other trade-offs and policy instruments.
Other pollutants
As well as sediment, nutrients and pesticides, a range of other pollutants are of growing significance in the Great Barrier Reef and elsewhere. These are derived from a range of sources including
agriculture, urban, industrial, transport and waste facilities, which complicates management efforts. The Great Barrier Reef has widespread contamination with marine debris from shipping, fishing and industrial and urban sources. Current proposals to ban single-use plastic bags and for container deposit schemes are promising first steps to reduce marine debris, but more significant change is required.
Monitoring of water sensitive urban design structures in the Great Barrier Reef has shown that effluent discharges include a wide range of pollutants such as pharmaceuticals and personal care products (as well as nutrients). Comprehensive information about Great Barrier Reef sewage treatment plants and their discharges is not readily available.
Key knowledge gaps for other contaminants in the Great Barrier Reef include:
• monitoring of marine debris and evaluating the effectiveness of the schemes to reduce marine debris
• understanding of current and potential future risk of pollutants in sewage treatment plant effluent discharges, with the projected increase in population and urban growth along the Great Barrier Reef coast, by:
— developing an inventory of sewage treatment plants and their treatment levels in the Great Barrier Reef catchment
— quantifying the volume they discharge
Introduction
Synthesis process
Unlike the other chapters in the Scientific Consensus Statement, this chapter presents discrete sections that were led by the lead authors identified in the acknowledgements section. Each section was drafted by a writing team and then revised following a series of review processes:
1. review by co-authors
2. review by relevant scientific peers
3. policy review by the Office of the Great Barrier Reef (Queensland Department of Environment and Heritage Protection)
4. chapter reviews by the Independent Science Panel for the Reef Water Quality Protection Plan
5. formal review by independent scientists of international standing.
In addition, early findings were presented and discussed at the Great Barrier Reef Synthesis
Workshop: Science, Policy and Management held in Townsville 9–11 November 2016. Some sections were also reviewed by other Great Barrier Reef groups and networks, for example the Great Barrier Reef Wetlands Network.
Scope and limitations
This chapter has a wider scope than previous Scientific Consensus Statements. For the first time, the Scientific Consensus Statement has included social and governance dimensions of management and consideration of non-agricultural land uses, including urban and industrial and ports, as well as wetlands and treatment systems and consideration of land-use change. The new sections provide an initial synthesis of relevant information but are generally constrained by a lack of Great Barrier Reef– specific data and information, and the relevance of information from other locations must be
carefully considered. In comparison, the agricultural practice change and economics sections provide an update on material compiled as part of the 2013 Scientific Consensus Statement.
Note that the social, economic and governance dimensions outlined in this chapter relate primarily to agricultural practice change, where the focus of policy effort has been for the last 10 years. It is also worth noting that this report has been confined to peer reviewed literature, which is generally published in books and journals or major reports. This literature usually lags behind current practice and research by at least a year, usually several. There is substantial additional evidence that exists in grey literature, that is, project and program reports that do not meet the criteria for inclusion here.
The questions this chapter seeks to answer
This chapter seeks to answer the following questions:1. What are the values of the Great Barrier Reef?
2. How effective are better agricultural practices in improving water quality? 3. How can we improve the uptake of better agricultural practices?
4. What water quality improvement can other land uses contribute? 5. How can Great Barrier Reef programs be improved?
Chapter structure
In keeping with the risk management framework presented in the Introduction (Chapter 1,
Schaffelke et al., 2017) this chapter addresses the ways that water quality risks to the Great Barrier Reef can be managed. General principles for tackling wicked problems—including adaptive,
participatory and transdisciplinary approaches—are introduced in section 2. Section 3 describes the values at risk in the Great Barrier Reef, including environmental, economic, community and
Indigenous values. Progress against water quality and practice change targets is documented in section 4. Research that relates to the effectiveness of Great Barrier Reef governance is reported in section 5, including water quality planning, programs and partnerships. Significant issues that are not addressed under current water quality policy initiatives are highlighted in section 5.2.
Section 6 discusses the effectiveness of agricultural practice change in achieving reduced sediment, nutrient and pesticide run-off. The economic and social dimensions of facilitating the adoption of agricultural practices for water quality benefits are discussed in sections 6.2 and 6.3 respectively. This section also includes an example of applying a more integrated approach to prioritising investments in practice change
Section 7 discusses the effectiveness of actions to reduce water quality impacts from other land uses, including urban (section 7.1) and ports (section 7.2). The potential for wetlands and treatment systems to contribute to improving Great Barrier Reef water quality are reported in section 7.3 and the potential for land-use change in section 7.4. Finally, a short section describes actions to reduce the impact of other contaminants not covered in the prior sections (section 7.5).
Wicked problems—tackling complexity in the Great Barrier Reef
Why the Great Barrier Reef is a wicked problem
Policy research has used the concept of ‘wicked problems’ to describe complex and policy issues that are resistant to solution because of their inherent complexity and conflicting stakeholder values (Churchman, 1967; Rittel and Webber, 1973). Wicked problems have many interdependencies that arise from their complexity and resulting uncertainty, so interventions may lead to unforeseen consequences. Social and institutional complexity are key elements of wicked problems, which are often characterised by chronic policy failure (Australian Public Service, 2007).
Characteristics of the Great Barrier Reef that indicate its status as a ‘wicked’ problem include the following:
1. The Great Barrier Reef is a very complex system operating at multiple scales, including individual enterprises, agricultural industries, regional communities, diverse catchments and marine assets in a changing climate.
2. Stakeholders view the Great Barrier Reef water quality issue in different ways: as an
environmental catastrophe, an economic risk, a property rights or local development issue. 3. The science is contested, particularly in relation to the source of water quality issues (for
example, see Lankester et al., 2009).
4. The water quality issue involves many discrete elements, but is itself only part of a suite of issues affecting the health of the Great Barrier Reef.
6. Water quality was first identified as a critical policy issue in the 1980s. Substantial public investment and three iterations of bilateral planning have failed to achieve demonstrable water quality improvements.
General principles for addressing wicked problems
Adaptive, participatory and transdisciplinary approaches are widely recommended to deal with the uncertainty of wicked problems (Duckett et al., 2016; Head and Alford, 2015; Head and Xiang, 2016). A more prescriptive policy approach is unlikely to be successful because of complex and uncertain science, the likelihood of unintended consequences and the inability to resolve competing values and interests (Everingham J.A. et al., 2016).
Adaptive approaches allow programs to respond to new learnings and changing contexts. Modelling, forecasting and scenario-building are tools that help to build a system understanding that allows programs to develop and test ideas before they are applied more widely. Tailoring solutions to regional variations, experimentation and responding opportunistically to changes are also considered adaptive (Duckett et al., 2016).
Participatory approaches are recommended for wicked problems for two reasons. First, stakeholders bring important local knowledge to contribute to understanding the issue and developing and testing responses tailored to local contexts (Margerum, 2011). Second, participatory processes can reveal, and potentially resolve, value and interest conflicts that contribute to the issue. From a policy perspective, participatory processes are likely to increase stakeholder commitment, align and coordinate multiple management efforts, develop more effective solutions and share resources (Australian Public Service, 2007). Ineffective processes, however, can alienate stakeholders, entrench or polarise positions and result in conflict or stalemates.
Transdisciplinary approaches involve deliberations across different scientific fields (e.g. human and natural sciences) as well as engaging stakeholders who bring other knowledge and perspectives. Innovation solutions are more likely to emerge when participatory and transdisciplinary approaches are employed. Wicked problems require ongoing experimentation, closely coupled with rigorous monitoring and evaluation to understand how the system responds to different interventions. Wicked problems call for a wider engagement of stakeholders, approaches to understand complex systems, a preparedness to trial new approaches but rigorously evaluate their performance, and sustained engagement with an evolving problem set. This requires new forms of leadership that are collaborative and flexible. Institutional structures and arrangements that support these practices require flexible resourcing, collaborative decision-making and more sophisticated approaches to performance evaluation and management (Head and Alford, 2015; Lane and Robinson, 2009; Peterson et al., 2010).
Values at risk
Environmental
The Great Barrier Reef is recognised nationally and internationally for its environmental values. The Great Barrier Reef Marine Park was enacted in 1975 and the area listed as World Heritage in 1981. Under the Environment Protection and Biodiversity Conservation Act 1999 (EPBC Act) the Great Barrier Reef is included as a matter of national environmental significance on the grounds of seven matters:
• world heritage property
• Commonwealth marine areas • listed migratory species
• listed threatened species and ecological communities • wetlands of international importance
(GBRMPA, 2014a).
The Great Barrier Reef World Heritage Area covers 348,000 km2 and includes some 600 continental islands, 300 coral cays and 150 mangrove islands. It is inscribed on the World Heritage List because of its natural Outstanding Universal Value: ‘Outstanding universal value is defined as cultural and/or natural significance which is so exceptional as to transcend national boundaries and to be of
common importance for present and future generations of all humanity’ (UNESCO
Intergovernmental Committee for the Protection of the World Cultural and Natural Heritage, 2012, p.11).
The Great Barrier Reef was listed as having outstanding universal value in relation to four criteria: • representation of the major stages of the Earth’s evolutionary history
• ecological and biological processes • natural beauty and natural phenomena • habitats for the conservation of biodiversity.
These values are considered interconnected and present throughout the extent of the Great Barrier Reef World Heritage Area.
Further details about the environmental values of the Great Barrier Reef can be found in the Great Barrier Reef Outlook Report (GBRMPA, 2014a), the Great Barrier Reef Regional Strategic Assessment (GBRMPA, 2014b; QDSDIP, 2013) and the Final Report of the Great Barrier Reef Water Science Taskforce (GBRWST, 2016). In addition, all six natural resource management regions bordering the Great Barrier Reef have recently updated Water Quality Improvement Plans, each of which includes a detailed description and condition assessment of regional coastal and marine ecosystems (Burnett Mary NRM Group, 2015; Cape York NRM and South Cape York Catchments, 2016; Fitzroy Basin Association, 2015; Folkers et al., 2014; NQ Dry Tropics, 2016; Terrain NRM, 2015). Water Quality Improvement Plans have also identified the environmental values (natural and cultural) and water quality objectives to guide the regulation of activities under the Environmental Protection Act 1994 (once scheduled under the Environmental Protection (Water) Policy 2009). The process is supported by extensive community consultation.
Economics
The Great Barrier Reef supports a large economic base. The most visible are the direct commercial services to the tourism, fishing, recreation and other industries located in the Great Barrier Reef catchment. Deloitte Access Economics (2017) estimated the economic contribution of the reef as $6.4 billion in value added and almost 69,000 full-time equivalent jobs across tourism, recreation, fishing and scientific research and reef management sectors to the Australian economy, including $2.9B and over 24,000 jobs to the economy of the Great Barrier Reef regions. Tourism was the dominant sector, accounting for 89% of the value-added impact and 92% of jobs supported. Parallel to this, agriculture is the dominant land use in the adjacent catchments, generating approximately $3.7 billion per year of production and employing up to 35,000 people (GBRWST, 2016).
Economic analysis requires some assessment of the benefits provided by the Great Barrier Reef or benefits resulting from additional protection measures, so that these can be compared to the costs of additional protection. The gross values of commercial activity are not appropriate for this
more appropriate. Surplus measures can be calculated for each industry and summed to provide benefit values generated by the Great Barrier Reef. Changes in benefit values from poorer or better conditions in reef health can also be estimated. The economic surpluses arising from better
protection (e.g. changes in industry profits) can then be compared to the costs of achieving that protection.
The Great Barrier Reef has additional economic benefits beyond direct commercial activity, such as ecosystem services, but these are difficult to measure because not all values (e.g. wanting your children to visit the reef) are traded in markets and therefore do not have a clear benefit. Several studies have previously used specialist non-market valuation techniques to value recreation (e.g. Kragt et al., 2009; Prayaga et al., 2010; Rolfe and Gregg, 2012; Stoeckl et al., 2011), indirect values (e.g. shore protection) (e.g. Oxford Economics, 2009) and non-use (protection) values for the reef (e.g. Rolfe and Windle, 2012; Stoeckl et al., 2011). The available evidence indicates that the
additional economic values are at least equal if not larger than the value-added commercial benefits (Oxford Economics, 2009).
There have been four important additions to knowledge of the economic value of the Great Barrier Reef since the 2013 Scientific Consensus Statement, in addition to the synthesis of knowledge provided by Thomas and Brodie (2014). The first was the material provided by Deloitte Access Economics (2017), which clarified that the value-added and employment contribution of the Great Barrier Reef was almost twice as large as the agricultural sector in the Great Barrier Reef
catchments. The second has been the Social and Economic Long-Term Monitoring Program (SELTMP, 2017), which has been capturing some of the dimensions of human involvement with the reef. For example, Marshall et al. (2014) show that about 86% of local residents living adjacent to the reef had visited the reef in the previous 12 months; the reef was a drawcard for tourists to visit north Queensland; and that 25% of coastal residents were dependent on the reef for at least some of their household income. The third has been the contribution of Rolfe and Windle (2015), who added to their previous estimates of protection values for the Great Barrier Reef held by Australian,
Queensland and regional populations to show that values were higher for scenarios with greater certainty of protection for the reef. The fourth has been the work by Stoeckl et al. (2014) to assess values in an ecosystem service framework, where they estimated that the collective monetary value of the broad range of services provided by the Great Barrier Reef is likely to be between $15 and $20 billion Australian dollars per year.
The various economic benefits generated by the reef are potential losses if it deteriorates or if services are no longer available. Some estimates are focused on valuing changes in condition. For example, Prayaga et al. (2010) estimated that a 25% reduction in fish catch rates in the southern Great Barrier Reef would lower the value of recreational fishing trips by at least $7.74/trip, and a 25% increase in fish catch rates would increase values by at least $28.00/trip. Rolfe and Gregg (2012) estimated the value of beach visits in the Great Barrier Reef at $35.00/person/visit, with each 1% decline in water quality reducing visit values by $1.30/recreation trip. Rolfe and Windle (2012) estimated that Australian households would be willing to pay $21.68/household/year for five years to protect each additional 1% of the Great Barrier Reef.