This work investigates the electrochemical role of water in the research of deep eutectic solvent (DES) based on urea and choline chloride. The motivation comes from the growing use of this DES, and on reports where a characteristic voltammetric cathodic pre-wave is observed. However, there has been no direct study to verify if such interpretation of the pre-wave is appropriate. In this regard, cyclic voltammetry has been used in this paper to interrogate the reactions inducing the appearance of the pre-wave. These experiments have been carried out using reline (the eutectic mixture of urea and choline chloride) melts containing different amounts of water, compounds which can be incorporated as impurities from air, or as decomposition products of reline. The analyses showed that a pre-wave in voltammograms in reline originates from water electroreduction accompanied with a subsequent choline hydroxide formation. In this sense, reline behaves like a typical mixture of organic solvent+alkali cation salt+water. The voltammetric signal depends on water content in reline. Importantly, this offers a possibility for in-situ electrochemical determination of water content in reline, provided that a calibration curve is constructed.
© The Author(s) 2018. Published by ECS. This is an open access article distributed under the terms of the Creative Commons Attribution Non-Commercial No Derivatives 4.0 License (CC BY-NC-ND,http://creativecommons.org/licenses/by-nc-nd/4.0/), which permits non-commercial reuse, distribution, and reproduction in any medium, provided the original work is not changed in any way and is properly cited. For permission for commercial reuse, please email:[email protected]. [DOI:10.1149/2.0921816jes]
Manuscript submitted September 17, 2018; revised manuscript received December 13, 2018. Published December 20, 2018.
In electrochemical applications, such as metal electrodeposition, it is important to know the processes occurring at the electrode using the background electrolyte, which may be revealed from the shape of linear or cyclic voltammogram.1
This work focuses on the elucidation of the electrochemical pro-cess which induces a certain shape of cyclic voltammograms recorded in a type of deep eutectic solvent (DES), produced by mixing 1 mol choline chloride with 2 moles of urea, commercially referred to as reline. In the last two decades, reline has found application in various fields, like electrochemical deposition, electropolishing and extraction of metals, as well as organic synthesis, purification, gas adsorption, etc.2Due to its importance, there have been many studies on the elec-trochemical behavior of reline.3–5The cyclic voltammograms in these studies show that prior to the cathodic decomposition of blank reline, one or two pre-waves are observed when the electrode is polarized cathodically.
Although several research teams observed the characteristic pre-waves in reline, only few proposed some tentative assumptions regard-ing their existence, acceptregard-ing that they represent an earlier step in the reduction of the electrolyte.6One assumption was that the pre-wave is related to the choline cation two step reduction.7Another proposition was that the pre-wave originates from the reduction of neutral urea molecules which exist in low concentration in reline.5Gomez et al.3 found that the pre-wave increases with the addition of water to the electrolyte, and that both electrolyte decomposition and the position of the voltammetric pre-wave depend on the electrode material. They inferred that this indicated that not only the pre-wave but also the bulk decomposition of reline was related to hydrogen evolution process, i.e. to the reduction of urea or water.3
During the literature search, we observed the typical cathodic pre-wave in melts of urea with salts other than choline chloride, and vice versa, in urea-free deep eutectic solvents which contain choline chlo-ride. For example, the voltammograms of urea mixtures with alkyl-imidazolium chloride8and lithium bis(trifluoromethanesulfone)imide (LiTFSI),9 as well as choline chloride mixtures with lactic acid,10
∗Electrochemical Society Member. zE-mail:[email protected]
triethanolamine, or oxalic acid,11 also contain the typical cathodic peak in the forward scan.
The appearance of the pre-waves in a voltammogram recorded in reline may have important implications on the interpretation of the recorded results. For example, this may lead to misinterpretation about metal ion electroreduction in reline or wrong inferences related to im-purities or additives. In particular, when metals are electrodeposited from deep eutectic solvents, water is often included since a hydrated metal salt is used.3,12Water has been shown to induce an enhance-ment of cathodic pre-waves in reline.3,4 It is therefore, important to understand the processes responsible for the appearance of pre-waves in voltammograms of reline, and in other deep eutectic solvents.
In this work we have obtained voltammograms in reline in order to study the reasons for occurrence of the characteristic pre-waves. A number of cyclic voltammograms were recorded in neat DESs with varying water content. A comprehensive review of reactions and impurities which could result in the formation of pre-waves was also carried out. Platinum has been chosen as the working electrode in this work because it was shown earlier3that Pt can enhance the formation of these pre-waves due to its catalytic activity.
Experimental
A deep eutectic solvent consisting of a 1:2 molar ratio of choline chloride (≥98% purity, Sigma Aldrich) and urea (p. a. purity, Lach-Ner) was prepared by combining the two compounds and heating to 60◦C in a closed beaker. The mixture was stirred using a PTFE-coated magnetic stirrer until a single, colorless liquid phase was obtained. In order to decrease the water content in reline, the starting chemicals were vacuum dried for 2 h. The prepared DESs were then dried in a vacuum chamber at 80◦C for 3 h, at p<10 mbar. A separate set of experiments was carried out where DESs were used without drying either of the starting chemicals or the prepared reline, in order to determine the effect of water in the electrolyte. Water content in reline was measured according to standard ASTM D6304,13using the 917 Karl Fischer Coulometer from Metrohm.
shown that this arrangement is suitable to maintain nearly constant water content in DESs with hygroscopic hydrogen bond donors.14 A three-electrode arrangement was used, consisting of a Pt work-ing electrode, a Pt wire (1 mm diameter and 30 mm long) counter electrode and a saturated calomel electrode (SCE) as reference. The reference electrode was in a compartment with an open Luggin capil-lary placed approximately 3 mm from the working electrode. In urea melt, at 130◦C, a quasi-reference electrode (Pt wire) was used instead of the calomel electrode, and for this electrolyte, potentials are quoted with respect to the Pt wire, while for all others, with respect to SCE. The working electrode was polished with abrasive emery paper of 2000 grit, rinsed with deionized water and acetone, and dried in nitro-gen stream prior to use. A computer controlledμAutolab and Gamry ZRA Reference 600 potentiostat/galvanostat were used to perform cyclic voltammetry experiments. The voltammograms were recorded sweeping from 0 to−1.7 V vs. SCE, at various scan rates.
Analysis of free trimethylamine (TMA) in DES sample was done by headspace gas chromatography - mass spectrometry (GC-MS) us-ing a Varian Saturn 3800/2200 system fitted with a Varian Factor Four VF-5ms column (30 m×0.25 mm×0.25μm) connected to 1079 PTV injector operating in splitless mode. A static headspace sampler was CombiPal CTC Analytics, operating at incubation temperature of 90◦C, injection volume 100μL, and incubation time 10 min. The column temperature program was 40◦C for 5 min, and then ramped a 6.0◦C/min up to 200◦C and held at 200◦C for 8 min. The carrier gas used was helium at the flow rate of 0.8 mL/min. MS operated in the full scan mode acquiring masses from 40 to 300 m/e.
Reline, as well as gas collected from reline, were dissolved in methanesulfonic acid, and determination of ammonium ion, as an expected decomposition product of urea, was performed by ion chro-matography (IC). IC analysis was made on an ion chromatograph model Dionex DX-500 with a PeakNet software. A Dionex IonPac CS12 analytical (4 ×250 mm I.D.) column preceded with CG12 guard (4×50 mm I.D.) column was used in this work to analyze free ammonia in DES. The IC measurements were performed using an eluent (20 mM methanesulfonic acid, MSA) flowing at a rate of 1.0 mL/min.
Results and Discussion
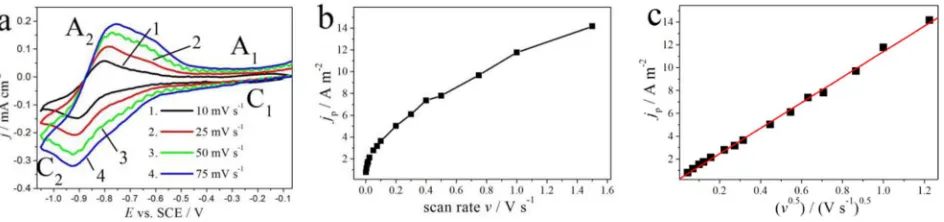
Typical voltammogram of reline.—The research began by repro-ducing typical cyclic voltammograms (CV) (Fig.1) in blank reline on Pt, which have also been reported a number of times in previ-ous papers.3,5,15As the potential (E) becomes more negative from the open circuit potential (Eocp), two pre-waves (C1, C2) appear prior to
the cathodic current due to the bulk breakdown of the electrolyte. It is interesting to note that in earlier work,4 we observed the similar pre-waves in reline on steel. The cathodic processes observed in the onward scan are accompanied by the two anodic waves A1and A2.
The first pair of voltammetric peaks, C1/A1, was investigated in
detail in Ref.3, where it was proposed that it resembles the reductive desorption and oxidative adsorption of Cl−ions on Pt, although the
it will not be further analyzed in the paper. While the cathodic peak C2appears constantly in the same potential range and with the same
shape in a number of various CV recordings, the peak A2 varies
in intensity, it is wide, and sometimes it is composed of two, not completely separated waves. Such an appearance of the peak A2will
be explained later in the text.
A common origin of the appearance of characteristic peaks in voltammograms is the depletion of a reactive species near an electrode during potential scan. The reactive species may be adsorbed to the electrode surface or freely diffusing.16 These common cases may be recognized by a typical dependence of the peak current density (jp) on the scan rate (v). Such dependence in reline is presented in
different manners in Figs.1band1c. For the purely surface controlled process (adsorption/desorption process or the reduction of an adsorbed species), the criterion of linearity forjpvs.vshould be met, while for
the purely diffusion controlled process (the reduction of a species from bulk electrolyte), the linear dependence ofjpvs.v0.5should be
observed.1 The linear relation that is seen in Fig.1c, leads to the first conclusion that the process which induces the peak C2, is purely
controlled by mass transfer. However, the following discussion will show that the origin of the peak appearance is more complicated, and that the simplejpvs.v0.5criteron, does not offer the best explanation
for this case.
Possible impurities inducing peaks C2/A2.—The first possibility
investigated was that the pair of peaks C2/A2is a result of a diffusion
controlled reduction/oxidation process of some species in the bulk ionic liquid, which exists as an impurity. The preliminary tests were performed in order to exclude the possibility of the reduction of the impurities expected to be present in reline, such as oxygen and carbon dioxide from the air. The bubbling of inert gas (N2 or Ar) or O2
does not influence the peak C2, giving evidence that the peak is not
related to the reduction of the dissolved gas. We further examined the possibility of the reduction of bicarbonate anion, because choline cation is a strong base, and it can form choline bicarbonate with the CO2 dissolved from the air.17Yet, the addition of NaHCO3 powder
to reline does not influence the peak C2 either. These tests confirm
that O2 or carbonate/bicarbonate do not induce or interfere with the
pre-wave C2.
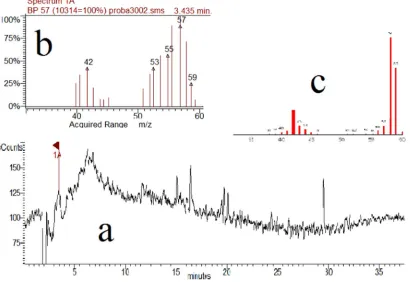
The next series of experiments was devoted to study if the products of the decomposition of reline are responsible. This is because both choline chloride and urea are prone to decomposition, and the decom-position products could be reduced during cathodic polarization of the working electrode. It is known18,19that traces of water catalyze the urea decomposition, yielding ammonia and isocyanic acid. The analysis of reline or gas evaporated from reline samples dissolved in methanesulfonic acid by ion chromatography (Fig.2), confirmed that reline was free of ammonium ion, giving evidence that there were no urea decomposition products in reline.
[image:2.585.59.531.66.177.2]Figure 2. Ion chromatogram of a standard containing ammonium ion (1. black line), reline sample (2. red line), and the sample of gas collected from reline (3. green line).
retention time of 3.4 min, as shown in Fig.3a. The obtained mass spectrum (Fig. 3b) was confirmed with the one from NIST mass library database (Fig.3c).
The presence of trimethylamine in reline shows that the de-composition of choline cation occurs in this DES. However, even though TMA is formed from choline degradation, the voltammograms recorded in reline with the addition of various concentrations (0.05 to 0.5 mol dm−3) of the four possible decomposition products (TMA,
methyl chloride, acetaldehyde, and chloroethanol) did not show any
change in the peak C2. This excludes the possibility that the peak is
related to the reduction of any of the expected decomposition products.
Influence of water.—The analysis in the previous section shows that none of the impurities that could be present in pure reline induces the appearance of the voltammetric peak C2. As a result, the work
focused on the influence of water on the voltammograms in reline. Some earlier reports have discounted the possibility that water elec-troreduction is responsible for the pre-wave to appear. For instance,
[image:3.585.91.501.447.729.2]the results by Du et al., recorded at glassy carbon, indicated that water reduction is unlikely to occur in reline, and the water content must be higher than 3 wt% for any reduction current to be observed in a CV.21 Secondly, references cited throughout this paper, report that the chemi-cals were vacuum dried and the experiments performed in a glove box, but the characteristic peak was still observed in voltammograms.3,5–7,9 On the contrary, it has been observed previously from measurements on platinum that water addition to reline increases the intensity of the peak C2, and it was assumed that the peak is related to water
reduction.3The researchers of this paper, however, did not investigate further, and hence there remains two opposing opinions on the role of water in reline which has not yet been resolved.
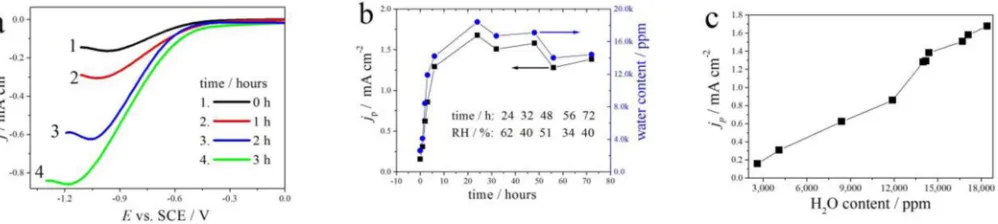
Low water content.—To elucidate the effect of water on the shape of voltammograms recorded in reline, the reline was dried under vac-uum at 100◦C for 24 h, and the water content was measured by Karl Fischer titration. The as-prepared reline still contained 2600 ppm wa-ter, indicating its highly hygroscopic nature. This finding corroborates completely with recently published research21where 2500 ppm water was also measured in vacuum dried reline. It should be mentioned that no further effort was made in our work to lower the water content by using alternative drying techniques, so the value of 2600 ppm was considered as a starting point. After drying, the reline sample was held in the open air at 60◦C and the water content was measured periodi-cally, together with recording linear voltammograms, as presented in Fig.4.
It is clear from the Fig.4that as reline absorbs water over time, the current density of the recorded voltammetric peak and the water content measured by KF titration, change in a correlative manner. Consequently, we may draw the calibration curve for estimation of
water content in reline (Fig.4c). It is interesting to note from the Fig.
4bthat reline absorbs water readily in the first 6 h, then the rate of absorption decreases, and already at 24 h, there is a saturation limit. This is consistent with21where it was shown that at 80◦C, the water content in reline may be held constant at cca. 15000 ppm, and in our work, the saturation maximum is cca. 18000 ppm of water at 60◦C. What is more, when the saturation was reached, the water content in reline obeyed the trend of surrounding air humidity. This may be seen as oscillation in Fig.4bafter 24 h: when air humidity is lower, the water content decreases, and vice versa.
High water content.—The voltammograms were then recorded in reline-water mixtures, prepared by deliberate adding of water to DES, and the example of such voltammograms is depicted in Fig.5a. The characteristic pre-wave may be visually observed in the curves even with water content up to 75 wt%. The peak current densities read from the voltammograms as those in Fig.5a, were plotted vs.CH2O
and shown in Fig.5b. It is clear that this type of curves may be used as calibration curves for fast, in-situ estimation of water content in reline, even in case for very high water presence. Since it is well known that thejpvalues in CVs depend on the sweep rate, the calibration curve
will also be related to the sweep rate, as shown in Fig.5b.
Diffusion coefficient for water in reline.—The previous sec-tions show that the peak current increases linearly with square root of scan rate (Fig. 1c) and with water concentration in reline (Figs.5,6), which leads to the assumption that the peak C2 appears
[image:4.585.46.545.67.179.2]due to the purely diffusion controlled reduction of water molecules in reline. This possibility was tested by calculating the diffusion co-efficient for water in reline, using the method which is correct for the
Figure 5. (a) The CVs recorded in reline with different water content with scan rate 15 mV s−1; (b) the plot ofj
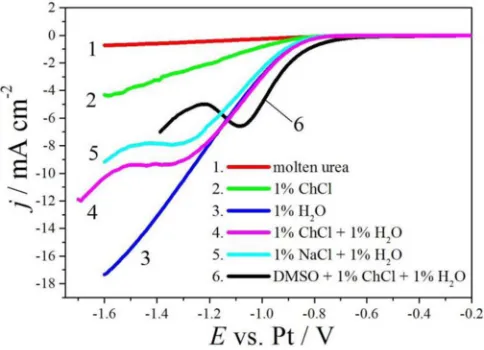
[image:4.585.44.543.556.734.2]Figure 6. Linear sweep curves recorded at scan rate 250 mV s−1, Pt reference
electrode, in molten urea at 130◦C with the addition of 1 wt% water; 1 wt% choline chloride (ChCl); and/or 1 wt% NaCl; or in DMSO at 25◦C with the addition of 1 wt% ChCl+1 wt% water.
case if a diffusion limitation is the origin of the peak C2. The peak
separation in voltammograms evidences that the water reduction is an irreversible process, and so the relation between thejpandCH2O, for
irreversible process at 60◦C, is given by Eq.1:3
jp =2.83·105nα0.5D0.5v0.5c [1] wherenis the number of electrons transferred,D(cm2 s−1) is the
diffusion coefficient of the redox species,c(mol cm−3) is the bulk
concentration of the redox species,v(V s−1) is the experimental scan
rate, andαis the transfer coefficient.1
If we assume that the water reduction in reline occurs according to the Eq.2, the same mechanism as in aqueous solution, as proposed for other non aqueous electrolytes:22,23
2H2O+2e−=H2+2OH− [2]
then the nominal values areα=0.5 andn=1, and it is possible to calculate the diffusion coefficient,D,from the slopesjpvs.CH2Oand
jpvs.v0.5. The calculation provides values of the order between 10−9
(for low water content) and 10−12cm2s−1(for high water content).
The diffusion coefficients reported at 30◦C in reline, ethaline or glyceline for H2O, hydrogen bond donor, and Cl−ions, are of the
order of magnitude between 10−7and 10−8cm2s−1.24The calculated Dvalues for H2O in this work are much lower than expected for DES
and ionic liquids in general, i.e. the values are not plausible, evidencing that the peak C2does not appear due to the purely diffusion controlled
water reduction.
Origin of the pre-wave C2.—In order to elucidate which process in
reline is responsible for the induction of the peak C2, the reline
com-ponents were separately investigated by CV. Fig.6presents voltam-mograms in molten urea, with water and choline chloride additions. In pure molten urea, only the bulk current is observed, as previously reported.25According to,8,26the bulk electroreduction of molten urea molecules proceeds through the Eq.3:
2NH2-CO-NH2+2e−=H2+2NH2-CO-NH− [3]
When water is added to molten urea, the same response is recorded, only the bulk reduction is shifted toward more positiveE, since instead of urea, the water electroreduction proceeds in this case, according to the Eq.2. When only dried choline chloride is added in low amount, again no peak appears, and the bulk current occurs at more positive E, due to the higher conductivity of the melt, but the electroreduction of urea occurs through the same reaction as in pure urea melt. Finally, when both choline chloride and water are present in urea (in a sufficient concentration), the pre-wave C2, characteristic for reline, appears.
Figure 7. Cyclic voltammograms recorded at Pt, at 60◦C, with scan rate of 15 mV s−1, in reline with differing ChCl and urea ratio.
Voltammograms with the identical shape, i.e. with the pre-wave C2in the same potential range, were recorded when choline chloride
was replaced with NaCl (mixture urea+water+NaCl), or when urea was replaced with organic inert solvent (mixture DMSO+water+ ChCl), as also shown in Fig.6. In other words, the peak C2 is
char-acteristic of mixtures water+organic solvent (urea plays this role in reline)+halide salt with alkali cation (in reline, this is choline chlo-ride). A literature search showed that such a voltammogram shape is well established for mixtures of water and alkali metal salts in many aprotic organic solvents, for example propylene carbonate, tetrahydro-furan, sulfolane, DMSO, N-methylpyrrolidone, acetonitrile, etc.27–29 In effect our findings indicate that reline may be regarded like such a mixture, where urea is an inert solvent, and choline cation (CH+) behaves like a salt with basic cation. What is more, the plot ofjpvs.
CH2O in such mixtures has been used earlier for the water content
measurement,27–29and the same possibility is demonstrated for reline in this work.
The foregoing discussion in this paper has been aimed to assess the assumption that the pre-wave C2is somehow related to the water
electroreduction (Eq.2), analogous to other involved water+organic solvent+basic cation salt mixtures. There may be two effects involved in the pre-wave, and they may be termed as “hydration” and “blocking” effects. The first effect means that the nominal concentration of water in reline may be high, but most of the water molecules are strongly bounded to choline cation, chloride anion or urea molecules due to hydration and, as a result, only a very low portion of free water is electroreduced. This has been observed for DES2and for propylene carbonate.25The second effect is that after Reaction2, a Reaction,4, may proceed, leading to the formation of choline hydroxide.
Ch++OH−=ChOH [4]
The solubility of this compound is much lower in reline than in wa-ter, and what is more, due to the high viscosity of reline, the dispersion of ChOH away from the electrode surface through convective effects, is slow. So, it precipitates at the working electrode, thereby decreasing the active surface and inducing the cathodic peak, as was proposed for the case of LiOH formation in various organic solvents.27–29
Some experimental observations support both possibilities. Firstly, the pre-wave C2increases with higher urea content in reline, as
[image:5.585.39.281.67.242.2]effect) or due to the higher solubility of hydroxide (lower blocking effect).
However, the diagram shapes in Fig.5a, do not support the “hydra-tion” effect to induce the pre-wave in reline, because the pre-wave is observed even at extremely high water content, when the “hydration” effect does not seem to be operating. As an example, take the water concentration of 0.033 mol cm−3(equals to 33 mol dm−3, i.e. 50 wt%
water in reline).31In this mixture, the molar ratio of the components urea: choline chloride: water is 2: 1: 15. It was shown earlier that at 50 wt% of water, the free water molecules definitely exist in high concentration in DES.31Therefore, instead of the voltammetric peak, a bulk current increase should be measured, but this is not the case according to the Fig.5a.
Since “hydration” is discounted, one needs to think of the second proposition, i.e. formation of choline hydroxide (ChOH). The pres-ence of choline hydroxide on the electrode was examined by using the following test, as in earlier works:27,28phenolphthalein was added to reline, as well as to pure urea melt and urea melt with 5 wt% water, and a short electrolysis at−0.95 V vs. SCE (potential of the pre-wave C2) was performed. In reline, at the very beginning of the electrolysis,
even before the hydrogen bubbles are observed, a pink film covers the Pt wire (Fig.8a). A part of the film is detached when the bubbles leave the surface, but the other part does not spread to the electrolyte, and slowly disappears in the next several minutes after the electrolysis is finished (Fig.8b). The layer is dissolved in reline, but the process is slow, probably due to the high viscosity. Therefore, in analogy to the theory for various organic solvents, we assume that this film decreases active electrode surface and induces the characteristic cathodic peak. On the contrary, in urea melt with or without water, as the electrolysis
proceeds, the bulk electrolyte changes color to slight pink, giving ev-idence that hydroxide ions spread from the working electrode to the bulk solution; however the Pt retains its original color (Fig.8c). This is a good sign that no hydroxide film is formed on the Pt surface when choline chloride is absent from the mixture.
Electrochemical confirmation for the blocking effect.—The dis-cussion in previous sections implies that the appearance of voltammet-ric peaks in reline is not due to the diffusion limitation, but rather the surface inhibition (passivation) of electrochemical reaction. This spe-cific case of a voltammogram is well known for processes like metal dissolution, oxidation of many organic compounds, and even hydro-gen oxidation.32,33The shape of a potentiostatic curve is a straight-forward criterion to determine whether the voltammetric peak origins from mass transfer, or rather the inhibiting (kinetic) limitation.32,33 The potentiostatic curve in this work refers to a polarization station-ary curve obtained whenEis changed step by step, held for a certain time at each value, andjis measured at the end of eachEpulse. After the current increase in the potentiostatic recording, diffusion limita-tion will tend to lead only to a constant limiting current with further change in potential, whereas an electrode passivation under potential control is associated with a region of decreasing current with further change in potential following the attainment of a limiting critical cur-rent (a peak appears in cathodic branch of potentiostatic curve).32,33To confirm further the proposed mechanism responsible for the induction of the peak C2, a potentiostatic curve was recorded and analyzed in
[image:6.585.116.473.66.199.2]reline (Fig.9). The appearance of the peak at the potentiostatic curve (Fig.9a) clearly confirms the blocking (shielding) effect present for this case, which agrees with the previous results.
[image:6.585.46.545.549.727.2]is low. What is more, at the potential of −1050 mV, the “passive region” is ended, i.e. the current increase is observed again, giving evidence that either a discharge can occur onto the layer of inhibiting species after it is formed, or a new mechanism arises as the potential is made more negative.33
One may conclude that the pre-wave C2in reline is a
manifesta-tion of water in the electroreducmanifesta-tion process inhibited by subsequent choline hydroxide formation. The presence of the pre-wave due to the low concentration of “free” water molecules, may be excluded for the case of high water content, although this effect may be present for low water content. Despite the almost linear dependence ofjpvs.
CH2O, the peak C2is not the “typical” voltammetric peak, i.e. due to
the mass transport limitation of a reactant with low concentration, as illustrated in Fig.6. Without choline (basic cation), the bulk current due to water reduction is observed. When the basic cation is added, the peak appears due to the choline hydroxide formation.
In the line with C2 assignment, the wide peak A2, varying in
intensity, and sometimes composed of two, not completely separated waves, could be related to the oxidation of the adsorbed H2 gas on
Pt.34The existence of two oxidation peaks would mean the existence of two energetic states for the adsorbed H2.34
As concerning the bulk current increase at the potential negative to the cathodic peak C2, we assume that this “depassivation” occurs due
to the fact that hydrogen bubbles, which still form at the surface not covered with ChOH, react with the hydroxide from the surface when a sufficiently high rate of formation is attained, thus enabling water electroreduction to proceed further.
Conclusions
Past investigations demonstrate the existence of pre-waves in cyclic voltammograms recorded in deep eutectic solvent named reline, as well as in other low temperature liquid mixtures of urea or choline chloride with various compounds. Several research groups offered tentative assumptions regarding these pre-waves in reline, i.e. that the pre-waves are the result of a two step reduction of either the choline cation, the urea molecule, or water molecule. All the assumptions were examined in this work, and in addition, the possible impurities were considered as reactants which could induce the characteristic pre-waves.
Ion chromatography showed no presence of ammonium ion in reline, so it was concluded that the decomposition of urea does not occur in this DES. The gas chromatography confirmed the presence of trimethylamine, evidencing that choline cation spontaneously decom-poses in reline. For this reason, voltammograms were recorded with the addition of trimethylammine, methyl chloride, acetaldehyde, and chloroethanol, as expected decomposition products, but none of the compounds changed the CV diagrams showing that the pre-wave is not due to reaction of decomposition products. The addition of oxygen and bicarbonate (it was assumed that bicarbonate ion is formed when CO2from the air enters reline), as expected gases from the air, also
did not change the CVs.
The only cases where a change in CV diagrams was observed, were water addition to reline or change in the ratio between urea and choline chloride. The experiments in molten urea showed that water itself does not induce the characteristic pre-wave, but when choline cation is added to the mixture of urea and water, the water electroreduction is inhibited and the pre-wave appears.
ever, this paper demonstrates that after a construction of a calibration curve, the cathodic peak intensity may be used for voltammetric deter-mination of water content in reline (and probably other deep eutectic solvents where water electrochemical signal is detected).
Acknowledgments
This research was financed by the Ministry of Education, Science and Technological Development, Republic of Serbia (grant No. III 45019) and Secretariat of Higher Education, Science, Technology, and Innovation of Ecuador (SENESCYT). The authors acknowledge networking support by a STSM grant from COST Action MP1407.
ORCID
A. C. Bastos https://orcid.org/0000-0003-1847-2332
J. B. Bajat https://orcid.org/0000-0003-0742-8176
References
1. R. G. Compton, C. Batchelor-McAuley, and E. J. F. Dickinson,Understanding Voltammetry: Problems and Solutions, Imperial College Press, London (2012). 2. E. L. Smith, A. P. Abbott, and K. S. Ryder,Chem. Rev.,114, 11060 (2014). 3. E. Gomez and E. Valles,Int. J. Electrochem. Sci.,8, 1443 (2013).
4. M. Buˇcko, D. Culliton, A. J. Betts, and J. B. Bajat,Trans. IMF.,95, 60 (2017). 5. M. L. Mares Badea, A. Cojocaru, and L. Anica,UPB Sci. Bull. B,76, 21 (2014). 6. P. Sebastian, E. G´omez, V. Climent, and J. M. Feliu,Electrochem. Commun.,78, 51
(2017).
7. D. Yue, Y. Jia, Y. Yao, J. Sun, and Y. Jing,Electrochim. Acta,65, 30 (2012). 8. T. Tsuda, K. Kondo, M. Baba, S. Suwa, Y. Ikeda, T. Sakamoto, S. Seino, H. Yoshida,
M. Ozaki, A. Imanishi, and S. Kuwabata,Electrochim. Acta,100, 285 (2013). 9. H. Liang, H. Li, Z. Wang, F. Wu, L. Chen, and X. Huang,J. Phys. Chem. B,105,
9966 (2001).
10. Q. Bao, L. Zhao, H. Jing, and A. Mao,Mater. Today Commun.,14, 249 (2018). 11. V. Constantin, A. K. Adya, and A. Popescu,Fluid Phase Equilibr.,395, 58 (2015). 12. P. Valverde, T. Green, and S. Roy,ECS Trans.,77(11), 859 (2017).
13. ASTM D6304, Standard test method for determination of water in petroleum prod-ucts, lubricating oils, and additives, by coulometric Karl Fischer titration. 14. S. Ghosh and S. Roy,Surf. Coat. Tech.,238, 165 (2014).
15. L. Vieira, R. Schennach, and B. Gollas,Electrochim. Acta,197, 344 (2016). 16. N. Elgrishi, K. J. Rountree, B. D. McCarthy, E. S. Rountree, T. T. Eisenhart, and
J. L. Dempsey,J. Chem. Educ.,95, 197 (2018).
17. S. Hyoda, Method of Producing Choline of a High Purity. In: S. Torii, (eds)Novel Trends in Electroorganic Synthesis, Springer, Tokyo (1998).
18. A. N. Alexandrova and W. L. Jorgensen,J. Phys. Chem. B,111, 720 (2007). 19. A. Nicolle, S. Cagnina, and T. de Bruin,Chem. Phys. Lett.,664, 149 (2016). 20. S. Sowmiah, V. Srinivasadesikan, M. C. Tseng, and Yen-Ho Chu,Molecules,14,
3780 (2009).
21. C. Du, B. Zhao, X. B. Chen, N. Birbilis, and H. Yang,Sci. Rep.6, 29225 (2016). 22. M. M. Islam, T. Okajima, S. Kojima, and T. Ohsaka,Chem. Commun.,42, 5330
(2008).
23. R. F. de Souza, J. C. Padilha, R. S. Goncalves, and J. Rault-Berthelot,Electrochem. Commun.,8, 211 (2006).
24. T. Zhekenov, N. Toksanbayev, Z. Kazakbayeva, D. Shah, and F. S. Mjalli,Fluid Phase Equilibr.,441, 43 (2017).
25. N. Tumanova, S. Volkov, S. Kochetova, T. Triphonova, and N. Buryak,J. Min. Metall. B,39, 69 (2003).
26. G. E. Mcmanis, A. N. Fletcher, D. E. Bliss, and M. H. Miles,J. Electroanal. Chem., 190, 171 (1985).
27. A. N. Dey,J. Electrochem. Soc,114, 823 (1967).
28. B. Burrows and S. Kirkland,J. Electrochem. Soc.115, 1164 (1968). 29. L. G. Irr,Electrochim. Acta,29, 1 (1984).
30. W. D. Sides and Q. Huang,Electrochim. Acta,266, 185 (2018).
31. O. S. Hammond, D. T. Bowron, and K. J. Edler,Angew. Chem. Int. Ed.56, 9782 (2017).
32. A. K. Vijh,Canadian Journal of Chemistry,48, 197 (1970). 33. D. Gilroy and B. E. Conway,J. Phys. Chem.,69, 1259 (1965).