Smart TSO-DSO interaction schemes, market architectures and ICT Solutions for the integration of ancillary services from demand side management and distributed generation
Cost-benefit analysis of the selected national
cases
D4.3
Authors:
Inés Gómez (Tecnalia), Sandra Riaño (Tecnalia), Carlos Madina (Tecnalia), Marco Rossi (RSE),
Pirkko Kuusela (VTT), Pekka Koponen (VTT), Hamid Aghaie (AIT), Gianluigi Migliavacca (RSE),
Enrique Rivero (VITO), Han Xu (Strathclyde), Ivana Kockar (Strathclyde)
Distribution Level Public
Responsible Partner Tecnalia
Checked by WP leader
Marco Rossi Date: 17/06/2019
Verified by the appointed Reviewers
Miguel Marroquín / Daniel Davi Date: 16/05/2019
Approved by Project Coordinator
Gianluigi Migliavacca Date: 19/06/2019
Issue Record
Planned delivery date M42 (30/06/2019)
Actual date of delivery M42 (30/06/2019)
Status and version 1.0 - Final
Version Date Author(s) Notes
0.0 March 2018 Tecnalia First draft
0.1 April 2019 Tecnalia Preliminary final version
0.2 May 2019 Tecnalia After addressing comments from reviewers
0.3 June 2019 Tecnalia After addressing comments from WP leader
Copyright 2016 SmartNet Page 1
About SmartNet
The project SmartNet (http://smartnet-project.eu) aims at providing architectures for optimized interaction between TSOs and DSOs in managing the exchange of information for monitoring, acquiring and operating ancillary services (frequency
control, frequency restoration, congestion management and voltage regulation) both at local and national level, taking into account
the European context. Local needs for ancillary services in distribution systems should be able to co-exist with system needs for
balancing and congestion management. Resources located in distribution systems, like demand side management and distributed
generation, are supposed to participate to the provision of ancillary services both locally and for the entire power system in the
context of competitive ancillary services markets.
Within SmartNet, answers are sought for to the following questions:
• Which ancillary services could be provided from distribution grid level to the whole power system?
• How should the coordination between TSOs and DSOs be organized to optimize the processes of procurement and activation of flexibility by system operators?
• How should the architectures of the real time markets (in particular the markets for frequency restoration and congestion management) be consequently revised?
• What information has to be exchanged between system operators and how should the communication (ICT) be organized to guarantee observability and control of distributed generation, flexible demand and storage systems?
The objective is to develop an ad hoc simulation platform able to model physical network, market and ICT in order to analyse
three national cases (Italy, Denmark, Spain). Different TSO-DSO coordination schemes are compared with reference to three
selected national cases (Italian, Danish, Spanish).
The simulation platform is then scaled up to a full replica lab, where the performance of real controller devices is tested.
In addition, three physical pilots are developed for the same national cases testing specific technological solutions regarding:
• monitoring of generators in distribution networks while enabling them to participate to frequency and voltage regulation,
• capability of flexible demand to provide ancillary services for the system (thermal inertia of indoor swimming pools, distributed storage of base stations for telecommunication).
Copyright 2016 SmartNet Page 2
Table of Contents
About SmartNet ... 1
Partners ... 1
List of Abbreviations and Acronyms ... 5
Executive Summary ... 7
1 Introduction ... 11
2 Selection of metrics for the CBA ... 13
2.1 Cost-Benefit Analysis and Multi-Criteria Decision Making ... 13
2.2 Literature review ... 14
2.2.1 JRC method ... 15
2.2.2 EPRI method ... 15
2.2.3 SG MCA method ... 16
2.2.4 ISGAN method ... 16
2.2.5 Task specific methods ... 17
2.3 Preliminary list of metrics and consultation ... 19
2.4 Final metrics selection ... 26
3 Methodologies for calculating the metrics for the CBA ... 29
3.1 Operational metrics calculation ... 30
3.1.1 Total mFRR cost ... 31
3.1.2 Total aFRR cost ... 31
3.1.3 Cost of unwanted measures ... 36
3.1.4 CO2 emissions assessment ... 37
3.2 ICT costs ... 38
3.2.1 Assumptions, framework and limitations of ICT cost estimation ... 38
3.2.2 The COCOMO method... 41
3.2.3 A hybrid estimation method ... 42
3.2.4 Data sources ... 43
3.2.5 ICT cost calculation ... 49
4 Results ... 53
4.1 ICT cost estimates ... 53
4.2 Comparison of coordination schemes in Denmark ... 59
4.2.1 Denmark dataset ... 59
4.2.2 mFRR provision cost ... 60
4.2.3 aFRR provision cost ... 62
4.2.4 UM provision cost ... 65
Copyright 2016 SmartNet Page 3
4.2.6 CO2 emissions savings ... 69
4.3 Comparison of coordination schemes in Italy ... 71
4.3.1 Italy dataset ... 71
4.3.2 mFRR provision cost ... 73
4.3.3 aFRR provision cost ... 75
4.3.4 UM provision cost ... 77
4.3.5 Cost results for Italy ... 79
4.3.6 CO2 emissions savings ... 82
4.4 Comparison of coordination schemes in Spain ... 83
4.4.1 Spain dataset ... 83
4.4.2 mFRR provision cost ... 85
4.4.3 aFRR provision cost ... 87
4.4.4 UM provision cost ... 89
4.4.5 Cost results for Spain ... 91
4.4.6 CO2 emissions savings ... 94
4.5 Discussion of results ... 95
5 Business-level analysis ... 98
5.1 e3 value methodology ...100
5.2 Description of participants ...104
5.3 Creation of the value models ...108
5.3.1 Coordination scheme A ... 108
5.3.2 Coordination scheme B ... 114
5.3.3 Coordination scheme C ... 117
5.3.4 Coordination scheme D ... 120
5.3.5 Main differences in the value models ... 122
5.4 Criteria for a successful business-level analysis ...124
6 Conclusions ...127
7 References ...129
8 Appendix I - Consultation ...136
9 Appendix II - ICT costs equations ...147
10 Appendix III – Potential of smart meters to support the provision of distributed ancillary services ...150
10.1 Introduction ...150
10.2 Control signal broadcasting technologies ...151
10.3 Reviews of European functional requirements of smart metering ...152
10.4 Costs of smart metering ...154
10.5 Adequacy of the smart metering requirements from the ancillary service point of view ...156
Copyright 2016 SmartNet Page 4
11 Appendix IV – Business-level analysis formulation ...159
11.1 Relationships between actors ...159
11.2 General formulas ...172
11.2.1 Retail electricity ... 173
11.2.2 Wholesale electricity ... 173
11.2.6 Balancing... 177
11.3 CS-Specific formulas ...181
11.3.1 Coordination scheme B... 181
11.3.2 Coordination scheme C ... 182
Copyright 2016 SmartNet Page 5
List of Abbreviations and Acronyms
Acronym Meaning
aFRR Automatic Frequency Restoration Reserve AMS Advanced Metering System
AS Ancillary Services
BRP Balancing Responsible Party CAPEX CAPital Expenditure
CBA Cost-Benefit Analysis CBR Cost-Benefit Ratio
CCGT Combined Cycle Gas Turbines CHP Combined Heat and Power COCOMO COnstructive COst Model
CO2 Carbon dioxide
CS Coordination Scheme
CS A Centralized ancillary services market model CS B Local ancillary services market model CS C Shared balancing responsibility model
CS D Common TSO-DSO ancillary services market model. Centralized variant. DER Distributed Energy Resources
DLMP Distribution Locational Marginal Pricing DMS Distribution Management System DSO Distribution System Operator EAC Equivalent Annual Costs EMS Energy Management System
ENTSO-E European Network of Transmission System Operators for Electricity EPRI Electric Power Research Institute
HV High Voltage
ICT Information and Communication Technologies IRR Internal Rate of Return
ISGAN International Smart Grid Action Network JRC Joint Research Centre
KPI Key Performance Indicator MCDM Multi Criteria Decision Making MDCU Meter Data Collection Unit
mFRR Manual Frequency Restoration Reserve NIS Network Information Systems
Copyright 2016 SmartNet Page 6 NRA National Regulatory Authority
OPEX OPerating EXpenditure OTS Operator Training Simulator
PM Person Months
PV Photovoltaic
RES Renewable Energy Sources
RTCM Real Time Congestion Management RTU Remote Terminal Units
RR Replacement Reserve
SCADA Supervisory control and data acquisition SG-MCA Smart Grid Multi-Criteria Analysis TCL Thermostatically Controlled Loads
ToU Time of Use
TRL Technology Readiness Levels TSO Transmission System Operator T&D Transmission & Distribution
Copyright 2016 SmartNet Page 7
Executive Summary
This deliverable describes the cost benefit analysis (CBA) performed within the H2020 SmartNet project aimed at determining which of the TSO-DSO coordination schemes (CSs) proposed during the project is the most suitable one to be deployed in each of the demo countries (Denmark, Italy and Spain) by 2030.
The growing penetration of medium and small-scale generation, flexible demand and storage systems in distribution networks requires an exhaustive analysis to determine to which extent the distributed energy resources (DER) can replace traditional generation in the provision of the network services; the resources should be aggregated effectively and an appropriate coordination between transmission system operators (TSOs), distribution system operators (DSOs) and aggregators is necessary.
SmartNet compares four TSO-DSO interaction schemes and different real-rime market architectures, with the aim of finding out which one could deliver the best compromise between costs and benefits for the system. For that purpose, an ad-hoc platform was developed to carry out simulations and perform a CBA to compare the benefits drawn by the system with the costs needed to implement each TSO-DSO interaction scheme, mainly the investments in information and communication technologies (ICT).
As a first step of the process, the analysis of several investment alternatives led to a CBA instead of Multi Criteria Decision Making (MCDM) process. The main advantages of CBA method compared to MCDM are that this method is most acknowledged and widely-used tool for assessing costs and benefits of industrial projects and that it includes detailed sector-specific guidelines which provide results by easy-to-read economic metrics. However, the main key issue of CBA method is identified as the high risk of double counting. Therefore, this preliminary analysis results in a list of metrics to be calculated:
1. Total mFRR cost: This metric includes the total balancing cost of the market defined in SmartNet.
The energy activated is remunerated at the nodal price resulting from the clearing process. The mFRR activations in the SmartNet balancing market are aimed to solve the network imbalance and to avoid congestions predicted in advance for the next time step.
2. Total aFRR cost: This is the cost of re-balancing the system after the mFRR market. In this case,
the bids submitted to the SmartNet market are ordered according to a system-wide merit order and the resulting price will be applied as marginal price (off-line simulation of aFRR market).
3. Cost of unwanted measures: this is the cost of emergency actions taken by network operators
caused by unpredicted network congestions. They are valued at the bid price.
4. ICT costs: These costs comprise the communications and information technologies, including the
Copyright 2016 SmartNet Page 8 These metrics are calculated for Denmark, Italy and Spain. The obtained results are shown below:
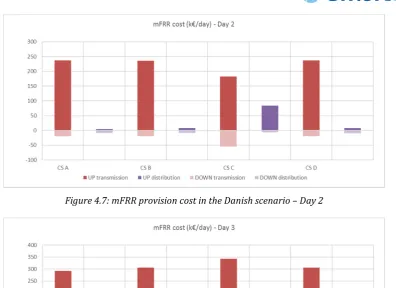
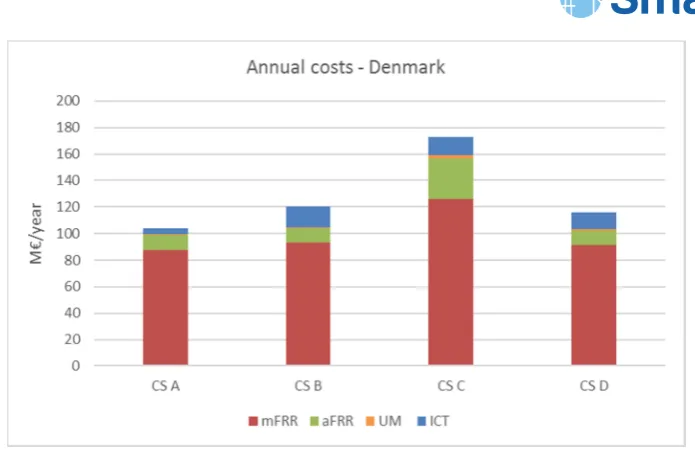
Figure 1: Annual costs for the Danish scenario
Copyright 2016 SmartNet Page 9
Figure 3: Annual costs for the Spanish scenario
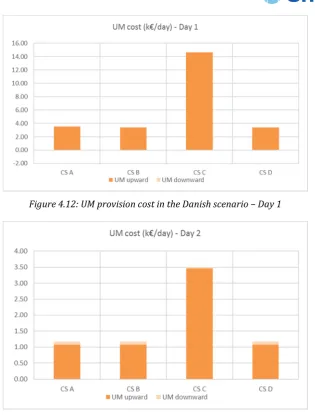
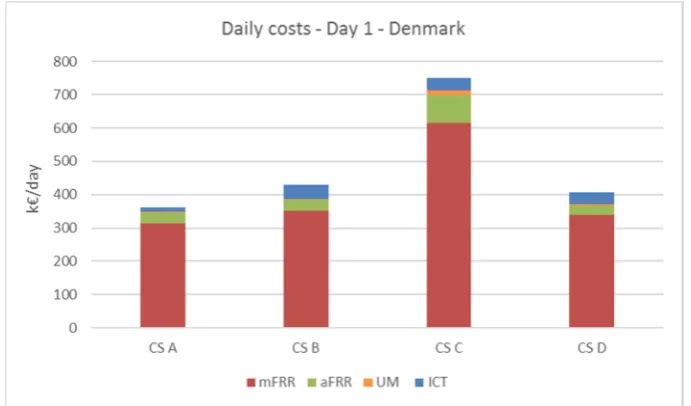
As demonstrated in the figures above, mFRR is the biggest cost component, the cost of unwanted measures is negligible and ICT costs only represent a very small part of total costs. Moreover, the effectiveness of the TSO-DSO coordination schemes depends on the level of services requested by the DSO and, hence, CS A performs best when there are few congestions at distribution level (as in the Danish case), but CS D is the most efficient one when there are frequent congestions at distribution level (as in the Italian case). In general, two-step markets (CS B and CS C) are less efficient than markets optimising in a single step (CS D) and may suffer from scarcity and/or illiquidity of resources; this effect is even more notorious in the case of CS C, where an additional constraint is introduced by fixing the active power exchange in the TSO-DSO interconnection and, thus, further taking the solution away from the overall optimum obtained in CS D. However, in rare circumstances (i.e. severe congestions at transmission level) the selection of two-step market architectures can be more beneficial than other schemes, as market separation potentially prevents the spreading of high nodal prices among distribution and transmission systems.
These indicators represent the economic impact of the different coordination schemes at power system- level, therefore their efficiency is assessed through the described CBA. However, CSs must also allow the involved actors to have a profitable business case, that is, CSs must lead to an appropriate allocation of costs and benefits among them. As an example, it is expected that aggregators will bear a large portion of ICT costs (communications with DERs, aggregation software, etc.), so they should be able to obtain a high enough return in order to pay for those investments. Therefore, a business-level analysis (also called “micro-level analysis”) is needed to assess the economic impact of the different CSs for all the relevant actors.
Copyright 2016 SmartNet Page 10 i) The deployment of the proposed coordination schemes implies regulatory changes which are
not defined yet. These modifications can take years, so, some of the estimated values could imply a considerable inclusion of inherent uncertainty on the long-term forecast.
ii) For the business-level economic analysis, the annual cash flows must be calculated. The obtained results from the SmartNet simulations can be considered representative for the system as a whole, but the results obtained with the number of time step simulated are less likely to be representative of the exchanges among the actors over a complete year.
Consequently, the business-level analysis developed only includes the identification of relationships and the formulas to be applied, but the specific data to be used is specified. Nevertheless, several theoretical boundary conditions (minimum set of economic parameters) are detailed in order to establish the issues which may strengthen or threaten the deployment of the proposed coordination schemes.
Copyright 2016 SmartNet Page 11
1
Introduction
The main objective of the SmartNet project is to provide optimised architectures for Transmission System Operator (TSO) – Distribution system operator (DSO) interaction [1][2]. Such optimisation must take into account the economic behaviour of each different coordination scheme (CS) and, thus, a cost-benefit analysis (CBA) is of utmost importance. Since the main objective of this deliverable is the analysis of the CSs from an economic perspective, an exhaustive definition of these CSs has not been included in it. However, sections from 5.3.1 to 5.3.4 show a brief overview of their main characteristics. For a more detailed information on the CSs definition, please see SmartNet deliverable 1.3 [1].
The CBA is oriented to identify the impacts at system-level (also called “macro-level analysis”), since the aim of the economic assessment was to identify which CS provides more efficient results in each country. Additionally, coordination schemes must also allow the involved actors to have a profitable business case, that is, that costs and benefits are properly allocated among them, which required a business-level analysis (also called “micro-level analysis”).
In order to carry out such CBA, an ad-hoc simulation platform was developed [3], where different scenarios were analysed for the three countries where SmartNet focuses: Italy, Denmark and Spain [4]. The flexibility market considered in the SmartNet project, which is called “Integrated Reserve Market”, is aimed at solving real-time imbalances and congestions between gate closure of intraday markets and real time until the opening of the next intraday market session [2], [3], [4], [5]. Its operation time is compatible with the timings of existing manual Frequency Restoration Reserve (mFRR) and Replacement Reserve (RR) markets [6], depending on the country. Although more details can be found in [2], for simplification purposes, the reader can understand that Integrated Reserve Market, SmartNet market, tertiary regulation market and mFRR market are the same kind of market. Likewise, automatic Frequency Restoration Reserve (aFRR) market can be assumed to be the same as secondary regulation market.
The results obtained in the simulation environment were the core input for the CBA described in this report. However, these results required an appropriate methodology to be applied. In a first step, a review of the literature related to economic assessment methodologies was performed, with a view to select the metrics to be considered within the CBA described in this report.
Copyright 2016 SmartNet Page 12
Figure 1.1: Approach for CBA in SmartNet project
Copyright 2016 SmartNet Page 13
2
Selection of metrics for the CBA
2.1
Cost-Benefit Analysis and Multi-Criteria Decision Making
The selection of the best alternative in complex investment processes, like the selection of the most appropriate CS, requires a deep analysis of the different implications that each of them has on the final result of the project. The best way to identify such implications is to use a set of metrics and to assign a weight to each of them. Defining the criteria (and their respective metric) is critical, because they must fulfil several characteristics to ensure that they really represent the complexity of the analysis. Furthermore, defining the weights is even more critical and controversial, since it needs to consider the whole conception of values, which is inherently subjective. The most important characteristics that the metrics must have is to be complete, non-overlapping, applicable, system-oriented, simple, reproducible, realistic, objective and documentable. Metrics can be of technical, social, environmental or economic nature, but the assessment described here focuses on the economic performance of the different coordination schemes and, hence, only the economic scope is relevant.
The use of metrics for analysing investment alternatives may lead to a cost-benefit analysis (CBA) or to a Multi Criteria Decision Making (MCDM) process.
On the one hand, a CBA is an analytical method for evaluating the costs and the benefits of a decision to determine the economic advantages and disadvantages of implementing that decision and to assess whether its benefits outweigh the costs or not. The basic assumption underlying CBA is the rationality of decision making. Cost benefit analysis can be performed either form a societal perspective which consider cost and benefits of a decision for the whole society or from a single or a group of stakeholders’ perspectives. Most common applications of CBA are to find optimal resource allocation between different alternatives and to find most profitable investment option among a set of different alternatives. The most widely used indicators of CBA results are Net Present Value (NPV), Internal Rate of Return (IRR), and Cost Benefit Ratio (CBR). NPV is equal to discounted benefits minus discounted costs over a specific time span and defined in equation (1). In this equation, is time, is the time span, is discount rate, is the benefits at time and is the costs at time . A positive NPV means that the decision has added value for decision makers and negative NPV means that the decision would bring losses to the decision makers.
=
1 +
−
(1)
Copyright 2016 SmartNet Page 14 attractive if the annual cash-flow (B) is bigger than the investment (C) multiplied by the uniform capital recovery factor, as described in equation (2).
> ∗ 1 + 1 + − 1∗ (2)
IRR is the rate of return or discount rate that sets the NPV of a decision equal to zero. A higher IRR would be more favourable for decision makers. Another metric for cost benefit analysis is CBR which is the ratio of total discounted costs of a decision over its life span divided by total discounted benefits over the same life span.
On the other hand, MCDM is mainly a qualitative approach for evaluating costs and benefits in complex decision-making problems and identifying the best decision among a set of alternatives [8]. In [9], the main advantages of MCDM are mentioned as: a) assessing mutually conflicting criteria, b) assessing simultaneously both tangible and intangible impacts, c) allowing probabilistic modelling of decision making problem, d) encouraging problem decomposition, e) involving stakeholders’ view directly in decision making process, f) allowing quantitate evaluations. A MCDM problem can be expressed in matrix format as:
=
…
…
…
⋮
⋮
⋮ … ⋮
…
(3)
= ! "
"
… "
#
(4)Where , ,…, are possible alternatives among which decision makers have to choose. , ,…, are criteria which demonstrate alternative performance, $% is the rating of alternative $ with respect to criterion % and "% is the weight of criterion %. [8]
2.2
Literature review
The first step to find the optimal interaction between TSO and DSO was to determine which approach, i.e. CBA or MCDM, was the most appropriate for this project. To this aim, several existing sector specific CBA and MCDM methodologies in the literature were reviewed.
Copyright 2016 SmartNet Page 15 In the following subsections, some of the most important CBA methodologies in the smart grids sector and their characteristics are described. However, since the CBA seemed to provide advantages over MCDM, more CBA methodologies were taken into account.
2.2.1
JRC method
Joint Research Centre (JRC) method provides a general guideline for CBA in smart grid projects. This approach has three main steps including definition of the boundary conditions, performing the CBA and performing a sensitivity analysis on the main parameters [10]. Defining the boundary conditions refers to identifying the conditional and parameters which are influential on the cost and benefit evaluations, identify the uncertainty of the available data for parameters and determining the time horizon for the CBA.
Figure 2.1: JRC approach for CBA in smart grid projects [10]
The main approach of JRC method is to define assets, map them to different functionalities and map these functionalities into associated costs and benefits. Then, these costs and benefit are monetized and compared with a predefined baseline scenario. This step is followed by performing the CBA, which is shown in Figure 2.1. The third (and last) step of JRC method is to perform a sensitivity analysis on the key parameters to evaluate the impact of a variation in these parameters on the final CBA results.
The JRC method was based on the EPRI method, which is described in the next subsection.
2.2.2
EPRI method
Copyright 2016 SmartNet Page 16
Figure 2.2: EPRI approach for CBA in smart grid demonstration projects [11]
Figure 2.2 shows the process to interpret the costs and benefits of specific devices, such as components of a system or project. First, each device is mapped to one or more functionalities according to their capabilities. A selection of these functions is defined as a set of applications which are classified into different branches. Then, measurable physical changes derived from a defined set of applications are translated as a set of impacts. Impact can be either direct, which means that they are confined to the project environment, or indirect, which means that they are out of the project scope. Metrics are calculated either directly from measurements or from impacts using relevant algorithms. Finally, both costs and benefits are derived by monetising associated impacts and metrics.
2.2.3
SG MCA method
Smart Grid Multi-Criteria Analysis (SG-MCA) is a method developed by State Grid cooperation of China and combines fuzzy logic with Analytic Hierarchy Process to assess costs and benefits of a smart grid project. This method is using a hierarchical structure so that, in each hierarchy, a set of metrics is assigned with a set of associated weights determined by experts. This method evaluates the projects based on four main categories of metrics including technical, social, economic, and practical. As a result, the performance of the project in terms of both four categories and as an entity is calculated in a final score [12].
2.2.4
ISGAN method
Copyright 2016 SmartNet Page 17 considering specific regulatory and market structures, as well as current system status, available generation assets and resources and demand profiles [13].
2.2.5
Task specific methods
Additionally, there are CBA methods which are specific to some decisions and tasks in power systems: •
••
• Investment project appraisal [14]: Figure 2.3 shows the main steps of this approach to evaluate
Copyright 2016 SmartNet Page 18
Figure 2.3: CBA approach for investment project appraisal or investment decision making
• ••
• Grid development projects: The European Network of Transmission System Operators for
Copyright 2016 SmartNet Page 19 Besides, a multi-criteria cost-benefit analysis for the assessment of transmission grid expansion is proposed in [16]. This study defines a top-down tree structure to avoid double counting of criteria. On the top of the tree, a rough classification of domains such as economic or environmental criteria are defined. Each of these domains is branching down to represent measurable criteria such as social welfare, CO2 emissions and so on. An example of the tree structure to determine Key Performance Indicators (KPIs) for transmission grid expansion project is shown in Figure 2.4. Then, all criteria and different alternatives are sorted in an evaluation matrix. The next step is to convert all criteria indicators into a utility value that represent the value of the indicator to the society. This task can be done by defining a utility function. The utility values of the indicators relevant to a single alternative can be combined in a weighted linear way to calculate the ranking parameter of that alternative. In the weighed linear combination, the weights vector incorporates the importance of one criterion (for decision makers or society) with respect to the others.
Figure 2.4: Top-down tree approach to determine KPIs for transmission expansion projects [16]
2.3
Preliminary list of metrics and consultation
As stated above, there was a preference for CBA before the literature review, which was confirmed during the process. The literature review process also resulted in a preliminary list of metrics, which are listed below:
i. Increased utilisation and hosting capacity of renewable energy sources (RES), i.e. less curtailment of RES
ii. Reduced Network losses iii. System Congestion Reduction
iv. Reduced Ancillary service cost (Voltage Quality and Frequency Stability improvement) v. System balancing improvement
Copyright 2016 SmartNet Page 20 viii. Information and Communication Technology (ICT) cost
This list was further elaborated by grouping or re-naming some of the initial metrics. In the case of “vi. Avoided and deferred network investment”, the time span of network and reserve investments is much longer than that of the operational real time markets. The combined optimisation problem of long-term investment and short-term operation is very stiff and, thus, numerically very difficult to solve accurately and efficiently without splitting. Moreover, the combined optimisation problem does not change much if the fast and slow parts are solved separately and, in order to solve the investment problem, it is necessary to consider the operational optimisation problem. Therefore, it was decided that SmartNet should focus on developing the fast, operational time span solutions and, thus, this metric was converted into “d) Cost attributable to network limitations”.
Then (July 2017), a consultation to the Advisory Board was organised, Ideas and alternatives for the cost-benefit analysis performance, with the aim to support the decision-making process for the system level analysis. The complete consultation document and its corresponding analysis can be found in the Appendix I. The metrics and monetisation methods proposed in the consultation document, are described below:
a) Enhanced provision of ancillary services: The TSO-DSO coordination schemes investigated in
SmartNet are aimed at increasing the competitiveness of ancillary service provision, by extending their related markets to distributed energy resources (DER), i.e., where the centre of mass of power flexibility is expected to be in a near future. In particular, SmartNet simulations are focused on the real-time market devoted to the activation of the flexible DER for the energy balance of the system (mFRR and RR depending on the country) taking into account also the network limitations (congestion management). The proposed metric to evaluate this aspect is the balancing cost which can be monetised by multiplying the cleared balancing cost and the activated volume, for each node ‘n’ and each time-step ‘t’.
b) Reduction of unwanted measures adopted by network operators in order to solve
congestions: As anticipated above, the real-time market simulated in SmartNet includes the
network models and limits. Depending on the TSO-DSO coordination scheme, this model is limited to transmission network or extended to the distribution grid. In addition, the market architecture impacts on the ability of the market operator in predicting network congestions and to, consequently, activate the right resources to avoid them. Having considered that the simulated coordination schemes are expected to solve congestions with different effectiveness, network operators will inevitably deal with some critical situations (unexpected congestions) to be immediately solved with dedicated (unwanted) measures, such as:
Copyright 2016 SmartNet Page 21 • Inhibition of bidding of non-prequalified resources. This case is of special importance in
the Centralised Market Model, where the DSO does not have access to DER flexibility and the constraints in the distribution grid are not taken into account by the market clearing algorithm; however, the DSO can pre-qualify DER to bid into markets, after checking that those bids will not create constraints in the distribution grid.
Even in this case, the monetization of the unwanted measures can be easily performed. In particular, since these actions inevitably1 cause an imbalance in the system, a good metric can be represented by the consequent imbalance price. However, when such imbalance price does not represent the price to compensate for curtailment, the compulsory limitation of flexibility can be evaluated according to the associated resource costs.
When monetising this metric several approaches were proposed in the consultation; i) considering the flexibility cost (the cost of the resources affected), ii) considering the average imbalance price or iii) considering the free market approaches.
c) Reduced network losses: Because of the non-ideal behaviour of network components, energy
losses are an unavoidable element of power systems and it may have a significant impact on the management of both transmission and distribution grids. Taking into account the market architectures investigated within SmartNet, there is a concrete potential of reducing energy losses by approaching supply and demand of ancillary services. The proposed CBA will compare the effects of each TSO-DSO coordination scheme on the energy losses by processing the simulation results. Their associated cost can be calculated by multiplying them by the energy price profile (resulting from the market). Thanks to this integration, the CBA will also consider the coordination scheme ability of selecting the optimal energy paths depending on the current price of energy.
d) Cost attributable to network limitations: The real-time market simulated in SmartNet takes
into account complete network models and it guarantees that the final activations are selected in order to avoid (voltage and loading) congestions and to keep energy losses limited. Depending on the TSO-DSO coordination scheme, the market effectiveness in taking into account network limitations is expected to be different and, consequently, the activated resources as well (with a direct impact on the cleared balancing price). Network operators are carefully considering the occurrence/severity of congestions and losses in order to evaluate grid refurbishment actions which, in turn, are inversely proportional to the effectiveness of the market in solving undesired situations. This effectiveness can be evaluated by comparing the cleared balancing price of the following two situations:
Copyright 2016 SmartNet Page 22 • Real situation, in which the entire physics of the network (losses, transmission capacity) is
simulated.
• Ideal situation (busbar simulation), in which electricity network is simulated disregarding the physics and with zero losses.
It is immediate to deduce that the price difference between these two situations corresponds to the cost attributable to congestion management and to network losses compensation (an intermediate situation could be performing a copperplate simulation, where the electricity networks have infinite transmission capacity, but network losses are taken into account, so that only the cost of congestion management could be derived from the price difference). This difference also directly returns a monetary value and it is a valuable metric for the profitability evaluation of refurbishment investments2.
e) Emissions savings: A more efficient cooperation between TSOs and DSOs, together with the
integration of network/resources models in the market clearing algorithms, is expected to be beneficial in the optimal management of available flexibility, including the one provided by low-carbon generation technologies (which are gradually replacing conventional plants with higher carbon emissions). Generation dispatch and unit commitment model is used for calculation of emissions savings in each coordination scheme compared to the reference scheme. Standard emission rates for each generation technology will be taken into account.
The monetization of CO2 costs is based on forecasted CO2 prices for electricity in the studied horizon. The price can be derived from official sources such as the International Energy Agency. In this case, the volume of CO2 emissions will be based on the generation mix resulting in the simulation of each coordination scheme.
f) ICT costs. Since there were several aspects to be asked to the advisory group, the questions related to this metric are described below.
In general, respondents agreed with the proposed metrics and monetisation methods, although they proposed different approaches for the analysis of some metrics. This feedback was used as an important input for the discussions leading to the selection of the final metrics to be considered and which are described in section 2.4.
Since the aim is to identify the most efficient TSO-DSO coordination scheme, i.e. the one with the lowest implementation and operational costs, in each of the countries under investigation (Italy, Denmark, Spain), the same metrics have been used, but the results of simulations are different for each country and, thus, also their calculation and monetisation results, leading to different CBA results in each
Copyright 2016 SmartNet Page 23 country. It is assumed that any kind of coordination between TSO and DSO will be more efficient than having no coordination at all, so there is no baseline scenario against which the different coordination schemes are compared.
However, the participation of DER in the provision of ancillary services for TSO and DSO requires the existence of an advanced communication infrastructure, which can also be used for additional applications, either for the DSO (billing, monitoring of grid status in real-time, etc.) or for the participation in other markets (day-ahead or intraday). Therefore, when considering ICT costs, it is worthwhile to consider that part of such communication infrastructure will already be there, as an evolution of present communication systems, as described in section 0. Since the centralized ancillary service market model (CS A), is the closest one to present situation, it has been taken as the baseline scenario as well. The topic of the baseline was also included in the consultation to the Advisory Board and the answers received supported the decision made.
An additional consequence of having such ICT infrastructure is that the ICT cost is one of the obvious metrics to be included in the CBA. Therefore, the consultation also included some questions about the ICT costs to be considered. The answers requested to include the following items, both in capital and operational expenditures:
• Supervisory control and data acquisition (SCADA):
o Main control centre software, licenses, etc. for SCADA, Energy Management System
(EMS) and Distribution Management System (DMS).
o Operator Training Simulator (OTS), either in house or outsourced. o Remote Terminal Units (RTUs) and local substation hardware.
o Telecommunication systems between substation RTUs and distribution control
centre.
o Front-end at control centre.
• Operational planning applications:
o Network applications.
o Market applications – system services. o Forecast applications.
o Regional coordinator (which can be outsourced).
• Metering cost (if needed):
o Meters, either at consumers’ or producers’ facilities. o Telecommunications (dial up).
o Database. o Applications.
• Other costs:
Copyright 2016 SmartNet Page 24
o Staff in ICT for maintaining the database and applications. o Staff in ICT team for development of new applications. o Uninterrupted Power Supply.
In general, there was a preference of outsourcing ICT services, although cyber-security is a critical point and the DSOs must be aware of this challenge. Cyber-security and interoperability were expected to be the most critical aspects to be considered in ICT costs.
Based on the results of the consultation to the advisory board and on several internal discussions, some modifications were made to the preliminary set of metrics. On the one hand, some of them were disaggregated to a lower level, so that the CBA analysis can provide more accurate and detailed results. To this end, the metric Enhanced provision of ancillary services was disaggregated into two metrics: i) provision of mFRR service, and ii) provision of aFRR service. Likewise, the reduction of unwanted measures adopted by network operators in order to solve congestions metric was divided in two metrics: i) unwanted measures, and ii) forecasting errors. On the other hand, Reduced network losses affect the relative value of the bids when calculating the nodal prices in the mFRR market, so it is included into the first metric and, thus, it was excluded from the list. Likewise, Emissions savings was removed from the CBA, because aggregators already include a cost for CO2 emissions when they create the bids to be sent to the mFRR market. As a result, CO2 emissions were calculated and compared for the different coordination schemes but were not monetised and added to the cost of the rest of metrics.
The resulting list of metrics was presented in different dissemination activities during the Autumn in 2018 [17], [18], [19], [20], [21]:
A. Total mFRR cost: This metric includes the total balancing cost of the market defined in SmartNet
[2]. The energy activated is remunerated at the nodal price resulting from the clearing process3. The mFRR activations in the SmartNet balancing market are aimed to solve the network imbalance and to avoid congestions predicted in advance for the next time step.
B. Total aFRR cost: This is the cost of re-balancing the system after the mFRR market. In this case,
the bids submitted to the SmartNet market are ordered according to a system-wide merit order and the resulting price will be applied as marginal price (off-line simulation of aFRR market).
C. Cost of unwanted measures: Each coordination scheme results in a different market setup.
Depending on the market setup adopted, the grid model included in the market clearing process, which aims at solving and avoiding congestion issues in the network, is more or less detailed. For example, the centralised AS market model (CS A) does not consider congestions at distribution level and, thus, the distribution grid model considered in the market clearing process is very simple. These simplifications, which allow a faster execution of the market clearing algorithm,
Copyright 2016 SmartNet Page 25 may create infeasibilities when dispatching units cleared in the market. This way, some bids accepted in the market may create congestions not identified by the grid model used. In this case, grid operators may need to take emergency actions to re-dispatch some resources aiming to solve real congestions in the grid. They can be caused by the partial activation of accepted bids or by the activation of non-accepted bids (flexibility requested to be activated even if the market did not select the related bid).
D. Cost of forecasting errors: This term also refers to deviations between market activations
(mFRR) and actual activations, but in this case, they are not due to limitations in the grid models used, but because the requested flexibility cannot be physically activated due to either flexibility modelling errors and/or flexibility forecasting errors. They can be caused by the partial activation of accepted bids or by the activation of non-accepted bids (flexibility requested to be activated even if the market did not select the related bid).
E. ICT costs: The term ICT cost comprises the communications and information technologies,
including the software for the aggregation and market clearing process. Only those ICT costs that are directly related to the implementation of each coordination scheme have been considered4. In this document, the term implementation is used to refer to the work in designing, specifying, coding, testing, validating and documenting software.
The CO2 emissions were also presented as an additional metric, but not monetised, as described above. For clarification purposes, Figure 2.5 below presents the characteristics of the different frequency regulation processes, as described by ENTSO-E.
Copyright 2016 SmartNet Page 26
Figure 2.5: Timing for different frequency regulation processes [22]
The questions received during the dissemination activities led to a final reflection about the suitability of the proposed metrics. In particular, the impact of the cost of forecasting errors was unclear for the audiences. Forecasting errors are caused by deviations between mFRR market activations and real activations, because the requested flexibility cannot be physically activated due to either flexibility modelling errors and/or flexibility forecasting errors. Forecasting errors may result in partial activations of accepted bids or in activations of non-accepted bids. As the CBA is focused at system level (and not at the business-case level), imbalance penalties were deemed not to be advisable, because they usually express the cost of the aFRR required to solve them and it has already been accounted for in the second metric. Hence, it was first decided to monetise this metric as the mFRR cost of the flexibility affected by the forecasting errors, that is, since some bids were matched in the mFRR market (and increased the mFRR cost) but did not provide the promised flexibility, leading to a need to dispatch the same amount of flexibility in the aFRR market (with its associated cost), it was decided to subtract the cost of those bids from the total mFRR cost, to account for the cost of that flexibility for the system only once.
However, subtracting these costs would have prevented the analysis to really account for the capacity of coordination schemes to deal with uncertainty. Although forecasting errors when calculating the available flexibility should not be widespread in AS markets, the decarbonisation of power systems will lead to progressive dismantling of firm-capacity, fossil fuel-based, big power plants, which will be replaced by intermittent, renewable, smaller power plants. Whatever coordination scheme is implemented in the future, it must deal with the intermittent nature of renewable-based power plants, so the impact of forecasting errors should not be removed from the scoring of CSs.
2.4
Final metrics selection
As a result, the final list of metrics in the following one:
1. Total mFRR cost: This metric includes the total balancing cost of the market defined in SmartNet
[2]. The energy activated is remunerated at the nodal price resulting from the clearing process. The mFRR activations in the SmartNet balancing market are aimed to solve the network imbalance and to avoid congestions predicted in advance for the next time step.
2. Total aFRR cost: This is the cost of re-balancing the system after the mFRR market. In this case,
the bids submitted to the SmartNet market are ordered according to a system-wide merit order and the resulting price will be applied as marginal price (off-line simulation of aFRR market).
3. Cost of unwanted measures: this is the cost of emergency actions taken by network operators
Copyright 2016 SmartNet Page 27
4. ICT costs: The term ICT cost comprises the communications and information technologies,
including the software for the aggregation and market clearing process. Only those ICT costs that are directly related to the implementation of each coordination scheme have been considered. In this sense, communication costs have been assumed to be very similar in all coordination schemes and, therefore, differences stem from the software needed for aggregation and market clearing5. Figure 2.6 shows the evolution of the metrics to be used in the CBA along the different stages. Since the cost of CO2 emissions is already included in the bids sent by aggregators to the mFRR, the metric was not monetised in the final list, but included as a complementary metric for informative purposes (that is why it is included in yellow). Likewise, network losses affect the relative value of the bids when calculating the nodal prices in the mFRR market, so it is included into the first metric and, thus, it was excluded from the final list.
Figure 2.6: Evolution of the metrics considered within the different stages of the CBA
It is important to highlight that the scenarios simulated in SmartNet, which provide the input for the CBA in this report are aimed at analysing normal situations in the operation of the power systems. Therefore, they represent three typical days for each of the countries under analysis and, thus, exceptional situations are not included in this analysis. Ancillary services are critical especially in exceptional situations in terms of system stability and resilience against abnormal conditions. However,
Copyright 2016 SmartNet Page 29
3
Methodologies for calculating the metrics for the CBA
The CBA was selected as the most suitable approach for the calculation of the macro-level analysis since this method tries to reduce the complexity of the problem by converting all metrics into a monetary unit (no need to assign weights as such, but just converting all the metrics into money). The CBA method allows a more straightforward comparison between the different alternatives and, for some metrics, the monetisation process in the CBA is more objective than assigning subjective weights as requested in the multi-criteria analysis.
In the SmartNet macro-level analysis, each TSO-DSO coordination scheme was assessed for Denmark, Italy and Spain and the results compared against a baseline (the centralised AS market model, CS A). Metrics were elaborated and applied for comparing the TSO-DSO interaction schemes for each national case and, as result, the different schemes were independently scored for each country, so that the most convenient architecture, which is different for each national case, could be identified.
Figure 3.1 shows the macro analysis synthesis, in which it can be seen that most of the metrics take the simulation results as a basis, but the ICT costs related to the coordination schemes were managed separately from the rest of the costs directly linked to the coordination schemes deployment. The reason is that most of the metrics result in operational costs, while ICT costs have a predominant investment component. As a result, the selected approach for the calculation of each operational metric is detailed in section 3.1, while the procedure for the ICT costs estimation is detailed in section 0.
Figure 3.1: Macro analysis synthesis
Copyright 2016 SmartNet Page 30 information for the CBA. However, CO2 emissions were not monetised because the bids sent by aggregators to the mFRR market already include an estimation of the cost of the CO2 ton.
3.1
Operational metrics calculation
The flexibility market considered in the SmartNet project, which is called “Integrated Reserve Market”, is aimed at solving real-time imbalances and congestions between gate closure of intraday markets and real time until the opening of the next intraday market session [2], [3], [4], [5]. The market horizon can vary as a function of the market requirements, but in general it would last from 15 minutes to 1 hour. When a market session is opened, bidders, which can be conventional and/or distributed energy sources at transmission and distribution networks, are asked to submit their flexibility bids. These can be in both directions, positive or negative, depending if they contribute to upward or downward balancing, respectively. Complex bids including temporal and/or logical constraints are also allowed.
Other important characteristics of the market clearing algorithm are that it considers a pay-as-clear approach and that it calculates nodal prices. In the pay-as-clear approach, all the activated bids receive the same price, which corresponds to the most expensive activated flexibility (as opposite to the pay-as-bid approach, where each activated pay-as-bid receives the price they pay-as-bid), so that the risk of market participants bidding in terms of what they want to receive instead of their real cost of flexibility is removed [23]. Likewise, nodal pricing is the most granular pricing approach, i.e. each node in the considered network has a different price, so that the effect that network losses and limitations in grid elements have in the price creation can be accounted for.
As described in [3], the simulation environment has been divided into three main layers:
1. Market layer: This layer integrates the market clearing algorithms, which process the bids proposed by the different market players and returns the optimal activations aimed at restoring the system balance and solving/avoiding network congestions.
2. Bidding and dispatching layer: In this layer the bids that different agents (both traditional producers and retailers and aggregators that represent the numerous flexible resources connected in distribution) send to the market layer are created. For that purpose, market players use different algorithms to process the available flexibility of energy resources into bids and to translate market results into activations.
3. Physical layer: This layer simulates the physical processes of the electrical network (transmission and distribution) as well as the generation, consumption and storage equipment connected to it. Therefore, it simulates the effects of the activations on transmission and distribution networks, including the physics of each (flexible and non-flexible) device connected to them.
Copyright 2016 SmartNet Page 31 this way, it has been possible to calculate the foreseen productions by the different types of technology, the consumptions and the prices in each one of the network nodes for each programming period.
3.1.1
Total mFRR cost
This indicator includes the total balancing cost in the SmartNet market. The mFRR activations are the result of the SmartNet balancing market. They are aimed at solving the network imbalance and congestions predicted for the next time steps.
As the motivation of the SmartNet market is to allow a fair and cost-efficient competition between different sources of flexibilities, including the ones located at the distribution level, it appears natural to use the most economically efficient approach of the marginal price. In the SmartNet market, network constraints, both at transmission and distribution levels, have to be taken into account. Marginal pricing can be adapted to a system with network constraints in different ways, becoming a Locational Marginal Price (LMP). This is the approach applied in the SmartNet market [2].
Therefore, the cost of the SmartNet market will be valued multiplying the energy matched in the SmartNet market by the corresponding nodal marginal price.
3.1.2
Total aFRR cost
Real power systems and energy resources are affected by forecasting errors and, for this reasons, mFRR activations are not typically capable of perfectly balancing the system and a residual imbalance is constantly experienced. In addition, actual power exchanges of resources, as well as unforeseen congestions, may require the intervention of network operators in re-dispatching programmable units (with a consequent impact on the mFRR balancing effectiveness – see section 3.1.3). Especially for this last motivation, TSO-DSO coordination schemes are expected to have an impact on the imbalance after the mFRR activation.
CBA needs to consider the residual imbalance to accurately evaluate (and compare) the performance of each TSO-DSO coordination scheme and to convert it into a cost. A possible approach consists of calculating the cost of activated aFRR, reserve that groups all the resources responsible of restoring the balance of the system after the mFRR activations.
aFRR resources are often experiencing economic losses in managing a regulation reserve (e.g. conventional generators cannot produce up to their technical limits, since a given percentage of power flexibility needs to be reserved for aFRR). For this reason, aFRR is typically more expensive than mFRR and the three reference countries are adopting different remuneration schemes:
Copyright 2016 SmartNet Page 32 • Italy, since reserve capacity is not remunerated, flexibility resources are submitting aFRR bids
more expensive than mFRR ones (Figure 3.2).6
Figure 3.2: Comparison between mFRR and aFRR flexibility prices
By 2030, these remuneration schemes are expected to change, but it is difficult to predict their evolution. For the sake of simplicity, an evolution of the Italian procurement method is supposed to be functional in all the considered countries with the following structure:
1. aFRR dimensioning at each balancing market session;
2. Construction and submission of aFRR bids by flexible resources;
3. Selection of aFRR participating resources on the basis of a merit order list;
4. Calculation of the aFRR cost on the basis of the actual aFRR activations and cleared price (cost of the most expensive selected resource).
3.1.2.1
aFRR dimensioning at each balancing market session
At each balancing market session, the aFRR total needs (downward and upward separately) are calculated for the next time steps. In theory, aFRR is dimensioned by using dedicated tools [24], with the role of anticipating the balancing reserve necessities. SmartNet is not dealing with the reserve dimensioning problem and, for this reason, aFRR procurement and activations are considered in an approximated way.
The simulation platform returns the residual imbalance after the selected mFRR activations and the application of re-dispatch measures by network operators for each time step7. This imbalance
6 In general, aFRR price is also more expensive than mFRR price in Denmark and Spain.
b
id
Copyright 2016 SmartNet Page 33 corresponds to the theoretical aFRR activation needs, and the resulting profile can be used for the dimensioning of aFRR volumes. This, of course, cannot be happening in the real world since activated volumes of aFRR are not known a priori. However, for the SmartNet investigations, the actual imbalance is considered a reasonable approximation of its prediction (the one used by a real reserve dimensioning tool). At this point, taking into account some simple safety margins (a minimum amount of reserve
aFRRmin and a coverage factor kaFRR), aFRR between the generic time instants t1 and t2 is dimensioned as:
&'())'())*+,-./ ÷ = min4'())$ , − min!678'9:7_9<='>'6?7÷ # × A-())B
/C,,-./ ÷ = max4−'())$ , max!FGH99:7_9<='>'6?7÷ # × A-())B (5)
Figure 3.3 reports an example of aFRR dimensioning based on the simulation results achieved for one day of Denmark. From the figure it is evident how aFRR is recalculated every hour, i.e. at each balancing market session, on the basis of the experienced residual imbalance.
Figure 3.3: aFRR dimensioning based on residual imbalance returned by simulations
(kaFRR=2 and aFRRmin=100 MW
3.1.2.2
Flexibility resources submit aFRR participation bids
According to the SmartNet investigations reported in [25], all the simulated flexible resources can theoretically participate in aFRR services. Since the simulation platform is not considering the
7 The simulation platform includes aFRR, but the selected activations are aimed at maintaining the stability of the system, rather than the full restoration of the residual imbalance. In addition, the aFRR resources are selected with practical criteria oriented to maintain a simple simulation structure. For these reasons, aFRR activations returned by the simulator are not always a realistic representation of the residual imbalance cost.
aFRR dimensioning procedure (Denmark day 1 - 6:00-18:00)
06:00 07:00 08:00 09:00 10:00 11:00 12:00 13:00 14:00 15:00 16:00 17:00 18:00
time [HH:MM]
-200 -150 -100 -50 0 50 100 150 200
R
e
s
e
rv
e
p
o
w
e
r
[M
W
]
upward aFRR needs (negative imbalance) downward aFRR needs (positive imbalance) upward aFRR reserve
Copyright 2016 SmartNet Page 34 procurement of the resources, the available flexibility to be offered for aFRR has to be calculated in post-processing. A possible way of creating aFRR bids consists of:
• looking at the submitted mFRR bids (mFRR bids are describing in an accurate way the available flexibility in every single simulated time step);
• hypothesizing aFRR flexibility identical to a fixed portion ka/mFRR of the submitted mFRR bids
(this portion has to be selected in order to make the available aFRR resources higher than the dimensioned aFRR needs – it might be varying country by country);
• applying penalization coefficients to aFRR flexibility costs in order to make it more expensive than mFRR (according to the data reported in Figure 3.4, possible choices are kpositive=1.24 and knegative=0.65 – to be applied to positive and negative costs respectively).
Figure 3.4: Comparison between mFRR and aFRR bidding curves for
ka/mFRR=0.1, kpositive=1.24 and knegative=0.65
3.1.2.3
Selection of aFRR participating resources
Once the aFRR bids are generated, the balancing market is assumed to process them by means of a merit order based procedure. While mFRR is used for both balancing and congestion management, its activation is beneficial for both transmission and distribution networks, and TSO DSO coordination schemes are affecting the selection procedure of the mFRR resources. On the contrary, aFRR is called to support balancing (which is not a distribution service) and the selection of the participating resources can be based on an independent/unique procedure:
-6 -4 -2 0 2 4 6
mFRR quantity [GW]
-150 -100 -50 0 50 100 150 200 m F R R c o s t [€ /M W h ]
mFRR bids from simulation (Denmark day 1 - 13:00)
upward mFRR bids downward mFRR bids
-0.6 -0.4 -0.2 0 0.2 0.4 0.6
assumed aFRR quantity [GW]
-150 -100 -50 0 50 100 150 200 a s s u m e d a F R R c o s t [€ /M W h ]
assumed aFRR availability (Denmark day 1 - 13:00)
upward aFRR bids downward aFRR bids Price and quantity scaling
Copyright 2016 SmartNet Page 35 The submitted flexibility quantities are compared with the reserve needs for the next time intervals, and the less expensive resources are selected to participate in aFRR services (Figure 3.5). Since SmartNet has adopted a pay as clear pricing for energy balancing, aFRR is remunerated with the marginal price of the most expensive selected resource. Figure 3.6 reports the resulting aFRR marginal price for (the simulated day of one scenario).
Figure 3.5: Comparison between the aFRR bidding curves and the reserve needs for a given time instant
Figure 3.6: Resulting aFRR marginal price for each simulated time instant
(ka/mFRR=0.1, kpositive=1.24 and knegative=0.65)
3.1.2.4
Calculation of the aFRR cost
At this point, all the details of aFRR dimensioning, procurement and activation have been defined and the total cost of this service can be easily calculated. As anticipated above, the aFRR activated volume for a given scenario is assumed to be the residual imbalance returned by the simulator (Figure 3.3). By
a
F
R
R
c
o
s
t
[€
/M
W
h
]
06:00 07:00 08:00 09:00 10:00 11:00 12:00 13:00 14:00 15:00 16:00 17:00 18:00
time [HH:MM]
-40 -20 0 20 40 60 80 100
a
F
R
R
m
a
rg
in
a
l
p
ri
c
e
[
€
/M
W
h
]
aFRR marginal price (Denmark day 1 - 6:00-18:00)
Copyright 2016 SmartNet Page 36 multiplying, for each time instant, the aFRR energy with the marginal price returned by the hypothesized balancing market (Figure 3.6), the total cost of aFRR can be finally calculated (Figure 3.7).
Figure 3.7: Resulting total cost of activated aFRR
3.1.3
Cost of unwanted measures
Market clearing and bidding algorithms result in activations decided on the basis of a forecasted situation. This means that, in addition to a residual imbalance after mFRR activations, network operators could also face unexpected congestions that have to be promptly solved by re-dispatching flexible resources in order to avoid the intervention of grid protections. Most of the time, re-dipatching consists of renewables curtailment, storage units and conventional generation rescheduling. These “unwanted measures” has a cost for the system and are dependent on the applied TSO-DSO coordination scheme8:
• Unwanted measures require the activation of flexibility, which is paid by the network operator (TSO or DSO depending on the re-dispatching competency) to the activated resources. It is assumed that re-dispatched resources are remunerated according their actual cost for reaching the requested set-point (pay as bid).
• From the cost perspective, unwanted measures have a more significant impact on the system imbalance. In fact, emergency re-dispatching is not operated in consideration of network balancing, increasing the requested volumes of aFRR (with a significant effect on the system total costs).
8 TSO-DSO coordination scheme A does not consider distribution network limitations and, in case of activation of distributed flexibilities, congestions at this level have to be solved separately with unwanted measures. This is not happening with market architectures including distribution grid modelling.
aFRR costs (Denmark day 1 - 6:00-18:00)
06:00 07:00 08:00 09:00 10:00 11:00 12:00 13:00 14:00 15:00 16:00 17:00 18:00
time [HH:MM]
-0.5 0 0.5 1 1.5 2 2.5
a
F
R
R
c
o
s
t
[k
€
]