Rochester Institute of Technology
RIT Scholar Works
Theses
5-3-2019
Analyzing the effects of individual and team
attributes on new product design outcomes
-Experimental Protocol Development and
Feasibility Assessment
Varun Sharma
[email protected]Follow this and additional works at:
https://scholarworks.rit.edu/theses
This Thesis is brought to you for free and open access by RIT Scholar Works. It has been accepted for inclusion in Theses by an authorized administrator of RIT Scholar Works. For more information, please [email protected].
Recommended Citation
R I T
Analyzing the effects of individual and team attributes on new
product design outcomes - Experimental Protocol Development
and Feasibility Assessment
by
Varun Sharma
A Thesis submitted in Partial Fulfilment of the Requirements for
the Degree of Master of Science in Industrial and Systems Engineering
Department of Industrial and Systems Engineering
Kate Gleason College of Engineering
Rochester Institute of Technology
Rochester NY
Committee Approval:
Dr. Marcos Esterman Date
Associate Professor, Department of Industrial and Systems Engineering
Thesis Advisor
Dr. Ehsan Rashedi Date
Assistant Professor, Department of Industrial and Systems Engineering
Committee Member
Dr. Elizabeth DeBartolo Date
Associate Professor and Director, Multidisciplinary Senior Design
Committee Member
Dr. Sandra Rothenberg Date
Professor and Department Chair, Department of Public Policy
Abstract
Rapidly changing markets demand quick turnaround from creative concepts into final products. This
requires firms to have extensive collaboration in their New Product Development (NPD) teams. However
effective management of teams can be difficult. In order to understand the challenges of multidisciplinary
product development this study focuses on student design teams conducting engineering design projects
at RIT. This study utilizes a modified team effectiveness model based on existing literature for identifying
hypothesized associations using a limited number of teams enrolled in senior design. It proposes an
experimental protocol for conducting this study at larger scale and identifies the appropriate tools needed
to measure team constructs. The study provides experimental techniques to collect team characteristic
data and it also develops techniques to quantify the design process. This study concludes that the
experimental protocol is feasible, but that the use of latent semantic analysis is not a feasible approach
to measure team mental models at the scale of the size of the MSD program. In addition, a novel method
to measure product development project outcomes is proposed that is based on Axiomatic Design
principles. Finally, a preliminary assessment of the expected associations suggests that five out of eight
propositions behave as predicted by the team effectiveness model; however, the number of project teams
Table of Contents
1. Introduction ... 1
2. Motivation ... 3
3. Literature Review / Background ... 4
4. Research Questions ... 11
5. Methodology ... 12
5.1 Hypothesized Model and Propositions ... 13
5.2 Data Collection Techniques and Measurement Scales ... 17
5.2.1 Team Characteristics ... 17
5.2.2 Work Structure ... 24
5.2.3 Team Collaboration ... 25
5.2.4 Design Process ... 26
5.2.5 Team Performance ... 33
5.3 Experimental protocol and data collection ... 39
5.4 Data Analysis ... 42
6. Experimental Protocol Feasibility ... 42
6.1 Input Data ... 43
6.2 Process Data ... 44
6.3 Output Data ... 47
7. Guidelines to Execute the Experimental Protocol ... 48
7.1 Preparation to conduct this study ... 48
7.2 Execution of this study ... 50
8. Preliminary Assessment of Hypothesized Association ... 52
9. Conclusion ... 57
10 Bibliography... 62
Appendix – I – Survey Instruments ... 65
List of tables
Table 1- Variables and measurement scales... 18
Table 2 - Correlation of mental models in teammates using UCINET ... 24
Table 3 – Results of work structure survey ... 25
Table 4 - Summary of PPI for the senior design projects in the study. ... 48
Table 5 - Correlation between Work Structure and Team Collaboration ... 53
Table 6 - Correlation between Performance Index and Work structure ... 53
Table 7 - Correlation between Product Performance Index and Team Collaboration ... 54
Table 8 - Resulting associations between constructs ... 56
Table 9 - Feasibility and usability assessment ... 60
Table 10 - List of Surveys in Appendix I... 65
List of Figures Figure 1-General I-P-O model ... 4
Figure 2- Input process output model for analyzing group framework, McGrath et al. [22] ... 7
Figure 3- Normative model of group effectiveness, Hackman et al. [19] ... 8
Figure 4 - Team effectiveness model by Tannenbaum et al. [10] ... 8
Figure 5 - Framework of effectiveness by student design teams by Tucker et al. [21] ... 9
Figure 6 - Framework of effectiveness by NPD teams by Sivasubramaniam et al. [1] ... 10
Figure 7- Hypothesized model by Takai et al. [7] ... 14
Figure 8 - Model plot of single values from an experiment ... 28
Figure 9 - Semantic Coherence ... 29
Figure 10 - SVD of Word to Utterance Matrix ... 30
Figure 11- Semantic analysis on reduced matrix ... 32
Figure 12 - Allowed Variation in System Requirement versus Actual Variation ... 35
Figure 13 - Breakdown for modified information content ... 38
Figure 14 - Marshmallow challenge (adapted from [50]) ... 40
Figure 15- Pilot study result for LSA ... 45
Figure 16 - LSA results of the MSD study – Wk7 ... 46
Figure 17 - LSA results of the MSD study. - Wk11... 47
Figure 18- Guidelines to conduct this research ... 50
Figure 19 - Variance of Work Structure vs. Standard Deviation of Peer Rating ... 53
Figure 20 - Variance of Work Structure vs. Performance Index ... 54
Figure 21 - Performance index vs. Average peer rating ... 55
1. Introduction
In a global economy with rapidly changing markets, the success of companies relies on New Product
Development (NPD). Hence, firms examine the factors responsible for their capability to develop and
introduce new products to the marketplace [1]. Three factors that define the success of NPD are
product efficiency, product effectiveness, and speed to market [1]. These factors are often measured
through cost of the product, features of the product, and the time it takes from idea conception to
the final product offering [1].
NPD success is impacted by many factors, which include technical uniqueness, competitive advantage,
diversity of market offerings, protection of market position, revenue and profitability [1]. Failure rates
for new products have been estimated to exceed 40% [2] therefore it is of paramount importance
that organizations avoid NPD failure in order to gain competitive advantage and ensure success in the
marketplace. NPD success requires advanced knowledge, creativity, and quick turnaround time from
idea generation to final product offering. To deliver responsive NPD to resolve challenges in the
marketplace, organizations need to be enabled and adaptive to collaborate and share diverse
occupational knowledge, which can be achieved through teams [3]. It can be said that the main
organizational building blocks to develop products are teams sharing diverse occupational knowledge,
i.e. the multidisciplinary team [3].
Increasing workplace knowledge requirements and the pressure to develop innovative solutions
result in rising levels of task complexity, which makes it difficult for individual employees to complete
their tasks without collaboration [4]. In response to the increasing complexity of current new product
development, many organizations have adopted a team-based approach to complete work and
other members [4]. Increasingly, organizations rely on NPD teams to generate creative ideas and to
mold these innovative ideas into streams of useful new products or services [5]. NPD teams carry out
the needed tasks to take products from idea to physical implementation of design and manufacturing
systems, while evaluating the supporting supply chain.
Current market forces call for quick turnaround from idea generation (conception) to manufacturing
[6]. To develop products faster, better, and cheaper, many organizations have shifted from serial
product development phases to the concurrent, team-based paradigm [6]. Concurrent engineering
operates on the premise that cross-functional teams interact to accomplish multiple activities (or
tasks) of the product development process simultaneously. As one increases the cross-functional
teams involved in the process, one can see that product development teams grow bigger and more
dynamically complex [6]. Concurrently working teams are capable of quick turnaround in the process
of generating solutions, implementing solutions, and validating solutions.
Although big and dynamic teams are advantageous, there are difficulties in effective management.
The mental models of developers and managers generally have not improved to include the dynamic
influences of concurrent engineering development projects, which involve iteration, increased
resource constraints, and multidisciplinary coordination of performance [6]. A long-term objective of
the research described in this thesis is to provide insights into the influence of teams on product
development performance, which will be useful to develop new guidelines for team formation and
management during NPD activities. The motivation for this study is discussed in section 2.
An extensive review of team effectiveness models by Takai et al. [7] proposed a team effectiveness
model and hypothesized associations between input, process and output parameters, which are
discussed in the literature review in section 3 . The research objectives are discussed in detail in
the hypothesized associations used as the basis of this work. The goal of this study is to report on the
conducted feasibility assessment so that the proper instruments, experimental protocols and analysis
procedures can be executed in order to test the hypothesized associations that are described in
section 5.1. Section 6 details the feasibility of the experimental protocol. The protocol to conduct this
study is discussed in section 7. Based on the results from limited number of teams, section 8 details
the preliminary assessment of hypothesized model. Finally, based on the learning of this study, the
conclusion and the protocol are laid out in section 9.
2. Motivation
Work structures involving teams are often more efficient and effective than individual work, which
explains the increasing prevalence of teams within organizations and educational settings [8]. The
need for teamwork in educational institutions is in line with the standards set by the Accreditation
Board for Engineering and Technology, Inc. (ABET) [9]. Responsible for setting accreditation standards
for American universities, ABET aims to ensure that graduates have the skills needed to enter
professional employment [9]. ABET’s engineering accreditation commission in 2010-11 found that one
area of concern for recent graduates is the ability to work in multi-disciplinary teams [9]. In the 2018
revision of ABET guidelines, criteria 7 was added requiring students demonstrate an ability to work in
teams, specifically in teams that establishes goals, plan tasks, meet deadlines and analyze risks.
However, research shows that one third of engineering graduates have poor work experiences in
teams with one-fifth of graduate students believing that teamwork hinders their learning [9]. This
suggests that that there is a need to better understand team interactions and develop guidelines for
improved teamwork. The improved guidelines will let the teams improve on the goals laid out by
ABET, which will further improve their team experience. Eventually, this could lead to improved team
3. Literature Review / Background
A team is defined as “a distinguishable set of two or more people who interact, dynamically,
interdependently and adaptively toward a common goal and valued goal/objective/mission, and who
each have some specific roles or functions to perform” [10] and has limited life span of membership
[10]. Research on teams focuses on themes in the areas of team formation [11-14], team
characteristics [1, 15-18], team process [4, 18, 19] and team effectiveness [1, 10, 19]. The literature
review highlights existing models that link team characteristics and team processes to team
effectiveness [1, 10, 19-21].
Meta-analytic studies have been used to summarize and gain insight from previous research on team
characteristics and team performance. One study on team performance, conducted by Tannenbaum
et al. [10] in the 90’s was based on the review of 17 team related studies. It concluded that task
difficulty, team roles, proficiency, skills and ability, cohesiveness and communications affect team
performance. A recent meta-analytic study done by Sivasubrimaniam et al. [1] based on 38 NPD team
related studies focused on new product development team performance and concluded that team
tenure, functional diversity, cognitive ability, communication, cohesiveness, and goal clarity along
with the exogenous factor of team leadership affect NPD Outcomes. Both meta-analytic studies have
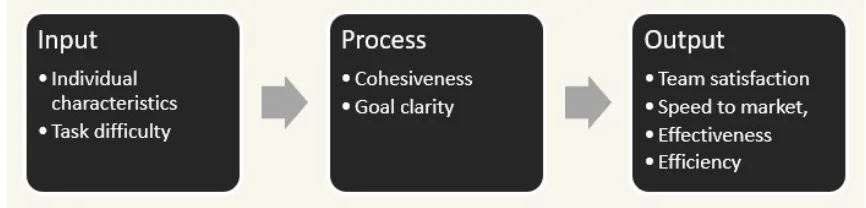
[image:10.612.97.530.569.673.2]used an input-process-output (I-P-O) framework for studying team effectiveness [1, 10] as shown in
Figure 1. The studies do not provide guidelines on how to apply these characteristics to form teams.
There is a branch of research focused on team formation and its effects on team performance.
Researchers identified team formation techniques based on
Jungian cognitive modes [11],
Team members external contacts [12],
Abilities, curricular interest (technical or nontechnical) and skills [13],
Student profiles like over-committed students, students with motivation and academic
problems, abrasive students [22],
Student self-selection or faculty selection considering a combination of student profiles like
work experience, gender, ethnicity, age range, and spatial compatibility [14].
These team formation studies indicate the positive effect of various team selection criteria on team
performance, however none of the studies create team effectiveness models to study emergent team
processes, which can have moderating effects on team outcomes.
The productivity of a team is highly influenced by characteristics they build together as a team through
interacting with one another to accomplish goals. Team performance (effectiveness) is based not only
on input characteristics (i.e. characteristics at the beginning of team formation) but on characteristics
that emerge in NPD, like group cohesiveness and goal clarity [1]. Group cohesiveness is dependent on
good teamwork and cooperation. Rotter et al. [15] suggest that good teamwork and cooperation
requires individuals of a group to trust each other. The trust and teamwork may be negatively
impacted when some team members do not equally contribute to projects leading to frustration
among team members thus creating a bad team experience for students [16]. This is known as ‘free
riding’ [16] or ‘social loafing’ [17]. This can also further lead to poorer team performance when team members get the perception that other team members are withholding effort and withhold the effort
work hard on their tasks minimize social loafing and promote shared commitment to the team and
teamwork [19]. Hackman [19] states that group performance is compromised by social loafing, but
Schippers [17] argues that social loafing is not always detrimental to team performance and that the
team members’ personality traits of agreeableness and conscientiousness (which are part of the big
5 personality traits) can improve team performance.
Goal clarity is another emergent characteristic of team performance and teams with specific and clear
goals outperform others [1]. Clear objectives for a team may be elusive as design projects are
exploratory and often have unclear objectives at the beginning of a project. Similarly, well-conceived
teamwork plans will have ‘slippage’ (actions that waste or misdirect the time and energy of team
members) [19]. Teams must adapt quickly to changing task demands to perform well by drawing on
shared mental models [4] or team mental models [18]. Mental models are organized knowledge
contexts that allow individuals to interact with the environment, hence describing, explaining, and
predicting the events in the environment [18]. Shared mental models or team mental models are the
shared knowledge between team members, which forecast team actions [18]. Team actions are the
activities, which are consistent and coordinated among teammates [18]. It is argued that if teams
communicate freely, the role of shared mental models would not be important [18]. Frequent
communication may be difficult due to workload, time pressure, or other environmental factors,
which impacts the existence and quality of a team strategy [18]. Shared mental models or team
mental models are studied in low fidelity simulated environments and hence the results of these
studies cannot be generalized to other team effectiveness studies [4, 18, 19].
Team effectiveness over a long research horizon has been studied via input, process, and output
models. Team effectiveness has been studied since 1960 starting with McGrath [22] and later
summarized by Hackman [19]; in the 1980s meta-analytic studies were performed by Tannenbaum et
McGrath’s model (Figure 2) considered input, process, and output. Inputs were divided into individual
factors, group level factors and environmental factors. Individual factors consist of skill, attitude, and
personality. Group level factors are comprised of size along with the level of cohesiveness.
Environmental factors include group task characteristics, reward structure and the level of
environmental stress, which affects the psyche of the team and the individual team members. In the
process section of the model, group interaction, intervention (i.e. training in group relation skills, role
negotiations, and consultation are measured. The model’s output section consists of quality, speed to
[image:13.612.153.457.278.442.2]solution, as well as team member satisfaction.
Figure 2- Input process output model for analyzing group framework, McGrath et al. [22]
Based on McGrath’s model, Hackman et al. [19] suggested a normative model for team effectiveness
(Figure 3). They assert that successful task performance in an organizational context needs a reward
system, an educational system for team skill development, and information systems to support the
team’s interaction. The group design consists of task structure, group composition, and group norms
structured to promote effectiveness influenced by group synergy [19]. In the presence of appropriate
group strategies and high process effectiveness where groups hold the required knowledge and use
appropriate task performance strategies, if the team does not have sufficient material resources in
Tannenbaum et al. [10] (Figure 4) proposed a model of team effectiveness, which is similar to
Hackman et al. [19] but offers consideration of individual characteristics as a separate construct,
similar to the research by McGrath [20]. Tannenbaum et al. [10] argue that the organizational
environment should be considered part of the organizational context. For example, the reward system
may impede or enhance team effectiveness [10]. In addition to Hackman’s model [19], the construct
of team interventions in the form of coaching and teambuilding improves team process and
[image:14.612.183.478.73.239.2]effectiveness [10].
[image:14.612.164.468.454.644.2]Based on Tannenbaum’s model, a recent model for team learning in a design context has been
developed by Tucker et al. [21] (Figure 5). The input consists of task design variables, which are
comprised of the variables of task structure, task assessment criteria, and team size. Further input
factors include individual level factors such as knowledge, skills, cognitive styles, personality styles,
attitude, and motivation. The team level factors include team cohesion, team composition,
leadership, and team climate. Similar to the Tannenbaum et al. [10] model, this model includes
feedback. The outputs of teamwork, skills, and attitudinal perspective impact the input of individual
[image:15.612.145.486.297.466.2]level factors illustrating the dynamic nature of teams as reflected in previous literature [10, 19].
Figure 5 - Framework of effectiveness by student design teams by Tucker et al. [21]
Recently, a meta-analytic study on NPD team performance with limited parameters was performed
by Sivasubramaniam et al. [1]. Their model (Figure 6) is based on previous studies focusing on a
smaller array of team variables as discussed below.
The model generated did not refer to the models discussed above by McGrath et al. [20], Hackean et
al. [19], Tanenbaum et al. [10] and Tucker et al. [21], but followed the similar Input-Process-Output
framework. Variables such as team size, leadership, and ability are consistent with, the other models
argument of improved shared mental models over time. This study did not consider individual
characteristics as an input, which were proposed in previous studies [10, 19-21]. Their research was
unable to draw causal inferences limiting their conclusions due to the limited inputs and outputs
[image:16.612.141.491.180.328.2]studied. [1].
Figure 6 - Framework of effectiveness by NPD teams by Sivasubramaniam et al. [1]
In summary, it is concluded that task characteristics and team characteristics affect team
performance. Design team performance is measured by parameters like product efficiency, product
performance, and product speed to market. Team characteristics may depend on team formation,
which can be based on characteristics like abilities, cognitive modes, and skills and on different
techniques to form teams [11]. Task characteristics are comprised of influencing factors such as the
difficulty and the novelty of the task. Once team project work commences, certain features emerge.
Characteristics like social loafing and sucker effect can adversely affect team performance and team
satisfaction. Team performance can be affected by emergent characteristics like goal clarity and
shared mental models. Team effectiveness is studied through the input-process-output model and
over the years, features like team interactions, feedback, and interventions have been added to the
team effectiveness model.
The studies, however, do not provide guidelines on how to apply these characteristics in team
process for a product design task was not considered. Finally, there is limited research on the
associations between the collective set of parameters in the input-process-output frameworks and
that consider these associations in an integrated manner that can provide a more comprehensive and
complete exploration of team characteristics and their effect over team processes and design team
outcomes [1, 10, 19-21]. Limitations in current literature lead to unanswered research questions as
discussed in the following section.
4. Research Questions
This study is part of a larger collaboration between Dr. Marcos Esterman of the Rochester Institute of
Technology and Dr. Shun Takai of Northern Illinois University. To bridge the research gap in literature
the research is split into three phases. First, the research observes the as-is team process and conducts
an exploratory study of individual and team characteristics, team processes and team outcomes.
Second, based on those results the research will modify and improve the team effectiveness model.
Third, based on the team effectiveness model the research will establish guidelines for effective
teams.
The scope of this research is to develop the experimental protocol through conducting an exploratory
study of team characteristics, team dynamics and team processes. This includes a feasibility
assessment of survey instruments and data collection methods, as well as a preliminary feasibility
assessment to validate propositions indicated in literature. The research serves as a baseline for future
development of team effectiveness models and the exploration of associations between parameters.
The exploratory study has the following objectives:
1. Identify and select (and modify, if necessary) the instruments that will be used to measure
2. Design and test the experimental design and analysis techniques, which includes surveys,
interviews, and recordings along with their associated analysis.
3. Develop the techniques to quantify the design process to compare the efficiency between
various team outputs.
4. Develop measures of team performance.
5. Demonstrate feasibility of the proposed measurement tools.
6. Identify possible follow-up and adjacent studies needed to improve the methods to test the
hypothesized associations.
Concluding this research there is an expectation of a guideline for experimental protocol, data
collection procedures, and data analysis procedures. There is also an expected exploration of the
hypothesized associations between the input process and output of the team model. This study has
been executed using the methodology described in the next section.
5. Methodology
In this section, the constructs that make up the team effectiveness model including measurement,
collection and analysis of these constructs will be discussed. In addition, the guidelines for the
experimental protocol will be developed.
Based on Takai et al. [7], the following is an overview of the methodology
• Modify the identified instruments in the model proposed by Takai et al. [7] (which will be
described in greater detail below) so that they are appropriate for the capstone design course
context
• Develop a small-scale experimental protocol to deploy the survey instruments, capture the data,
and analyze the data needed to generate insights for the development of the experimental
• Test and validate the small-scale experimental protocol
• Execute the small-scale experimental protocol and collect data
• Assess the expected associations for the small-scale experimental protocol
• Draw conclusions and develop guidelines for the experimental protocol at full-scale
The small-scale study was conducted using five design teams from Multidisciplinary Senior Design
(MSD) program at RIT. MSD is a year-long design project course where student teams develop
concrete design solutions in collaboration with project sponsors from industry, academia, student
entrepreneurs etc. , on design problems that result in tasks that are complex and open-ended.
The basis of team formation is predominantly faculty assignment to groups based on project
preference and skill matching data that is collected prior to the course. In a few situations student
self-selection for teams does occur.
Every year about 400 students enroll in MSD coursework to form approximately 80 teams. In this
study only five senior design teams were enrolled. The details of the teams and design project are
discussed in section 5.3.
In the following section, the hypothesized input-process-output model and the expected associations
are described in greater detail, including the experimental setup, the means of data collection, and
the data analysis methods.
5.1 Hypothesized Model and Propositions
The foundation of this study is the hypothesized team effectiveness model (Figure 7), which is
primarily based on Tannenbaum et al. [10] and informed by the other models reviewed above. The
root of this model is that design problems define the task characteristics. Task characteristics
which then impact team collaboration. Team collaboration can, in turn, influence the design process,
which affects team characteristics. Improved team collaboration and improved design process would
ultimately improve team performance. In this study, the quantification of task characteristics has not
been accounted for and hence its effects cannot be studied on the work structure and the team
characteristics. The numbered associations in Figure 7, marked in red, are the propositions that will
be assessed in this study. The rationale for these propositions is discussed below.
Proposition 1: Homogeneity of work structures will positively affect team collaboration
Work structure within a team, for example roles and communications, has a strong influence on team
performance [10]. Teammates sharing similar work structure preferences will easily coordinate their
activities and be “in sync” to improve performance [4]. Thus, the expected proposition is that the homogeneity of work structures will positively affect team collaboration.
Proposition 2: Team characteristics will affect team collaboration
Understanding of team characteristics such as knowledge, skills, attitudes, and preferences help team
members to tailor their behavior to fellow teammate expectations [4]. However, the diversity of these
[image:20.612.131.527.233.427.2]characteristics needs to be a balance between homogenous and heterogeneous characteristics.
Functional diversity can increase innovation, but it can also create more conflicting viewpoints for
problem solving in the team [1]. Diversification of characteristics assists in task completion; however,
the mental models should be task driven and shared enough to complete task collaboratively [4, 19].
Although task characteristics were not quantified in this study. The expected proposition is that a set of team characteristics comprised of aggregated individual characteristics of team members will enhance the team collaboration. This in turn will motivate students to contribute more hence reduce social loafing.
Proposition 3: Team characteristics will affect design process
Design outcome is dependent on better design process. Design process can be segmented to ideation,
prototyping and design task cohesion amongst team members. The number of concept sketches have
correlates positively with creativity and design outcome [24]. Similarly, the number of prototypes
have shown to have positive correlation with a successful final product [25]. Wilde’s [11] study
proposes that diversifying the cognitive modes of team members within the team improved creativity
and design outcomes of student design teams. Hence individual characteristics do effect design tasks,
which further impacts design outcomes. Wilde et al. [11] did not provide a quantifiable way to
measure design outcomes and only included cognitive mode as a single measurement of individual
characteristics of team members. Finally, Dong et al.[18] suggest that design task cohesion depends
on similarity of mental models, which is also a team characteristic. This study builds on that and proposes that the expected proposition is that certain team characteristics can improve the creativity and design process.
Proposition 4: Improved team collaboration will lead to improvement of design process.
Successful completion of a design project requires good teamwork and extensive collaboration among
Due to this team members will spend more time in design work related activities like generating new
ideas and creating more prototypes and hence will a better design process. The expected proposition is that improved team collaboration will lead to the improvement of design process.
Proposition 5: Improved team collaboration will positively affect team performance.
Group cohesion improves when workflow patterns are interdependent as is the case in new product
development projects [1]. As group cohesiveness increases, the proposition is that team collaboration will positively affect team performance.
Proposition 6: Better design process will affect the team performance.
The concept of “Fail often to succeed sooner” suggests that increased prototype generation in the
design process results in easier error discovery and correction, with quicker and better design
outcomes [25]. This process emphasizes human factors and behaviors while encouraging open and
unrestricted expression giving permission to try new ideas [25]. This improves team member
innovation and satisfaction. The expected proposition is that better design process will affect team performance.
Proposition 7: Homogenous work structure will enhance team performance
Teams with similar mental models will have homogeneous work structure and preference. Teams
with homogeneous mental models continue to perform better throughout a project [4]. Hence, the
expected proposition is that a homogenous work structure will enhance team performance.
Proposition 8: Team characteristics will affect team performance
Willingness of team members to perform their duties conscientiously and actively depends on the
development of trustworthy relationships [3]. Team cohesion can build these reliable relationships.
successful team performance. Some characteristics could be improved for teams to perform better,
while sometimes teams need diversification or external information sources to improve performance. Thus, the proposition is that team characteristics will affect the team performance.
5.2 Data Collection Techniques and Measurement Scales
Measurement of the input, process and output factors discussed above is accomplished using
following the constructs, which are summarized in Table 1 and are discussed in greater detail below.
Many instruments were found in the literature review to measure these factors. Given this is a
feasibility study, survey selection focused on the goal of minimizing the chance that individuals lose
interest prior to survey completion. Thus, the focus was on reduce the number of questions while
maintaining accuracy of the measurement constructs. This was accomplished in two ways. First, by
exploring if there was any research demonstrating a strong correlation between any two individual
characteristic constructs. Komarraju et al. [26] studied the correlation between personality traits and
motivation and academic achievement. MacDonald et al. [27] studied the correlation between MBTI
and the Big 5 Personality traits. Sadowski et al. [28] studied the correlation between Big 5 personality
traits and need for cognition. All the above studies did not provide any strong correlation (|r| < 0.75)
between any two individual constructs, thus none of these measures of personality traits were
eliminated.
Second, by exploring the correlation between the survey instruments so that instruments that were
correlated could be eliminated. The details of the survey types and correlation types are discussed in
greater detail below. All the surveys are available in Appendix – I – Survey Instruments.
5.2.1 Team Characteristics
Individual characteristics of teammates are primarily the basis of team characteristics. Individual
characteristics include knowledge, skills, ability, motivation, attitude, personality, and mental model.
aggregation of individual characteristics but also depend on resources like time that the team is willing
to spend on the project and the number of team members on the team. Team effectiveness is a
balance between homogeneity and heterogeneity of individual characteristics. Homogenous teams
may have few conflicts, but they may lack creativity, or the skills needed to finish the task. On the
other hand, an exceptionally diverse team may not reach a common consensus. Individual
characteristics recorded by surveys are aggregated to define team characteristics. Aggregation
methods such as average, variance, maximum and minimum of individual characteristics were used
[image:24.612.80.541.312.665.2]to derive different team characteristic scores.
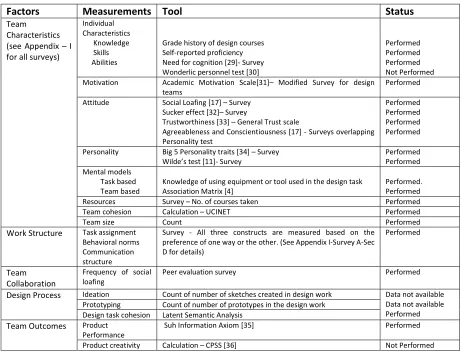
Table 1- Variables and measurement scales
Factors Measurements Tool Status
Team Characteristics (see Appendix – I for all surveys)
Individual Characteristics
Knowledge Skills Abilities
Grade history of design courses Self-reported proficiency Need for cognition [29]- Survey Wonderlic personnel test [30]
Performed Performed Performed Not Performed Motivation Academic Motivation Scale[31]– Modified Survey for design
teams Performed
Attitude Social Loafing [17] – Survey
Sucker effect [32]– Survey
Trustworthiness [33] – General Trust scale
Agreeableness and Conscientiousness [17] - Surveys overlapping Personality test
Performed Performed Performed Performed
Personality Big 5 Personality traits [34] – Survey
Wilde’s test [11]- Survey Performed Performed
Mental models Task based
Team based Knowledge of using equipment or tool used in the design task Association Matrix [4] Performed. Performed
Resources Survey – No. of courses taken Performed
Team cohesion Calculation – UCINET Performed
Team size Count Performed
Work Structure Task assignment Behavioral norms Communication structure
Survey - All three constructs are measured based on the preference of one way or the other. (See Appendix I-Survey A-Sec D for details)
Performed
Team Collaboration
Frequency of social
loafing Peer evaluation survey Performed
Design Process Ideation Count of number of sketches created in design work Data not available Data not available Performed
Prototyping Count of number of prototypes in the design work
Design task cohesion Latent Semantic Analysis
Team Outcomes Product
Performance Suh Information Axiom [35] Performed
5.2.1.1 Knowledge Skills and Abilities (K.S.A.) – Team performance improves when specific K.S.A.s are
present [10]. Knowledge is defined as an individual’s design related proficiency, which was captured
by student grades from design related course work. Skills (equipment skills like manual machining,
CNC or software skills like programming in python, LabVIEW) were captured by self-reported design
related skills (see example in Appendix I, Survey A, Section c). Although recorded, neither knowledge
nor skill data were aggregated to define team characteristics. Since all projects required different
functional expertise, all students reported different related course work, which could not be
aggregated in a meaningful way for such small sample size. Similarly, every design project was unique
and required a unique skill sets so the reported skill set could not be aggregated or quantified.
Abilities were captured by ‘need for cognition’ (NFC) using the need for cognition scale [29] (see Appendix I-Survey C-Sec. A). The individual team member need for cognition score was calculated by
adding the score on every question. Finally, these scores were aggregated to calculate team’s NFC
score. Multiple aggregating approaches such as min, max, average, and standard deviation were used
to calculate team’s NFC score.
5.2.1.2 Motivation – Individual motivation toward the design project was measured by the Academic
Motivation Scale [31]. The original Academic Motivation Scale was comprised of 28 questions and was
created by Vallerand et al. [37]. Based on Vallerand’s scale [37], Kairys et al. [31] created a 21 question
survey, which was used in this study. The original academic motivation scale was constructed for
general motivation in education. In order to make it specific to a design project context, intrinsic and
extrinsic motivators were changed to suit a design student need. For example the question in the
general motivation scale, which was originally worded as “ I want to complete my studies because
the studies will help me to achieve what I want” was changed to “ I want to complete this project
because I think that design experience will help me better prepare for the career I have chosen”.See
member motivation scores were aggregated into three subsets intrinsic motivation, extrinsic
motivation and amotivation. The scores on these three sets were added to give every individual a
score. After that these individual scores were aggregated to calculate the team’s motivation score on
the three subsets of intrinsic, extrinsic motivation and amotivation. Multiple aggregating approaches
such as min, max, average, and standard deviation were used for aggregation of individual scores to
team score.
5.2.1.3 Attitude - Groups can sometimes exploit, stress, and frustrate their members when there is
inequity in the work and members feel wasting time and effort in doing team work [19]. Schnake et
al. [23] observed that sometimes team members tend to put less effort in assigned teamwork than
the effort they would put forth if the work was assigned to them individually. This is known as ‘social
loafing’ [38]. This tendency to withhold effort in doing assigned teamwork may cause other team
members to emulate and hold their own efforts known as the ‘sucker effect’ [23]. However, research
argues that social loafing may not always dampen the individual’s performance. Social loafing by team
members may lead contributing team members to work harder collectively as they expect other team
member to perform poorly on the tasks. This effect is known as ‘social compensation’ [38].
Schipper et al. [17] has shown that social compensation in individuals is highly correlated to the
personality traits of agreeableness and contentiousness. As a result, social compensation was
measured by the Big -5 personality test mentioned in section 5.2.4. The details of the specific
measurements are discussed below.
Social loafing tendency was measured by a 4 item survey [17] (see Appendix I - Survey A – Sec
F).Individual scores were calculated by adding the scores of the questions in the questionnaires.
Sucker effect was measured by Abele and Diehl [32] in three subsets in a survey consisting of the
individual scores were calculated by adding the scores of respective subsets as rated by individuals.
Finally, social compensation was measured by conscientiousness and agreeableness of big 5
personality traits as given by Goldberg [39] and modified by Donnellan [34] as explained in Personality
section 5.2.1.4 below. Social compensation is also measured by trustworthiness using the General
Trust Scale [33]. The tools identified for measuring trust were the Interpersonal Trust Scale [15]
consisting of 25 questions and Yamagishi’s 6 question General Trust Scale [33] (see Appendix I-Survey
B -Sec B). The General Trust Survey was used as it contains less questions while providing accurate
construct measurement. The construct of trust for individual team members was calculated adding
survey scores of the general trust survey. The aggregation techniques used for individual scores to
provide team scores were min, max, average and standard deviation of social loafing score, trust score
and social compensation scores of individual teammates for measuring the respective team
characteristics described in this section.
5.2.1.4 Personality
Multiple studies claim that a team member’s personality affects team outcomes. The literature review
identified two methods to measure personality traits [11], [40] . In this exploratory study both surveys
were conducted. Wilde et al. [11] proposed that increasing the cognitive modes of team members in
a team will improve the overall product design. Once individual characteristics were captured, they
were grouped as cognitive modes of the team and number of cognitive modes of this team was used
as a team characteristic. Barrick et al. [40] also proposed that teams higher in conscientiousness,
agreeableness, extraversion, and emotional stability resulted in better team performance [40]. These
characteristics are part of the Big 5 personality traits, which were measured by IPIP (International
Personality Item Pool) scales modified by Donnellan et al. [34]. The original IPIP survey, which was
constructed by Goldberg et al. [39] consisted of 100 questions. The study done by Donnellan et al.
Thus, the survey by Donnellan et al. [34] was used to capture the Big 5 personality traits. The
aggregation techniques used were min, max, average and standard deviation of Big 5 personality trait
score of individual team members for defining the personality scores for the team.
5.2.1.5 Mental Models and Team Cohesion
Mental models are organized knowledge structures that determine how individuals/teams interact
with their environments [4]. The quality of team mental models as described by Dong et al. [18] are
based on two factors: accuracy and level of sharedness. The ability of a team to cope with difficult or
changing task conditions can be explained by the concept of shared mental models [4]. The rationale
is, in order to adapt quickly to changing situations the members should accurately predict what the
team is going to do and act accordingly. Therefore, the concept of shared mental models is the team
member’s ability to select their actions through well-structured knowledge that is consistent with
their teammates [4].
Mental models are further categorized into team-related content like knowledge, skills, attitudes and
tendencies and task-related contents like equipment functioning, operating procedures, system
limitations [4, 18]. Team based mental models were measured by a 6-attribute correlation matrix of
mental models: leadership, assertiveness, decision making, adaptability/ flexibility, situation
awareness, and communication (Appendix – I-Survey A-Sec G). Participants were asked to rate each
attribute of one mental model to all the other mental models as ‘+4 – strongly correlated’ or ‘ 0 –
unrelated’ or ‘-4 – negatively related’ in the correlation matrix [41]. Team cohesion and performance
are better in teams with centrality and sharedness of team based mental models [41]. Centrality and
sharedness are the basis of aggregation using the Pearson correlation (given by equation 1 & 2), which
compares each dyadic pair rating of one individual to the other individual in the team.
--- (1)
where
---(2)
where x and y are the score given by individual for a correlation between two constructs respectively.
𝑥̅ and 𝑦 are average of all scores given by the individual in the matrix respectively. n is the number of
correlations.
The Quadratic Assignment Procedure (QAP) in UCINET [42] calculates the Pearson correlation
between the team members and provides a social network analysis of the team by providing
correlation significance between the two mental models [41]. Statistically significant scores were
aggregated as average and employed as a measurement of team cohesion.
The output consisted of correlations and significant values as shown in Table 2. Each cell shows the
statistically significant correlations (p 0.05) between the two team members. The correlation of a
team member with themselves is considered statistically insignificant with respect to team mental
model. The team member score is the average of the statistically significant correlation scores of that
team member with all other members of team (shown in gray in Table 2). This defines how much a
team member’s team mental model aligns with the team. Finally, the team score is the average of all
the team member scores.
5.2.1.6 Resource
Resource constraints such as time, availability of devices, and scheduling may restrict engineers from
fully contributing to their projects. Resource constraints force team members to make tradeoff
decisions on the time spent on one project [43]. Resource constraints were surveyed through member
self-reporting regarding the number of credits enrolled in for the semester. It is assumed that
increased credits per semester results in less time devoted to the senior design project.
𝑧 = 𝑥 − 𝑥̅ (𝑛 − 11 ) ∑ (𝑥 − 𝑥̅)
𝑧 = 𝑦 − 𝑦
Table 2 - Correlation of mental models in teammates using UCINET
Member
1 Member 2 Member 3 Member 4 Member 5 Member 6
Member 1 r=1
p=0 r=0.742 p=0.005 r=0.714 p=0.011 r=0.861 p=0.008 r=0.341 p=0.151 r=0.061 p=0.469
Member 2 r=0.742
p=0.005 r=1 p=0 r=0.694 p=0.006 r=0.691 p=0.019 r=0.433 p=0.05 r=0.299 p=0.136
Member 3 r=0.714
p=0.011 r=0.694 p=0.006 r=1 p=0 r=0.701 p=0.018 r=0.345 p=0.124 r=-0.077 p=0.479
Member 4 r=0.861
p=0.008 r=0.691 p=0.019 r=0.701 p=0.018 r=1 p=0 r=0.363 p=0.146 r=-0.065 p=0.472
Member 5 r=0.341
p=0.151 r=0.433 p=0.05 r=0.345 p=0.124 r=0.363 p=0.146 r=1 p=0 r=0.281 p=0.178
Member 6 r=0.061
p=0.469 r=0.299 p=0.136 r=-0.077 p=0.479 r=-0.065 p=0.472 r=0.281 p=0.178 r=1 p=0 Avg member score
0.7723 0.64 0.703 0.751 0.433
Avg team score
0.6599
5.2.1.7. Team size
Small teams could lack in resources, skills, or workforce to achieve targets. However, larger teams
may be difficult to coordinate, and they may lack motivation. Motivational declines may occur as the
responsibilities of team members reduces as group size increases [19]. Therefore, team size is one of
the measured team characteristics.
5.2.2 Work Structure
Team members rated their preference on a 5-point scale survey regarding task assignments,
behavioral norms, and communication structures. Task assignments consist of assigning roles and
responsibilities to individuals, or a preference to work together on the entirety of the project. Norms
are inferred whether the roles are assigned, or teams prefer rotating roles. Communication structure
defines information sharing preferences among team members via face to face meetings and through
email communications. These factors were measured by a 5-point bipolar Likert scale. The 5-point
pole on scale. The work structure measurement instrument is given in appendix (Appendix I – Survey
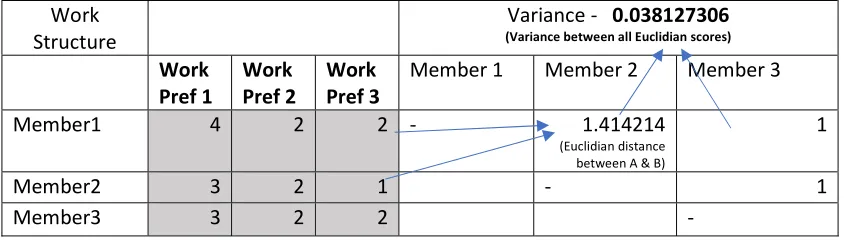
A – Section 5). Homogeneity of work structure was then calculated by measuring the variance in
pairwise Euclidian Distance between two individuals for all member combinations. A low variance in
preferences should indicate high homogeneity of work structure.
The output of this construct is shown in Table 3. Each cell on the left gives the rating as filled out by
the individual team members. The cells on the right give the pairwise Euclidian distances. The variance
[image:31.612.96.518.297.417.2]of these Euclidian distances is the team score of homogeneity of work structure characteristic.
Table 3 – Results of work structure survey
Work
Structure (Variance between all Euclidian scores)Variance - 0.038127306
Work
Pref 1 Work Pref 2 Work Pref 3 Member 1 Member 2 Member 3
Member1 4 2 2 - 1.414214
(Euclidian distance between A & B)
1
Member2 3 2 1 - 1
Member3 3 2 2 -
5.2.3 Team Collaboration
Cohesiveness and frequency of social loafing are indicators of team collaboration. Social loafing is
measured by using by the existing peer evaluation surveys for senior design (see Appendix-I-Peer
Evaluation). The survey asked students to provide an aggregate rating based on quality and quantity
of work, ability to meet deadlines, willingness to work with others and take responsibilities. The
aggregation of peer evaluation rating is based on the following assumptions. The average of a peer
evaluation rating is a measure of the degree to which collaboration happened in the team and is a
measure of a cohesiveness of team. The standard deviation, on the other hand, is the degree of
5.2.4 Design Process
Design process is the second process factor of the I-P-O model. It consists of three constructs -
ideation, prototyping and design task cohesion. As discussed in proposition 3 of the team
effectiveness model above, it is proposed that the design process influences the design outcome. The
constructs measured are as follows.
5.2.4.1 Ideation
In a design process, team members share their ideas by drawing sketches. The number of sketches
drawn have shown a positive association with design outcomes [44]. Initially it was thought that
ideation could be measured by the number of ideas generated by the team during the design phase.
However, this process had two drawbacks. First, the ideation process stretches much further than the
design phase and sub-system design can occur in later phases. Second, these data are not formally
documented in the senior design coursework and the students only present the team’s approved best
design. However, these data could be found in the students’ senior design journals. In the future,
participating teams could record all ideas and design sketches in their journals, but it would require
detailed inspections and reviews of these journals to measure this construct.
5.2.4.2 Prototyping
After ideation, the teams create prototypes to identify design flaws. The more prototypes the team
creates, the superior the design [25]. Initially it was proposed that prototyping could be measured by
the number of prototypes generated by design team over the lifetime of the design project. However,
after conducting this study it was concluded that not all prototypes created by the team were
select few prototypes or only the final prototype. In the future, collection of such data would require
close collaboration with team by the researcher to count the number of prototypes created by the
teams in the design phase.
5.2.4.3 Design task cohesion
In a design team, each team member knows certain aspects of the design problem which is
communicated during team discussions [18]. This communication leads each team member to hold a
perspective of design tasks in line with the team’s collective perspective [18]. This knowledge is not a
summation of each team member’s individual knowledge. The team knowledge is emergent, meaning
the team mental model emerges as the team members input knowledge via communication channels.
This communication makes the individual mental models align with team mental model [18]. Dong et
al. [45] proposed in their research that if pattern identification is performed on the team
communication, the pattern will emerge in terms of word choice and in terms of word to document
meaning. This is the basis of latent semantic analysis (LSA), which is a computational linguistic tool
that links words to concepts. LSA is preferred over other linguistic tools for two reasons. First, LSA is
independent of word order or syntax [45]. Second, unlike other computational linguistic tools, LSA
performance does not degrade with noisy data [45]. Latent semantic analysis works on following
principle. First, it defines words and phrases in terms of orthonormal vectors of concepts [45]. Second,
it links the contribution of team members to the orthonormal concept based on the utterances by the
team member [45] . These features make LSA reflective of team mental models. Team mental models
can be quantified in terms of the number of concepts and the contributions of each team member to
those concepts.
Latent Semantic Analysis performs a Single Value Decomposition (SVD) of the matrix, which consists
side (see equation 3, where X is this word-to-utterances matrix). An utterance is the statement or
group of statements spoken by an individual team member during their turn. The matrix is populated
by the frequency of the phrases in the utterance. SVD is performed on this matrix, which results in
three matrices shown in equation 3: -
---(3)
Where X is the word to utterance matrix
U is left singular vectors which gives the weights of all utterances per concept
S is the singular values, this gives the number of concepts with the strength of each concept V is the right singular vectors, this gives the weights of words for all concepts
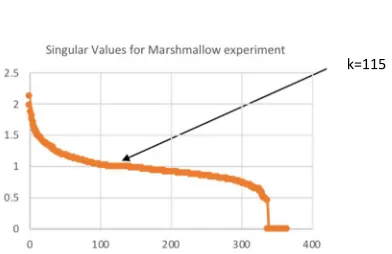
Once the matrix is decomposed the significant concept ‘k’ are retained and the reduced matrix is
reconstructed. The ‘k’ is calculated by identifying the number of strong concepts using the singular
values and evaluating its decomposition through the concepts. Once the singular value matrix ‘S’ is
obtained, It can be plotted on the graph and the flat area on the curve, which shows the singular
values are not changing from one concept to other it can be eliminated as shown in Figure 8. Reduced
matrix pulls strongly connected points together and pushes weakly connected points further apart.
The reduced matrix is given as
---(4)
where k ≤ n
X= 𝑈 ∗ 𝑆 ∗ 𝑉
Xk= 𝑈 ∗𝑆 ∗ 𝑉
[image:34.612.219.415.564.691.2]k=115
Once the reduced matrix is formed, following operations are done on the resulting matrix, Xk. This can
be seen in Figure 9 -
1. Calculate the emergent mental model – 𝛾 – This is a column vector. It is calculated as the row
average of the reduced matrix, Xk.
2. Calculate mental model for each team member at an instance of utterance ‘t’ – 𝜑, – This is
calculated as the mean of row space of reduced matrix at every utterance for every team member.
3. Calculate the similarity between the individual mental model and team mental model – This is
calculated using cosine values between the 𝛾 & 𝜑,
4. Calculate the rate and duration of sharedness of mental models – This is given by area under the
curve between emergent mental model and team member mental model.
θ = ∫ ℵ (γ, φ, ) dt ---(5)
One of the important differences between the work reported in Dong et al. [45] and this study is that
Dong’s work created a word to utterance matrix using term frequency. However, in this study, the
word to utterance matrix using term frequency – inverse document frequency (tf-idf) is created. This
[image:35.612.120.523.368.595.2]is because the amount of knowledge created is not proportional to the amount of communication. In
a conversation, common words and common knowledge are repeated too often in a conversation. On
the other hand, rare words often generate significantly new knowledge. This is the basis of tf-idf. The
tf-idf assigns a weight to the word. This is done using following formula
𝑡𝑓 − 𝑖𝑑𝑓(𝑡, 𝑑, 𝐷) = 𝑓, log| ∈ : ∈ | ---(6)
where it is term in dth document in D documents containing term ‘t’, N is the number of documents.
To illustrate single value decomposition, an example with 4 utterances is presented below. The
resulting word to utterance (tf-idf) matrix is created as shown in Figure 10. The Equation 4 is used for
single value decomposition. The resulting matrix S, U, V are shown below.
[image:36.612.178.532.425.684.2]Dialogue 1 - Sun rises east. Dialogue 2 - Baby boy born. Dialogue 3 - Sun goes east to west. Dialogue 4 - Baby gets older to a man.
U =
U1 U2 U3 U18 U19 U20 U21
U1 -0.3113 0 0 . . 0.183 0.1893 0.183 0.2945
U2 -0.3113 0 0 . . 0.0522 -0.3993 0.0522 -0.2728
U3 -0.3113 0 0 . . -0.0438 0.1141 -0.0438 0.055
U4 -0.4429 0 0 . . -0.3188 0.0883 -0.3188 -0.1839
: : : . . : : : :
U18 0 0.2527 -0.2981 . . 0.8473 0.0207 -0.1527 -0.1051 U19 0 0.3206 0.3412 . . 0.0207 0.7807 0.0207 -0.1562 U20 0 0.2527 -0.2981 . . -0.1527 0.0207 0.8473 -0.1051 U21 0 0.4533 0.0317 . . -0.1051 -0.1562 -0.1051 0.7935
S = [ 1.1181 1.0628 0.9486 0.8739]
V =
Since this is a very small data set the single values are not very far apart from each other. However,
taking k=2 (i.e. Single values > 1) the matrix is recreated using equation 5. From the resulting matrix
resultant and emergent mental model 𝛾 & 𝜑, were created as shown in Figure 11 . Finally, the cosine
values between the 2 vectors 𝛾 & 𝜑, was calculated.
5.2.4.3.1 Implementation of Semantic Analysis.
To implement the latent semantic analysis the following steps were taken:
A. Preparation of the input data for analysis
1. Team discussion were video recorded. This recording was then manually transcribed, and the
design relevant non-verbal information was added.
V1 V2 V3 V4
V1 -0.71 0 0 0.70
V2 0 0.72 0.68 0
V3 -0.70 0 0 -0.71
2. The pronouns used in the discussion were replaced by objects using the visual cues in the video
[image:38.612.72.525.141.425.2]recording.
Figure 11- Semantic analysis on reduced matrix
3. Data was standardized throughout the document. The abbreviations were expanded. The
numbers were standardized like 3 and ‘three’ were uniformly converted to ‘three’. The
punctuation marks were removed. Each utterance started with a new line on the document. After
this standardization this file is stored as a plain text file for python code input.
B. Data Processing
1. Python libraries used in this code are nltk (natural language toolkit), sklearn (sci-kit learn)
2. Connecting words, names of people, common knowledge were grouped into a set called ‘stop
3. Word separator and phrase length that were significant for this analysis were set. This is
dependent on the researcher on how the data is arranged. In this case the word separator was a
<space> key. Phrase length is dependent on the number of words that are considered as a phrase.
In this analysis, all unigrams (one-word phrases), bigrams (two-word phrases), trigrams
(three-word phrases) were considered as valid phrases.
4. The word-to-utterance matrix was created and populated with the tf-idf weights.
5. SVD analysis was conducted and the matrix was recreated after performing dimensionality
reduction as prescribed above. This matrix is called ‘Xk’
C. Output Analysis
1. Calculate the emergent mental model, described above as γ, by averaging the row space matrix
‘X’.
2. Calculate the emergent team mental model 𝛾 after every utterance, which results from averaging
the row space after each utterance.
3. Similarly calculate each team member’s mental model after each utterance as 𝜑, , which
averages and updates the row space only when a team member speaks.
4. Calculate the cosine values between 𝛾 and γ, 𝜑, and γ to see the emergent team and individual
mental model at every utterance. This data can then be plotted to see the gradual emergence of
mental models.
5.2.5 Team Performance
Team performance is the output section of the I-P-O model. Team performance in NPD can be
resulting solution, as well by assessing as the team’s experience to develop the solution. As such, team
performance will be measured by measuring product creativity, product performance, and team
member satisfaction.
5.2.5.1 Product performance
The product performance of a finished product in MSD course is judged on seven-point scale (ranging
from 1: poor to 7: excellent) and by numerical evaluation with respect to product requirement. It was
found that there are differences between the student’s self-assessment of product performance and
the customer’s rating [46]. Moreover the assessments are subjective [46] and the complexity of the
design projects are different. Some projects might result in a physical product while other may have
a process or software as the final product without any physical form. To overcome this, Axiomatic
Design principles are used to quantify the product performance [35]. Axiomatic Design links functional
requirements to design parameters. Design parameters are then linked to process variables [35].
Process variables define the range of values under which the parameter is satisfactory. The amount
of observations outside the process variable are called information content. Axiomatic design states
that the design with lowest information content is the best design. It also suggests that the functional
requirements captured in the design study are mutually independent. Therefore, the information
content can be aggregated over all the design variables and an aggregate score for a design can be
provided.
Information content is measured by observing the actual variation of a functional parameter
(equivalently a system requirement) relative to its target value and allowed range of variation. This is
shown in Figure 12 and equation 7 defines information content for the functional parameter, x.
---(7)
where p is the probability of observation inside the allowed range of variation.
Figure 12 - Allowed Variation in System Requirement versus Actual Variation
While conducting this study the following type of data was available and the approaches taken to
calculate the probabilities are described below for different cases:
1. Functional requirement is a continuous variable with multiple data points available – When there
is enough data, it is possible to establish what the underlying distribution is, what the central
tendency is and what the variance is. With these pieces of information, it is possible to calculate
the probability of meeting the system requirement. It should be noted that system requirements
are dependent variables that result from the culmination of many design decisions and the effects
of many design parameters. As such, the central limit theorem would suggest that the cumulative
resultant effect of these design parameters, which themselves may not be normally distributed,
would lead to a normally distributed system requirement. Use normal probability distribution to
calculate the probability of data being inside allowed range of variation, pi
2. Functional requirement is a continuous variable with single data points available – In the case that
the senior team has only been able to run a single test and the reported data point is within the
![Figure 2- Input process output model for analyzing group framework, McGrath et al. [22]](https://thumb-us.123doks.com/thumbv2/123dok_us/25730.1992/13.612.153.457.278.442/figure-input-process-output-model-analyzing-framework-mcgrath.webp)
![Figure 3- Normative model of group effectiveness, Hackman et al. [19]](https://thumb-us.123doks.com/thumbv2/123dok_us/25730.1992/14.612.164.468.454.644/figure-normative-model-group-effectiveness-hackman-et-al.webp)
![Figure 5 - Framework of effectiveness by student design teams by Tucker et al. [21]](https://thumb-us.123doks.com/thumbv2/123dok_us/25730.1992/15.612.145.486.297.466/figure-framework-effectiveness-student-design-teams-tucker-et.webp)
![Figure 6 - Framework of effectiveness by NPD teams by Sivasubramaniam et al. [1]](https://thumb-us.123doks.com/thumbv2/123dok_us/25730.1992/16.612.141.491.180.328/figure-framework-effectiveness-npd-teams-sivasubramaniam-et-al.webp)
![Figure 7- Hypothesized model by Takai et al. [7]](https://thumb-us.123doks.com/thumbv2/123dok_us/25730.1992/20.612.131.527.233.427/figure-hypothesized-model-by-takai-et-al.webp)