3
The early years workforce: A fragmented
picture
________________________________________________________
Contents
Introduction ……….………… 3
A note on terminology ………..……….……….… 5
An overview of English early years provision………..…….….… 7
The Early Years Workforce ………..……… 11
Children receiving some funded early education ………..……. 24
Conclusions ……… 28
__________________________________________________________________________________
Introduction
Eight months ago, we set out to gather administrative data about early years providers and staff. Our aim was to create a detailed picture of the workforce demographics, pay and qualification levels and to understand how these characteristics varied across school-based settings, private, voluntary and independent providers (PVIs) and childminders. In addition, we viewed this project as a
stocktake of the information that is readily available from official sources and as a base from which to formulate new research questions that require additional data or analysis. Due to many gaps and inconsistencies in the official data reviewed here, the final product is quite different from what we had envisioned. This paper provides an overview of the early years provision in England, of data about the workforce and, finally, of the implications for children in funded provision. Our findings show that:
Overall enrolment and funded provision has increased dramatically, particularly since the introduction of the two-year-old entitlement in 2014. However, the diversity of the early years market has been changing.1 For example, the number of children’s centres decreased by 55 per cent between 2009 and 2013, while the number of other group-based providers offering full day care increased by 27 per cent in the same time;2
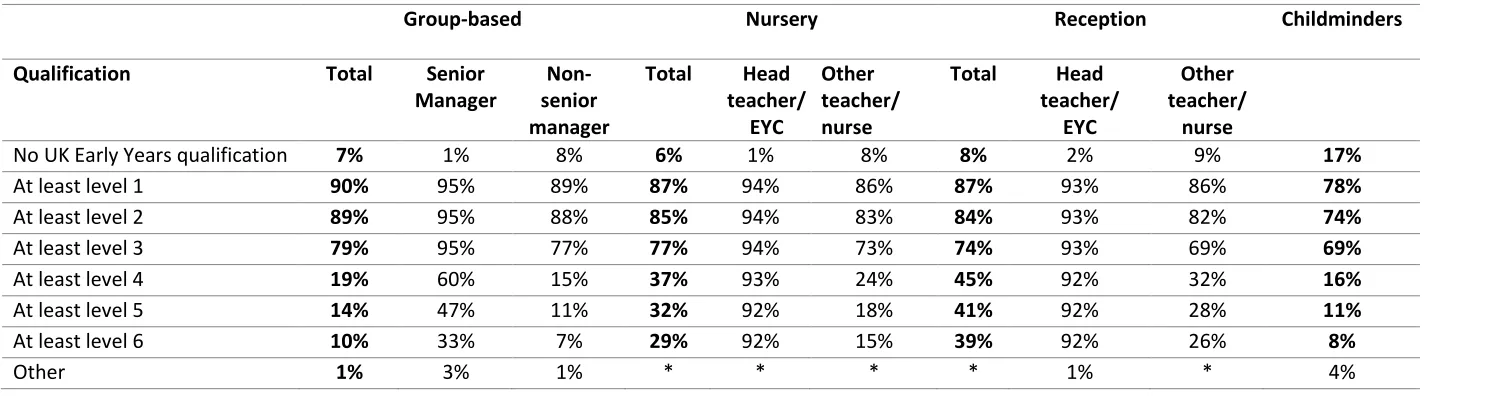
Seventy-nine per cent of group-based staff,77 per cent of nursery staff, 74 per cent of reception staff and 69 per cent of childminders have at least a level 3 early years
qualification.3 However, there is also an emerging downward trend in qualification levels. Survey data from the National Day Nursery Association (NDNA) suggests that the proportion of level 3 qualified staff in early years settings fell from 83 per cent in 2015 to 75 per cent
1 See section below for notes on terminology.
2 Analysis of data from Department for Education, 2014, ‘Childcare and Early Years Providers Survey 2013’,
https://www.gov.uk/government/statistics/childcare-and-early-years-providers-survey-2013
3 Department for Education, 2017, ‘Childcare and Early Years Providers Survey 2016’,
4 in 2016. A separate study carried out by the Professional Association for Childcare and Early Years (PACEY) reported an increase in the cost of level 3 courses from £250 in 2012 to £1,900 in 2015;4,5
Almost half of highly qualified staff (level 6 and more) are aged over 40, with 21 per cent aged over 50 and approaching retirement in the next 10 to 15 years. Findings around financial incentives and current enrolment levels in Early Years Teacher Training Courses in 2017 cast doubt on the capacity of the younger workforce to keep the proportion of graduates steady, let alone for it to increase. This potentially means that the early years workforce in the future could be even less qualified than today;6
Despite the increasing amount of evidence showing that provision needs to be of high quality to have a positive impact on children’s outcomes and that the workforce is key to high quality provision, the percentage of two-year-olds benefitting from the presence of a graduate teacher in the classroom has decreased slightly between 2014 to 2016 (from 45 to 44 per cent). However, that decrease has been particularly sharp in London and Yorkshire and the Humber, where the proportions fell respectively from 47 to 41 per cent and from 48 to 44 per cent;7,8,9
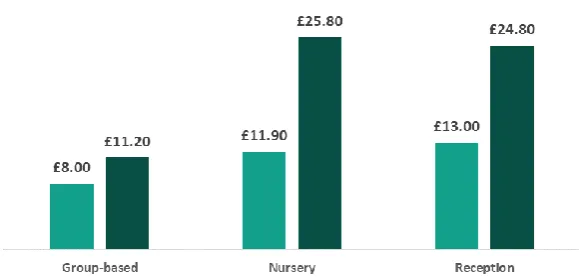
Working in school-based settings provides more financial incentives to staff to progress up the career ladder. The wage differential between senior and non-senior staff is higher in school-based settings than in group-based settings. Moreover, the mean hourly pay for senior staff in group-based settings (£11.20) is lower than the mean hourly pay received by non-senior staff in school-based setting (£11.90 and £13.00 respectively for nursery and reception teachers).10
A simple analysis of administrative data gave a fragmented picture. Early years data are scattered and incomplete at best and answers were elusive. Therefore, in the final section we will reflect on the difficulties encountered in carrying out this work.
4 National Day Nursery Association, 2016, ‘Early Years Workforce Survey: England 2016’. NDNA survey results
are slightly different from statistics available through administrative survey. However, trends have always been consistent with the latter.
5 Susanna Kalitowski, 2016 ‘Towards and Early Years Workforce Development Strategy for England’, PACEY, p.
4.
6 Nursery World, ‘Sector feels the strain after fall in new Level 3s’, 03 September 2017,
https://www.nurseryworld.co.uk/nursery-world/news/1162101/sector-feels-the-strain-after-fall-in-new-level-3s; Data from a survey by Save the Children in collaboration with Nursery World. Initial findings can be found at https://www.nurseryworld.co.uk/nursery-world/news/1163363/exclusive-survey-reveals-barriers-to-training-and-employing-eyts; Department for Education, 2017, ‘Childcare and Early Years Providers Survey 2016’, https://www.gov.uk/government/statistics/childcare-and-early-years-providers-survey-2016
7 Cunha, F., Heckman, J. J., Lochner, L., and Masterov, D. V. (2006) ‘Interpreting the evidence on life cycle skill
formation’, Handbook of the Economics of Education, 1, pp. 697-812; Felfe, C. and Lalive, R. (2014) Does Early Child Care Help or Hinder Child Development, IZA Discussion Paper, No. 8484.
8 OECD, 2012, ‘Research Brief: Qualifications, Education and Professional Development Matter’,
http://www.oecd.org/education/school/49322232.pdf; Nutbrown Review, ‘Foundations for Quality. The independent review of early education and childcare qualifications. Final Report’, June 2012.
9 By ‘children benefitting from the presence of a graduate teacher’ we mean the number and percentage of
children who benefit from funded provision at providers with staff with Qualified Teacher Status, Early Years Teacher Status or Early Years Professional Status, in line with the data sets ‘Provision for children under 5 years of age in England’. We will discuss these data in more detail later in the text. Department for Education, 2017, ‘Provision for children under 5 years of age in England, 2017’,
https://www.gov.uk/government/statistics/education-provision-children-under-5-years-of-age-january-2017
10 Department for Education, 2017, ‘Childcare and Early Years Providers Survey 2016’,
5
A note on terminology
The two main administrative datasets used in this work are the Childcare and Early Years Providers Survey and the Provision for children under 5 years of age in England. These datasets use a slightly different classification or grouping of providers. For clarity’s sake, we will keep providers grouped according to the original source insofar as it fits the needs of our analysis. For example, when using data from the 2016 Childcare and Early Years Providers Survey, the most commonly used categories will be ‘group-based’, ‘school-based’ and ‘childminders’. Below are the definitions of the different types of providers used in the 2016 Childcare and Early Years Providers Survey.
Childminders* All childminders included in the survey are registered with Ofsted.
Group-based providers Childcare providers operating in non-domestic premises (selected from the Ofsted register of non-domestic childcare providers).
School-based providers: Maintained nursery schools
Sampled from the School Census, these are Local Authority schools that provide education and other services to children under 5 and their families. In this report, unless stated otherwise, maintained nursery schools are included with the analysis of the nursery provisions (see below), together described as school-based nurseries.
School-based providers Primary schools with nurseries
School nurseries provide for children before they start compulsory education.
School-based providers Primary schools with reception provision
Reception is the first year of infant school in England and Wales providing early education for pupils typically aged between 4 and 5. In line with legal requirements, nearly all school-based providers offered reception provisions (98%), the only exception being maintained nursery schools. The sample includes independent as well as maintained settings.
The way providers are grouped has changed across time, making some comparisons not feasible. In addition, the questionnaire was fully redesigned for the 2016 survey to reflect changes in the childcare market. Therefore, both the sample design and sample groups have changed since the 2013 survey and results for 2016 are not comparable with previous waves of the research.
Below, we provide an overview of how the different categories of providers have changed.
Terminology up to 2011 Terminology in 2013 Terminology in 2016
Childcare providers:
Full day care (including full day care in children’s centres) + sessional + after school + holiday + childminders
Group-based providers: Full day care (including full day care in children’s centres) + sessional + after school + holiday
Group-based providers: Full day care (including full day care in children’s centres) + sessional
Group-based providers: Full day care not disaggregated except for some questions + sessional (fixed and flexible) + before school + after school Out of school providers:
After school + holiday
Out of school providers: Before school + after school + holiday
6 Early years providers:
Maintained nursery schools + primary schools with reception classes only + primary schools with nursery and reception classes (kept aggregated)
School-based providers: Maintained nursery schools + primary schools with reception classes only + primary schools with nursery and reception classes (kept aggregated)
School-based providers: Maintained nursery schools + primary schools with reception classes only + primary schools with nursery and reception classes (disaggregation available). Before and after school operated solely by the school. Independent schools are included as well.
n/a (included in childcare providers category)
Childminders Childminders
Childminders + Assistants
In Provision for children under 5 years of age in England, data are disaggregated differently. Unless otherwise stated, in our analysis we will group them in the following way:
Private, Voluntary and Independent (PVIs) and others
PVI settings, some Local Authority day nurseries, childminder networks, other providers registered to receive funding and special schools
State-funded Maintained nursery schools, nursery and infant classes in primary schools, state-funded primary and secondary schools, primary converter academies, primary sponsor-led academies and primary free schools, maintained secondary schools, secondary converter academies, secondary
sponsor-led academies, secondary free schools and city technology colleges.
Childminders* Childminders reporting to the Early Years Census
*An important aspect related to childminders data is that prior to 2015, childminders who were part of a childminder network were reported in the Early Years Census with the childminder network being the provider. From 2015 “independent childminders who are registered with Ofsted and have one or more funded children were again required to submit a childminder level return in the early years census. If the return was made by a childminder network, then an individual return was required for each childminder within the network. This represents a change from 2014 onwards where data could be reported as: 1. an individual childminder return, or 2. a single data return covering all childminders who were part of a childminder network. Whilst this will not affect figures about where a child is receiving their funded education, it will affect figures reporting on the split of providers as the number of childminder ‘providers’ have increased”.11
11 Department for Education, 2017, ‘Education provision: children under 5 years of age, January 2017’, p. 4.
7
An overview of English early years provision
According to the latest Childcare and Early Years Providers Survey (CEYPS), in spring 2016 there were 25,500 group-based providers, 17,925 school-based providers (8,200 offering reception provision but not nursery; 9,300 offering both nursery and reception provision and 425 maintained nursery schools) and 46,600 registered childminders working in England offering a total of 3,092,100 Ofsted registered childcare places. Registered places were distributed as follows:
38.8 per cent (1,198,700 places) in group-based provision;
52.6 per cent (1,625,800 places) in school-based provision;
8.7 per cent (267,600 places) with childminders.
These percentages hide the fact that group-based providers play the most prominent role in full time, year-round early years provision. Even though the figures above show that 53 per cent of the provision is in school-based settings, quite a lot of it is reception children who have turned four rather than children who have not started school yet. In fact, out of the total school-based
registered places, 11.4 per cent (352,600) are in nurseries, 23.7 per cent (734,000) in reception, 10.6 per cent (327,000) in school-based before school and 6.9 per cent (212,200) in school-based after school programmes.12
Most of the data provided by the 2016 CEYPS cannot be fully compared to previous years’ data because of some significant changes in the definition and grouping of types of care implemented across the 2011, 2013 and 2016 surveys.13 Nevertheless, we can gain some insights from looking into trends that were emerging beforehand. For example:
from 2006 to 2013, the number of group-based providers offering full day care increased by 41 per cent, while the number of those offering sessional care decreased by 27 per cent;
after increasing from 700 to 1,000 between 2006 and 2009, the number of children's centres offering full day care decreased by 55 per cent (from 1000 to 450 centres) between 2009 and 2013;
the number of registered childminders fell from 71,500 in 2006 to 55,900 in 2016, a 22 per cent decrease.14
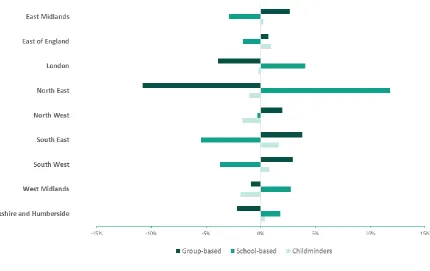
Focusing on the most recent data, we looked at the regional distribution of registered places. In Figure 1, we show this information in terms of each region’s difference in percentage points from the national average in 2016.
12 Department for Education, 2017, ‘Childcare and Early Years Providers Survey 2016’,
https://www.gov.uk/government/statistics/childcare-and-early-years-providers-survey-2016
13 See ‘notes on terminology’ section for details.
14 Analysis of data from Department for Education, 2014, ‘Childcare and Early Years Providers Surveys 2013’
8 Figure 1: Registered places across providers by region
A few differences stand out:
group-based registered places are more prominent in the South West, South East, North West and East Midlands, while they are much less so in the North East and London area, where school-based provision dominates;
childminders are more prominent in the South East, East of England and South West and less so in the West Midlands, North West and North East.15
Early care providers and the free entitlement
The offer for two-year-olds has increased significantly since the pilot programme launched in 2006. The main change came into effect with the extension of the legal entitlement to 15 hours of free early education for all disadvantaged two-year-olds in 2013. This is reflected in the data, which show a sudden increase in the number of two-year-olds benefitting from funded early education between 2014 and 2015, with only a moderate increase in the following years.
A big part of the entitlement expansion was delivered by private, voluntary and independent settings (PVIs). In fact, the number of PVIs offering funded early education to two-year-olds
increased from 12,220 in 2014 to 16,110 in 2016. Only last year did the number decrease slightly to 15,930.16 Looking at the percentage distribution of providers offering the entitlement, we notice that PVIs have lost ground to school-based providers, albeit by a small margin. This could be because, three years after the expansion of the entitlement, school-based providers have had enough time to adjust their supply.17
15 Analysis of data from Department for Education, 2017, ‘Childcare and Early Years Providers Survey 2016’,
https://www.gov.uk/government/statistics/childcare-and-early-years-providers-survey-2016
16 Department for Education, 2017, ‘Provision for children under 5 years of age in England, 2017’,
https://www.gov.uk/government/statistics/education-provision-children-under-5-years-of-age-january-2017
Incidentally, the number of two-year-olds benefitting from funded early education has decreased as well in 2017.
17 The technical report accompanying the data from ‘Provision for children under 5 years of age in England,
9 Figure 2: Change in the proportion of providers delivering the two-year-old entitlement
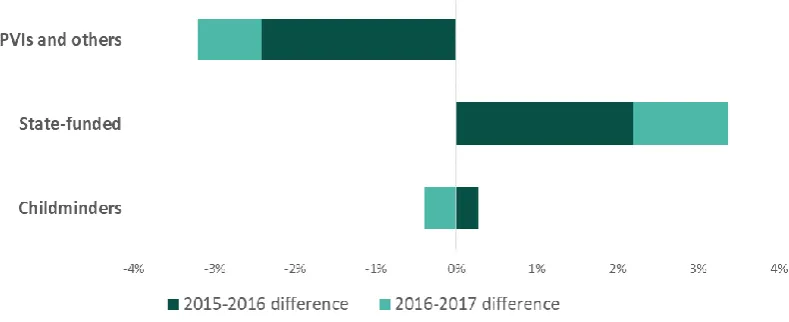
The provision for three- and four- year-olds is more stable. In absolute terms, there is a general increase in the number of both school-based providers and PVIs, with the proportional distribution instead showing a move towards childminders.
Figure 3: Change in the proportion of providers in delivering the three- and four-year-old entitlement
An alternative way to look at these data is to compare how the role of various providers differs between the two-year-old and the three- and four- year-old free entitlement. As we might expect, there is a move towards greater provision by state-funded primary and secondary schools and away from PVIs as children approach reception year.18
two factors: “1. On 26 May 2015 the Small Business, Enterprise and Employment Act that came into force. The Act removed the need for schools to register early years provision for 2-year-olds and above separately with Ofsted, where that provision is run by the school and directly managed by the governing body. Therefore, from 26 May 2015, schools that already directly provided childcare for children aged 2 and over would not need to register separately with Ofsted, but register these children attending the early years provision on the school roll. These children would be returned to the Department via the school census, whereas previously they would have been returned on the early years census. 2. In our early years census guide to local authorities we provided clearer guidance as whether children should be returned on the early years census or the school census.” Department for Education, 2017, ‘Provision for children under five years of age in England: January 2017. Technical document’,
https://www.gov.uk/government/uploads/system/uploads/attachment_data/file/622871/SFR29_2017_Techni calDocument.pdf
18 Department for Education, 2017, ‘Provision for children under 5 years of age in England, 2017’,
[image:9.595.119.525.340.493.2]10 Figure 4: Role of different providers in entitlement provision for different age groups in 2017
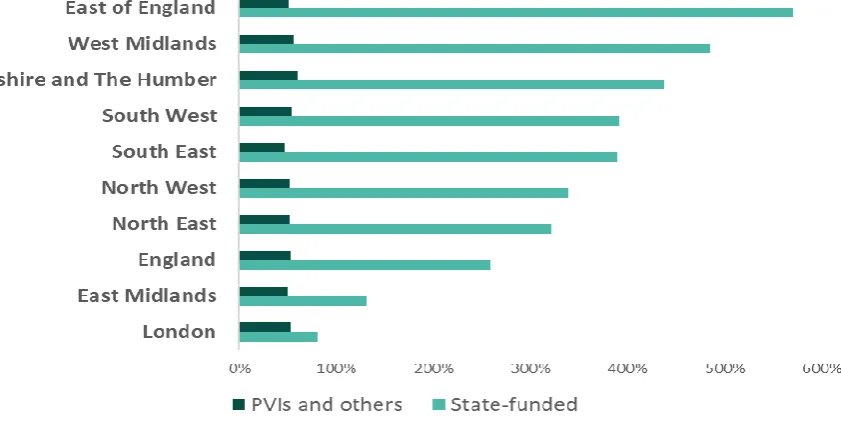
Finally, regional differences are explored below.19
Figure 5: Percentage change in providers delivering funded early education to two-year-olds, by region (2014-2017)
The percentage increase in PVIs and others offering funded early education to two-year-olds was similar across regions, while funded provision in state-funded settings has increased more in some regions, including the East of England, the West Midlands and Yorkshire and the Humber, and much less in others, including London and the East Midlands. A plausible explanation for the slower growth experienced in London and the East Midlands is that these two areas already had a much higher
19 Special schools were excluded from this analysis. The ‘PVI and others’ category includes some Local
Authority day nurseries, childminder networks and other providers registered to receive funding. The ‘funded’ category includes maintained nursery schools, nursery and infant classes in primary schools, state-funded secondary schools, primary converter academies, primary sponsor-led academies and primary free schools. Department for Education, 2014, ‘Provision for children under 5 years of age in England, 2014’, and Department for Education, 2017, ‘Provision for children under 5 years of age in England, 2017’,
[image:10.595.103.524.363.575.2]11 number of state-funded providers to begin with. In the case of London, this extra provision could have been available because of an already strong demand from working parents.
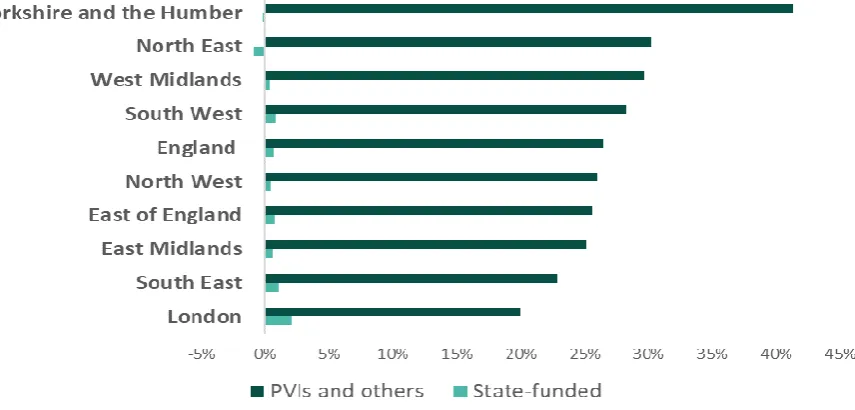
Figure 6: Percentage change in providers delivering funded early education to three- and four-year-olds, by region (2014-2017)
The magnitude of the changes for three- and four-year-olds is much smaller because their entitlement did not change as dramatically in the 2014-2017 span, hence Figures 5 and 6 use a different scale. The expansion was mainly driven by the PVI sector, particularly in Yorkshire and the Humber. State-funded provision increased the most in London, while slightly decreasing in Yorkshire and the Humber and the North East.
Differences across providers can be presented also in terms of staff. In the following section we will explore data about demographic characteristics, working conditions in different providers and qualification levels.
The Early Years Workforce
We have a general sense of how the early years workforce is faring. The historical divide between childcare and education and the feminisation of childcare work have contributed to the
development of a workforce that is less skilled, lower paid and has lower status than other workers across the education system.20 On average across OECD countries, around 97 per cent of teachers in pre-primary education are women.21 The average drops to 43 per cent in tertiary education. The UK has similar proportions, with figures at 97 per cent and 44 per cent respectively. The level of
qualification required to be a pre-primary teacher has increased over time, but wages have not
20 Gambaro, 2012, ‘Why are childcare workers low paid? An analysis of pay in the UK childcare sector,
1994-2008’, Thesis submitted to the Department of Social Policy of the London School of Economics for the degree of Doctor of Philosophy, London, February 2012.
21 In the OECD indicators on Early Childhood Education and Care (ECEC), “formal” ECEC settings can be split
12
followed the same trend. On average, pre-primary teachers in England earn only 83 per cent of the average salary of tertiary-educated workers aged 25-64.22
The sector also reports increasing recruitment and retention problems.23 The latest official data reported turnover rates of 14 per cent for group-based providers, 8 per cent for nursery provision in school-based settings and 9 per cent for reception provision in 2016.24 These percentages have been steadily increasing over the last few years, in line with a similar trend affecting other phases of the education system. Moreover, averages mask the diversity in turnover rates among staff at different qualification levels. The 2016 National Day Nursery Association (NDNA) Early Years Workforce Survey found that turnover rates had increased from 14 per cent in 2015 to 18 per cent in 2016, with level 3 qualified staff leaving at a rate of 21 per cent, level 2 at 19 per cent, unqualified staff at 18 per cent and staff qualified at a level higher than 3 at 12 per cent. Estimates from the NDNA survey data are slightly different from the CEYP survey data because of different sample size and
composition.25 However, they have been in line with government estimates in the past. In the absence of detailed administrative data on turnover rates by qualification level and while waiting for the next CEYP results to be published, NDNA figures can at least give us a sense of the situation and provide an example of how heterogeneous the early years workforce is. The goal of this section is to go beyond averages and to capture diversity as much as we can within the limitations of the data.
According to the latest Childcare and Early Years Providers Survey, in 2016 there was an estimate of 452,100 paid staff in the early years sector. For the first time that year we also had data on
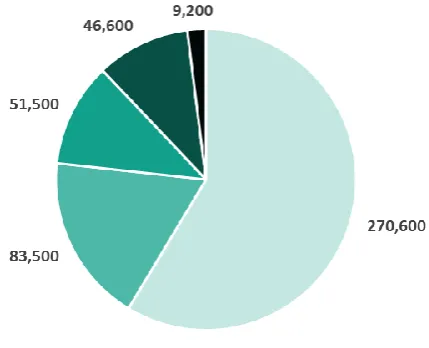
[image:12.595.165.380.408.582.2]childminders’ assistants. One in five childminders worked with other registered childminders or assistants: 9 per cent had one assistant while 5 per cent had two assistants, for a total of 9,200 childminders’ assistants.26
Figure 7: Distribution of paid staff across providers, 2016
22 OECD, 2017, ‘Starting Strong 2017: Key OECD indicators on early childhood education and care’. 23 National Day Nursery Association, 2016, ‘Early Years Workforce Survey: England 2016’.
24 Department for Education, 2017, ‘Childcare and Early Years Providers Survey 2016’.
https://www.gov.uk/government/statistics/childcare-and-early-years-providers-survey-2016
25 The 2016 survey received 278 responses from employers and 385 responses from practitioners. National
Day Nursery Association, 2016, ‘Early Years Workforce Survey: England 2016’.
26 Department for Education, 2017, ‘Childcare and Early Years Providers Survey 2016’,
13 Statistics about staff available through the CEYPS cannot be reliably compared across time due to the changes it underwent over time. Some clear trends were forming from 2008 to 2013, before the data collection was altered, such as:
paid staff in group-based full day care increased by 26 per cent; unpaid staff in group-based full day care increased by 60 per cent; paid staff in full day care in children's centres decreased by 50 per cent; unpaid staff in full day care in children’s centres decreased by 32 per cent; paid staff in school-based provision increased by 22 per cent;
unpaid staff in school-based provision increased by 6 per cent.27
[image:13.595.77.481.317.570.2]We have not found a definition of “unpaid staff” in administrative data, except for the clarification that the category includes both volunteers and student placements. The increasing reliance of the sector on these staff raises questions about how they are deployed, their skills and qualifications, and their effect on the quality of provision for children. Additionally, it is not clear what impact they have on the business and cost models of providers, or on what is feasible for other providers without access to this unpaid labour.
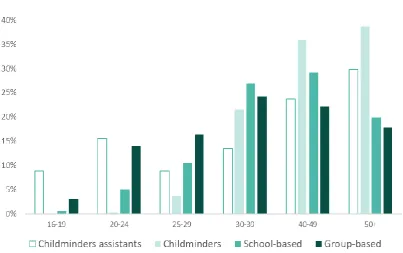
Figure 8: Age profile of early years paid staff across providers
A high proportion of staff aged below 25 work in group-based setting or as childminders’ assistants. Figure 8 suggests that the field could soon be losing a substantial number of staff to retirement (especially childminders) without enough younger cohorts entering the sector to keep up with additional entitlements and demand from parents. An important caveat to keep in mind, however, is that the available data on age do not include unpaid staff (volunteers/student placements), who play an important role in group-based provision.28
27 Analysis of 2008-2013 Childcare and Early Years Providers Survey. Department for Education, ‘Childcare and
Early Years Providers Survey’, https://www.gov.uk/government/collections/statistics-childcare-and-early-years
28 Department for Education, 2017, ‘Childcare and Early Years Providers Survey 2016’,
14 Figure 9: Age profile of group-based staff by qualification level
The large proportion of staff aged over 40 matched with information from Figure 9 is even more troublesome. Figure 9 shows a high proportion of group-based staff qualified at level 6 or above in the over 40 age range, with not enough level-6-qualified staff in younger generations. This
potentially means that the early years workforce in the future could be even less qualified than today. The high percentage of level 4 and 5 staff in the 30-39 age range could be encouraging, provided staff decide to seek further qualification and reach graduate status.29 However, as we will discuss later, this does not seem to be the prevalent scenario at the moment.
Another distinctive characteristic of the early years workforce is that it is generally low paid. Once again, averages mask the wide variation that exists within the sector. The mean hourly pay is £8.30 for staff working in group-based providers, £14.40 for nursery staff in school-based providers and £15.10 for reception staff. If we disaggregate further, we notice more differences, as Figure 10 illustrates.30
Figure 10: Hourly rates
29 Analysis of Department for Education, 2017, ‘Childcare and Early Years Providers Survey 2016’,
https://www.gov.uk/government/statistics/childcare-and-early-years-providers-survey-2016
30 Department for Education, 2017, ‘Childcare and Early Years Providers Survey 2016’,
[image:14.595.79.369.529.668.2]15 Unsurprisingly, staff in senior/management positions are paid more than staff in non-senior roles. However, this gap is much wider in school-based reception and nursery settings than in group-based settings. This could be due to the fact that many group-based providers are small businesses without the scale to have many layers of seniority, while schools are often much larger. Even more striking is that the mean hourly pay for senior staff in group-based settings is lower than the mean hourly pay of non-senior staff in school-based settings. While this can arguably be justified by the size of the organisation concerned, it still points to a lack of financial incentive to progress up the career ladder within group-based settings as well as to a general lack of incentive for qualified staff to stay in group-based provision as school-based settings pay more at any level.31 Focusing on PVIs’ staff, a recent survey found that, on average, staff qualified to level 3 earn 15 per cent more than staff qualified to level 2 or below, while the financial incentive to pursue a graduate qualification (level 6 versus level 4 and 5) is only a 10 per cent pay rise.32 For comparison, the average graduate premium in the UK, i.e. the wage difference between graduates and school-leavers, is estimated to be around 35 per cent.33
From 1 April 2016, the government introduced a new mandatory National Living Wage (NLW) for workers aged 25 or above of £7.20 per hour. At the time of the latest CEYPS, 10 per cent of group-based staff aged 25 or over received hourly pay below the NLW (compared to only 2 and 1 per cent for nursery and reception staff).34 Further increases in both the NLW and the National Minimum Wage (NMW) are scheduled to enter into effect from 1 April 2018, culminating in a NLW of £9 an hour by 2020.35
The 2016 CEYPS reported that 73 per cent of reported costs incurred by group-based providers were for staff, with equivalent figures of 80 per cent for nurseries and 76 per cent for reception classes. The wage increases will drive staff costs up significantly. A survey conducted in 2015 by NDNA estimated that payrolls would be pushed up by 10.7 per cent due to the first increase in the NLW 36 and would increase by 34 per cent by 2020. However, increases could be even higher because
31 We cannot speak of an average hourly pay for childminders as this is classified as their income, but we can
look at childminders’ assistants. In 2016 three-quarters of them earned below £7.20 per hour and many of the other third working on a non-contractual basis earned on average £5.90 per hour. Department for Education, 2017, ‘Childcare and Early Years Providers Survey 2016’, https://www.gov.uk/government/statistics/childcare-and-early-years-providers-survey-2016
32 The breakdown figures are £7.37 for level 2 or below; £8.46 for level 3; £9.70 for level 4 to 5; £10.68 for level
6 or above. Ceeda, 2017, ‘About Early Years: summer snapshot’,
http://www.aboutearlyyears.co.uk/media/1091/ceeda-aey-summer-2017-snapshot_issue-1.pdf
33 Blundell, R., Green, D., and Jin, W., 2016, ‘The puzzle of graduate wages’, Institute for Fiscal Studies, Briefing
Note BN185, https://www.ifs.org.uk/uploads/publications/bns/bn185.pdf
34 Figures exclude those saying ‘don’t know’. On 1 April 2017, the NLW increased to £7.50 and the report
estimated that 34 per cent of group-based staff aged 25 or over would be earning below £7.50 an hour at that point. Department for Education, 2017, ‘Survey of Childcare and Early Years Providers. England 2016. Research Report’, p. 55,
https://www.gov.uk/government/uploads/system/uploads/attachment_data/file/593965/SFR09_2017_Resea rch_Report.pdf
35 A recent report by the Low Pay Commission details the NLW and NMW increases as follow:
the NLW for employees aged 25 and over will rise from 7.50 to £7.83 (4.4 per cent)
the NMW for 21- to 24-year-olds from £7.05 to £7.38 (4.7 per cent)
the NMW for 18- to 20-year-olds from £5.60 to £5.90 (5.4 per cent)
the 16-17-year-old rate from £4.05 to £4.20 (3.7 per cent)
the rate for apprentices from £3.50 to £3.70 (5.7 per cent)
Low Pay Commission, 2017, ‘National Minimum Wage. Low Pay Commission Report 2017’,
https://www.gov.uk/government/publications/national-minimum-wage-low-pay-commission-report-2017. See also p. 59 for more details about the childcare sector.
36 And by another 1 per cent for pension auto-enrolment. Employees aged 22 years to state pension age,
16 employers might want and need to increase all staff wages to keep their pay differentials and
incentives for qualified staff or else they risk losing practitioners.37
Some providers risk being put out of business, or have already been, by these increased costs. For those providers remaining in business, increased costs are likely passed on to parents through higher fees. In general, without an increase in the funding rate these increases could put further strain on quality. Fifty-eight per cent of the NDNA survey respondents said they would look at recruiting younger and less qualified staff.38
Staffing costs are tightly related to child to staff ratios and should be considered together with staffing structures, including the use of unpaid staff and apprentices. In 2016, there were 270,600 paid members of staff in group-based providers (with an average of 11 per setting), 83,500 paid members of staff in reception provisions and 51,500 paid members of staff in nursery provisions (with an average of five per setting in each of these). Within the nursery provision, there were 7,000 paid members of staff in maintained nursery schools (with an average of 17 per setting). There were fewer staff on average at independent schools (four), which tended to have fewer children attending reception than non-independent schools (28 versus 43). A large part of the difference in average number of staff by provider type is explained by the age of children attending and the corresponding child to staff ratios required. On average, nurseries had two children per setting aged two or
younger; group-based settings offering full day provision averaged 16 children aged two or younger; and those who offered only sessional provision averaged six children aged two or younger.39
Providers usually comply with the required child to staff ratios.40 The required ratio when working with children under two is 3:1; 97 per cent of group-based providers and 94.7 per cent of school-based providers complied with this ratio in 2016. For children aged two, the mandated ratio is 4:1; 96.8 per cent of group-based providers and 93.5 per cent of school-based providers comply with this ratio. For children aged three and four, the ratio is 1:13 if there is a staff member with Qualified Teacher Status (QTS), Early Years Provider Status (EYPS), Early Years Teacher Status (EYTS) or other level 6 qualification, otherwise it is 8:1; over 97.4 per cent of group-based providers and 50.2 per cent of the school-based providers comply with the 8:1 ratio. We could not calculate the exact proportion of providers operating at the 13:1 ratio allowed by the presence of a graduate teacher because the highest ratio coded in the CEYPS data is “10:1 or more”. Nevertheless, we could identify a clear difference between group-based and school-based settings that points to a much wider availability of a graduate teacher in the latter. In fact, 98.6 per cent of group-based settings operated at a maximum of 8:1 ratio and only 1 per cent at a ratio of 10:1 or more. On the other hand, 50 per cent of school-based settings operated at a maximum of 8:1 ratio, with 32 per cent operating at a ratio of 10:1 or higher.
37 Yet the report shows that childcare occupations are among those where differentials have narrowed the
most. Low Pay Commission, 2017, ‘National Minimum Wage. Low Pay Commission Report 2017’, p. 77,
https://www.gov.uk/government/publications/national-minimum-wage-low-pay-commission-report-2017
38 NDNA, 2015, ‘National Living Wage funding factor is vital ahead of 30 hour free childcare offer’, August 2015
Press Release,
http://www.ndna.org.uk/NDNA/News/Press_releases/2015_press_releases/National_Living_Wage_funding_f actor_is_vital_ahead_of_30_hour_free_childcare_offer_.aspx
39 Figures exclude those saying ‘don’t know’. Department for Education, 2017, ‘Survey of Childcare and Early
Years Providers. England 2016. Research Report’, p. 55.
https://www.gov.uk/government/uploads/system/uploads/attachment_data/file/593965/SFR09_2017_Resea rch_Report.pdf
40The requirements are more complex than what is just outlined above. The full set of requirements can be
found at Department for Education, 2017, ‘Statutory framework for the early years foundation stage. Setting the standards for learning, development and care for children birth to five, p. 23-24,
17 The data also show an interesting story about how providers approach staffing ratios. When looking at the percentage of providers complying with the required child to staff ratios, we also checked for the percentage of respondents who reported operating well below this ratio. For example, in case of children under two, we calculated the cumulative percentage of providers operating at a ratio of “1.00 : 1 or less” and “1.01 : 1 to 2.00 : 1” (Figure 11).
Figure 11: Mean child to staff ratio and providers operating below ratio in 2016
Group-based settings School-based settings
Age of the children Mean child to
staff ratio
% of providers operating well below ratio
Mean child to staff ratio
% of providers operating well below ratio
Under 2 2.9 5.7% 3.02 2.6%
Aged 2 3.8 12.5% 4.02 13.6%
Aged 3 and 4 7.1 29.7% 8.98 27.6%
We found that a very small percentage of providers operated below ratio with children aged two and under. The proportion reaches almost 30 per cent among providers working with older children, but this could be due to three- and four-year-olds often being in the same classroom with two-year-olds, therefore making complying with ratios impractical. A final point to keep in mind is that there is a limit to how “flexible” staffing can be before jeopardising compliance with ratios, especially for providers without a graduate in the setting. An employee that is sick, on annual leave or who resigns (not unlikely given the high turnover rate in the sector) can push a provider suddenly out of ratio.
Finally, in connection with ratios and staffing structures, we looked at data related to other types of staff to gauge how heavily providers rely on temporary staff, unpaid staff and apprentices. At the beginning of this section, we presented data that showed a clear trend towards an increase in the percentage of unpaid staff, particularly in full day care settings (where unpaid staff increased by 60 per cent between 2008 and 2013). Figure 12 shows a generally high reliance on temporary staff across all types of providers and the relatively high reliance on unpaid volunteers (including placement students) in nursery and reception classes.41
Figure 12: Percentage of staff who are temporary staff member, apprentices or unpaid volunteers by type of setting
41 Department for Education, 2017, ‘Survey of Childcare and Early Years Providers. England 2016. Research
Report’,
[image:17.595.76.416.502.698.2]18 These figures are in line with the data from the 2013 Childcare and Early Years Providers survey. Unfortunately, more detailed data about temporary staff, apprentices and unpaid
volunteers/student placements are not readily available through administrative data.
Staff qualifications
Staff qualifications have been subject to much scrutiny and review in the past few years for two main reasons: first, because the level of qualification determines whether a staff counts in the child to staff ratio; second, because research has shown the importance of a qualified workforce for high quality provision.42 The Department for Education defines the qualifications that staff must hold to
count in the child to staff ratios. The key points are the following:
if a person holds a level 2 qualification that meets the level 2 full and relevant criteria, they can be counted towards the ratios at level 2;
if a person holds a qualification at level 3, 4, 5, 6 or 7 that meets the level 3 full and relevant criteria, they can be counted towards the ratios at level 3.
Depending on whether the qualification was started before or after 1 September 2014, staff may also need prescribed level 2 literacy and numeracy qualifications.43 Staff count towards the ratios at level 3 or 6 if they have been awarded qualified teacher status (QTS), early years teacher status (EYTS) or early years professional status (EYPS) without needing separate level 2 literacy and numeracy qualifications (see below for further explanation of QTS, EYTS and EYPS).
Once again, we cannot obtain complete time series for group-based and school-based providers using the CEYPS data (while we can for childminders) but the general level of qualification for full day group-based and school-based paid staff improved from 2008 to 2013. Also, childminders’ level of qualifications has improved over time, with the proportion holding no qualification decreasing from 34 per cent in 2008 to 17 per cent in 2016, those holding at least a level 3 qualification increasing from 44 per cent to 69 per cent and those holding at least a level 6 increasing from 3 per cent to 8 per cent.44
Below we provide a snapshot of the highest level of qualification achieved by paid staff in different types of provision in 2016, the most recent data available.
42 OECD, 2012, ‘Research Brief: Qualifications, Education and Professional Development Matter’,
http://www.oecd.org/education/school/49322232.pdf
43 Department for Education, 2014, ‘Guidance. Check early years qualifications’, last updated 19 December
2017, https://www.gov.uk/guidance/early-years-qualifications-finder
44 Analysis of Department for Education, ‘Childcare and Early Years Providers Survey 2008-2013’,
19 Figure 13: Highest level of qualification achieved by paid staff in 2016
Group-based Nursery
Reception Childminders
Qualification Total Senior Manager
Non-senior manager
Total Head teacher/
EYC
Other teacher/ nurse
Total Head teacher/
EYC
Other teacher/
nurse
No UK Early Years qualification 7% 1% 8% 6% 1% 8% 8% 2% 9% 17%
At least level 1 90% 95% 89% 87% 94% 86% 87% 93% 86% 78%
At least level 2 89% 95% 88% 85% 94% 83% 84% 93% 82% 74%
At least level 3 79% 95% 77% 77% 94% 73% 74% 93% 69% 69%
At least level 4 19% 60% 15% 37% 93% 24% 45% 92% 32% 16%
At least level 5 14% 47% 11% 32% 92% 18% 41% 92% 28% 11%
At least level 6 10% 33% 7% 29% 92% 15% 39% 92% 26% 8%
20 Figure 13 shows that 79 per cent of group-based staff, 77 per cent of nursery staff, 74 per cent of reception staff and 69 per cent of childminders have at least a level 3 early years qualification. Staff in school-based providers are more likely to be highly qualified than those in group-based providers or childminders – this is explicitly regulated, as schools are required to use teachers with QTS. In fact, 39 per cent of staff in reception and 29 per cent of staff in nursery provisions are qualified to at least level 6, with the figures for group-based providers and childminders being respectively 10 per cent and 8 per cent.45
The latest CEYPS results suggest a slight decrease in qualification levels. Other studies have also observed a negative trend developing in the past few years. The 2016 NDNA Early Years Workforce Survey, for example, found that for the first time in years qualification levels were decreasing, with 75 per cent of staff qualified at level 3 or above versus 83 per cent in 2015. Many of the responding providers reported serious difficulties in recruiting and retaining staff at level 3 and concerns that the training provided at level 2 was ‘not fit for purpose’.46
Following the 2012 Nutbrown Review of the workforce, some positive steps have been taken to provide more strength and coherence to the qualification system.47 Therefore, a look at other qualifications is useful to understand the career progression path available.
The Early Years Educator (EYE) qualification became available in September 2014. Since then, all level 3 qualifications must meet the EYE criteria. The Early Years Professional Status (EYPS) is a professional accreditation endorsed by the government for graduates who have demonstrated that they meet the requirements of the EYPS standards. The EYPS training programme was closed to new entrants in September 2013 and was replaced by the Early Years Teacher Status programme (EYTS), which focuses on high quality practice in the provision for children aged up to five. To gain EYTS it is necessary to complete an early years initial teacher training (EYITT) and there are several training routes available. Finally, the Qualified Teacher Status (QTS) is the recognised level of qualification for teachers in most state-maintained and special schools. Different routes can lead staff to achieve Qualified Teacher Status, including the successful completion of an approved course of initial teacher training.
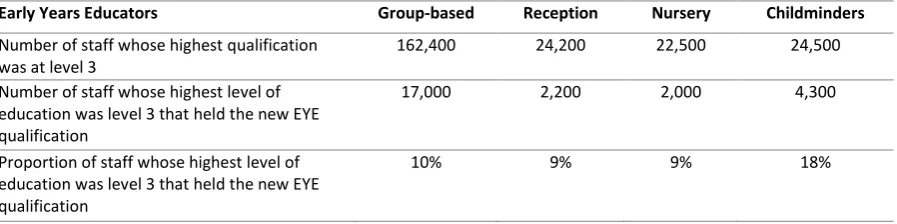
[image:20.595.73.522.518.630.2]There are some, albeit limited, administrative data that can give us a general sense of how widespread these qualifications are among staff working for different types of providers.
Figure 14: Level 3 and EYE by type of settings in 2016
Early Years Educators Group-based Reception Nursery Childminders
Number of staff whose highest qualification was at level 3
162,400 24,200 22,500 24,500
Number of staff whose highest level of education was level 3 that held the new EYE qualification
17,000 2,200 2,000 4,300
Proportion of staff whose highest level of education was level 3 that held the new EYE qualification
10% 9% 9% 18%
45 Department for Education, 2017, ‘Survey of Childcare and Early Years Providers. England 2016. Research
Report’,
https://www.gov.uk/government/uploads/system/uploads/attachment_data/file/593965/SFR09_2017_Resea rch_Report.pdf
46 These statistics do not include managers. We should again remember that the survey does not provide any
confidence intervals, but these trends are supported by other studies. National Day Nursery Association, 2016, ‘Early Years Workforce Survey: England 2016’.
47 However, not all the review’s recommendations were implemented. Nutbrown Review, 2012, ‘Foundations
21 The proportion of level 3 staff holding the EYE qualification is still very low across all providers. Possibly, this is due to the qualification being introduced only recently and applying exclusively to staff reaching level 3 after September 2014. An additional explanation could relate to the general decrease in the number of staff getting a level 3 qualification after the introduction of the GCSE requirements, which we will discuss next.48
[image:21.595.64.527.233.311.2]On 1 September 2014 the government introduced the requirement for level 3 EYE to hold GCSE English and maths A*-C to count in the level 3 child to staff ratio. This requirement raised strong concerns from the sector, with many providers complaining that recruitment was becoming even harder as a direct consequence. Because of the newly introduced policy, the 2016 CEYPS collected data on the percentage of staff holding the relevant qualification, which is presented in the table below.
Figure 15: Staff with GCSE English and maths at A*-C in 2016
Staff Level Group-based Nursery Reception Childminders
All staff 67% 76% 80% 62%
Level 2 or lower 48% 67% 64% 65%
Level 3 69% 76% 73% 58%
Level 4 or higher 81% 92% 96% 73%
On average, a lower percentage of staff in group-based providers hold the relevant GCSE
qualifications compared to staff employed in school-based settings. Only 48 per cent of staff at level 2 or lower in group-based setting complied with the requirements, meaning that fewer than one in two would have been able to work their way to a higher qualification. From 3 April 2017, following the objections, particularly at a time when the sector was preparing for the roll-out of the ‘free 30 hours entitlement’, the GCSE requirement was broadened to Level 2 qualifications, including Functional Skills. The reinstatement of functional skills as acceptable alternatives will need time to produce effects and recent data on the number of level 3 staff might not yet be reflective of it. Training providers reported a sharp increase in the number of apprentices signing up for level 3 EYE since the GCSE requirement was repealed.49 Nevertheless, the fall in level 3 qualified staff was so great that providers are still reporting recruitment difficulties.50
At the moment, we do not know if the data presented above will be collected in future rounds of the CEYPS, but it is still a useful gauge of the level of education of early years providers and of the potential barriers to a clear progression route and to the development of a workforce of graduates, as GCSE requirements are still in place to get to level 6. Figure 16 looks at qualifications levels among graduates.
Figure 16: Level 6 and QTS/EYPS/EYTS in 2016
Graduate Staff Group-based Reception Nursery Childminders
Number of staff whose highest qualification was at level 6
1,496 1,402 965 99
48 Nursery World, ‘Sector feels the strain after fall in new Level 3s’, 03 September 2017,
https://www.nurseryworld.co.uk/nursery-world/news/1162101/sector-feels-the-strain-after-fall-in-new-level-3s
49 Nursery World, ‘Trainers report Level 3 apprentice surge’, 27 May 2017,
https://www.nurseryworld.co.uk/nursery-world/news/1161289/trainers-report-level-3-apprentice-surge
50 In September 2017, Nursery World reported that between 2014 and 2016 the number of students finishing
[image:21.595.75.533.603.646.2]22
Proportion of staff with a qualification of at least level 6 who holds a QTS
25% 91% 73% 33%
Proportion of staff with a qualification of at least level 6 who holds an EYPS
30% 6% 7% 18%
Proportion of staff with a qualification of at least level 6 who holds a EYTS
17% 17% 15% 10%
Teachers in maintained schools are required to hold QTS, while early years teachers outside of the school-based system are not. Moreover, even though the entry requirements to QTS and EYTS programmes are the same, the two qualifications do not have the same value as people holding an EYTS cannot teach in maintained schools. Advocates have often remarked how this is a real issue for the early years workforce, with its low status and low pay perpetuated by this lack of equivalence.
Workforce quality in group-based provision
Government requirements do not allow much variation in qualifications among teachers working in school-based settings. On the other hand, staff qualifications in group-based settings vary widely. Provision Under 5 data allow us to look at the percentage of providers with staff with
QTS/EYTS/EYPS in the setting and with staff with QTS/EYTS/EYPS working directly with the children. We will investigate these data in more detail in the following section. Here it is useful to point out that the administrative data do not distinguish the exact number of staff with QTS or EYTS, yet, we know from other sources that only 595 students had enrolled on Early Years Initial Teacher Training (EYITT) courses in 2017. This is the third year in a row that the number has fallen and it amounts to only one-fourth of the government target.51 A survey conducted by Save the Children in
collaboration with Nursery World investigated more in depth the barriers that the EYTS has
encountered. Initial findings provide a troublesome picture, pointing to the willingness of providers to hire EYT but also their inability to do so because of the impact that higher salaries would have on their operational costs. On the employee side, despite recognising the value of completing the EYT accreditation to improve their skills, practitioners have expressed either a lack of interest in pursuing it or a lack of more concrete benefits after having obtained it. For example, they complained that EYTS did not improve their salary or career opportunities, nor did it increase their status. 52
On the topic of workforce qualifications and career progression, one final piece of information worth mentioning relates to the proportion of staff working towards a higher level of qualification.
Unfortunately, between 2008 and 2013 a negative trend emerged, with fewer staff working towards a qualification. For example, while 66 per cent of full day care staff were not working towards a qualification in 2008, the proportion increased to 77 per cent in 2013. The proportions for reception staff were respectively 83 per cent and 87 per cent. Data for 2016 are not available on a strictly comparable basis, but they seem consistent with the same trend.53
51 Nursery World, ‘Early Years Teacher trainees down for a third year’, 01 December 2017,
https://www.nurseryworld.co.uk/nursery-world/news/1162996/early-years-teacher-trainees-down-for-a-third-year
52 Initial findings can be found at
https://www.nurseryworld.co.uk/nursery-world/news/1163363/exclusive-survey-reveals-barriers-to-training-and-employing-eyts The first complaint is in line with what we have discussed above in terms of wage differentials between a level 4 or 5 qualification and a level 6, which in only about 10 per cent.
53 Analysis of Department for Education, 2014, ‘Childcare and Early Years Providers Survey 2013’ and
Department for Education, 2017, ‘Childcare and Early Years Providers Survey 2016’,
23 Figure 17: Proportion of staff not working towards a higher level of qualification in 2016
These data reinforce the downward trend in qualification levels shown above and paint a worrisome picture of the future workforce. It is not within the scope of this analysis to examine the factors impacting these trends and their respective weight. However, it is important to point out that among the most important are:
the increased cost of obtaining qualifications: a study carried out by the Professional Association for Childcare and Early Years (PACEY) reported an increase in the cost of level 3 courses from £250 in 2012 to £1,900 in 2015;54
the limited information and/or awareness of government support: EYITT courses are funded and the government offers financial support to providers if a staff member takes time out to train to be an EYT. However, the survey conducted by Save the Children and Nursery Word showed that providers and staff are not fully aware of these initiatives, with 58 per cent of managers employing an EYT unaware of government funding available;55
the variety of available continuing professional development (CPD) opportunities that do not necessarily translate into more choice: just as there are many routes into the teaching profession, there are many CPD opportunities available, but this sometimes can make it harder for the workforce to understand which opportunities are cost-effective;
the increased financial strain the sector is experiencing: accessing CPD is becoming harder for many providers for two concurrent reasons - the financial pressure due to the 30-hour entitlement, cost increases, and government funding rates is high, and Local Authorities’ (once the most popular sources of CPD) budget and role is decreasing, as they are now responsible for taking action only for those providers deemed to ‘need improvements’.
In the final section, we will look at what the implications are for children in funded provision.
Children receiving some funded early education
Before concluding this analysis, we will briefly shift our attention to the children receiving funded early education. Over the past two decades the proportion of children taking up early education
54 Susanna Kalitowski, ‘Towards an Early Years Workforce Development Strategy for England’, PACEY, January
2016, p. 4.
55 Initial findings at
24 places as a percentage of the population has steadily increased. In fact, the UK has one of the
[image:24.595.66.485.138.243.2]highest take up rates for three- and four-year-olds, which is almost universal.56 Figures are slightly lower when looking at the number of children taking up funded early education places, but generally on the increase for younger children and higher compared to many other countries, as Figure 18 shows.57
Figure 18: Number and percentage of children taking up some funded early education
Year 2-year-old 3- and 4-year olds 3-year olds 4-year olds
Number % Number % Number % Number %
2013 na na 1,283,500 95 625,310 93 658,190 98
2014 86,640 13 1,299,910 95 641,230 93 658,190 98
2015 157,040 58 1,321,900 95 na 93 na 97
2016 166,920 68 1,339,430 95 660,430 93 679,000 97
2017 163,250 71 1,317,660 95 632,33058 93 685,330 96
The two-year-old entitlement had a slow start. The figure provided in official statistics for 2014 reports the proportion of year-olds taking up the entitlement out of the total number of two-year-olds, while the 2015-2017 percentages are calculated out of total number of eligible two-year olds. Had the figures been reported on a comparable basis, the proportion of eligible children participating for 2014 would have been in the region of one third, indicating a very slow start of the delivery of the entitlement. The pace increased in following years, with the number of two-year-olds taking up some funded early education places increasing in total by over 88 per cent since the free entitlement has taken effect, from 86,640 in 2014 to 163,250 last year. In general, families of two-year-olds use PVIs to access their free entitlement, even though the proportion has decreased over time, as we saw in the first section. During the same time span, the number of three- and four-year-olds taking up some funded early education places has increased by just a little over 1 per cent, from 1,299,910 to 1,317,660. The proportion of three-year-olds has remained stable at 93 per cent over the last few years, while the proportion of four-year-olds has slightly varied but remained high, in the 96-98 per cent range.59
We know from the literature that it is not just any early years experience that matters. Early years provision needs to be of high quality to have a positive and lasting impact on children’s outcomes.60 Therefore, we turn our attention to the proportion of children who are benefitting from funded early education in PVI settings with better-qualified staff (i.e. those with QTS, EYPS or EYTS).61
56 The OECD report 100 per cent of three-year-olds enrolled in 2015, while the average for OECD countries is
73 per cent. OECD, 2017, ‘Education at a Glance 2017: OECD Indicators’, p. 2.
57 Analysis of Department for Education, 2014-2017, ‘Provision for children under 5 years of age in England’,
https://www.gov.uk/government/collections/statistics-childcare-and-early-years
58 According to provision data, this reflects a drop in birth rates in 2013. Department for Education, 2017,
‘Provision for children under 5 years of age in England, 2017’,
https://www.gov.uk/government/statistics/education-provision-children-under-5-years-of-age-january-2017
59 Department for Education, 2017, ‘Provision for children under 5 years of age in England, 2017’,
https://www.gov.uk/government/statistics/education-provision-children-under-5-years-of-age-january-2017
60 Cunha, F., Heckman, J. J., Lochner, L., and Masterov, D. V. (2006) ‘Interpreting the evidence on life cycle skill
formation’, Handbook of the Economics of Education, 1, pp. 697-812; Felfe, C. and Lalive, R. (2014) Does Early Child Care Help or Hinder Child Development, IZA Discussion Paper, No. 8484.
61 The remaning four charts were created by analysing 2014-2016 data from the ‘Provision for children under 5
years of age in England’. These data are not available for 2017.
25 Figure 19: Percentage of two-year-olds benefitting from staff with QTS, EYPS or EYTS
Figure 20: Percentage of three- and four-year-olds benefitting from staff with QTS, EYPS or EYTS
There seems to be a clear and contrasting trend for the different age groups, where the percentage of two-year-olds in settings or classrooms with better-qualified staff is slightly decreasing over time, while the percentage of three-and four-year-olds is increasing. A key fact, though, remains: less than half of eligible two-year-olds takes up their entitlement through a provider with staff with
QTS/EYTS/EYPS qualifications and while things seem to be better for three-and four-year-olds, they are not dramatically so.
[image:25.595.103.455.363.559.2]26 Figure 21: Changes in proportion of two-year-olds benefitting from funded early education at providers with better-qualified staff (percentage point difference between 2014 and 2016)
Figure 22: Changes in proportion of three- and four-year-olds benefitting from funded early education at providers with better-qualified staff (percentage point difference between 2014 and 2016)
[image:26.595.73.528.413.652.2]27 to the funding formula levelling their resources down. In absolute terms, London had a relatively high number of children benefitting from qualified staff and the number remains high even considering the proportional drop of the last few years. Nevertheless, this result still raises
important questions, such as: what is driving this decline? Are there other elements, aside from the change in the funding formula, that had an impact on the cost of provision? What is the impact, for example, of the high costs of living that push up rents and wages compared to other regions in England? And more importantly, are we dismantling some of our best provision by focusing on quantity rather than quality? These are all questions that beg further research.
Before concluding this section, we want to acknowledge that there is a significant piece of the picture missing in this analysis. We did not include any data specific to children with special education needs and disabilities (SEND). There are some data points available through administrative surveys, such as the percentage of children benefitting from special education provision and the number of special schools offering funded provision. These are important topics that we cover in other parts of our work. Interpretation of some of these data needs careful contextualisation. Therefore, we have decided to keep that analysis for a separate and more thoroughly researched piece dedicated to this issue, to be read in conjunction with this paper.
Conclusions
This analysis has attempted to provide a picture of the early years workforce by looking at changes over time and by pointing out similarities and differences among staff working at different providers and with children of different ages. There have been some positive developments for the workforce in the past few years, such as: the introduction of the NLW, the increase in the Minimum Living Wage and the pension auto-enrolment scheme, which have increased pay and benefits; the increased qualification levels of childminders; and the government commitment to provide a long-term vision for workforce development through the Workforce Strategy published in 2017. This progress seems even more remarkable given that it has taken place amid rising costs and a decline in local authority funding and support, above all in terms of training and CPD.62
On the other hand, some negative trends are continuing or emerging, which pose risks to the quality, capacity and sustainability of providers, such as (among others): pay is still lower than in other sectors of the economy and much lower in PVIs than in school-based settings; the workforce still suffers from low status in society and within the education system itself; and qualification levels are decreasing among staff working with two-year-olds in both group-based and school-based settings, and remain uneven for those working with three-to-four-year-olds. Following the recent expansion in entitlements, the chances of children having access to highly qualified staff may stretch thinner.
In the past few months, the government has tackled a few important action points. The consultation on level 2 qualifications was launched and level 3 apprenticeship standards were developed. In addition, while the consultation on QTS is not specific to the early years, a lack of clear career progression and of status parity with teachers at other stages of the education system makes the consultation on QTS relevant to the sector. These are actions that could have a significant impact on the early years workforce. It is crucial to monitor whether these efforts are well coordinated and developed within a clear long-term strategy.
Before concluding, we also want to remark on a few points related to the data available on the early years. Compared to other stages of the education system, it is much harder to have ‘good’ data for the early years. By ‘good’ data we mean data that are comparable across years and that can give a complete picture of the sector. This is true for early years data in general, but particularly for
28 workforce data. We have identified a few gaps in the data that made this analysis difficult and/or incomplete:
The Childcare and Early Years Providers Survey has undergone several changes across the years making it not possible to create a detailed profile of the workforce across time. The 2016 report mentions that the intention is for that year to be the new baseline. This is encouraging, as continuous changes hamper solid research outputs. In the meantime, we often only have a snapshot rather than a landscape.
Changes to the official data collection had the effect of obscuring some trends that have occurred over time. For example, while data for children’s centres were available in the Childcare and Early Years Providers Survey until 2013, since 2016 data on group-based provision are not disaggregated anymore, except for a few questions. As the debate over children’s centres resurfaces from time to time, it is unfortunate that official statistics do not allow more detailed investigation.
To make matters worse, the two most important administrative datasets - the Childcare and Early Years Providers Survey and the Provision for children under 5 years of age in England – group providers and provision in different ways, making quick data comparisons not
possible.
Very little information is available about temporary staff, volunteers/student placements and apprentices. This segment of the workforce is heavily used by some providers and is often at the frontline. We think it would be useful to have more detailed information about them, particularly about those who represent the ‘future’ of the early years workforce.
The kind of data we have discussed in this analysis is only available for settings and teachers working for providers offering some funded early education. If a provider does not offer funded education, we know practically nothing about it and its staff. That means that at this time, no existing data can provide a complete picture of childcare provision and the early years workforce in England. While we understand that the government is primarily accountable to, and for, those children receiving government funding, we think that as society we should be concerned with all children.