i
“EFFECTIVENESS OF A COMMUNITY BASED
PHYSICAL ACTIVITY PROGRAMME IN
CHANGING THE PHYSICAL ACTIVITY
PROFILE OF THE COMMUNITY – A
FEASIBILITY STUDY OF AN INTERVENTION”
DISSERTATION SUBMITTED IN PARTIAL FULFILMENT OF
THE REQUIREMENT OF THE TAMILNADU
DR.M.G.R.MEDICAL UNIVERSITY, CHENNAI, FOR THE
DEGREE OF MD BRANCH XV (COMMUNITY MEDICINE)
EXAMINATION TO BE HELD IN MAY 2018
THE TAMILNADU DR. M.G.R. MEDICAL UNIVERSITY
CHENNAI
ii
CERTIFICATE
This is to certify that “Effectiveness of a community based
physical activity programme in changing the physical activity
profile of the community – a feasibility study of an intervention”
is a bona fide work of Dr. Anantharam.V in partial fulfilment of
the requirements for the M.D Community Medicine examination
(Branch-XV) of the Tamil Nadu Dr. M.G.R. Medical University,
Chennai, to be held in May 2018.
Dr. Jasmin Helan
(MD, Dip.NB, MPH)Guide, Professor & Head
Department of Community Health
Christian Medical College, Vellore
Dr. Anna B Pulimood
(MD, Ph.D)Principal
iii
DECLARATION
This is to certify that this dissertation titled “EFFECTIVENESS OF A
COMMUNITY BASED PHYSICAL ACTIVITY PROGRAMME IN
CHANGING THE PHYSICAL ACTIVITY PROFILE OF THE
COMMUNITY – A FEASIBILITY STUDY OF AN INTERVENTION” is a
bona fide work done by me, under the guidance of DR. JASMIN HELAN, in
partial fulfilment of the rules and regulations for the MD Branch XV
(Community Medicine) Degree examination of the Tamil Nadu Dr. M.G.R.
Medical University, Chennai, to be held in May 2018.
I have independently reviewed the literature, collected the data and carried out
the evaluation towards the completion of the thesis.
DR. ANANTHARAM.V P G REGISTRAR
DEPARTMENT OF COMMUNITY HEALTH CHRISTIAN MEDICAL COLLEGE
iv
CERTIFICATE – II
This is to certify that this dissertation work titled “Effectiveness of a
community based physical activity programme in changing the physical
activity profile of the community – a feasibility study of an intervention” of
the candidate Dr. Anantharam.V with registration number- 201525051
for the award of degree of M.D in the branch of Community Medicine (XV).
I personally verified the urkund.com website for the purpose of plagiarism
check. I found that the uploaded thesis file contains introduction to conclusion
pages and result shows two percentage of plagiarism in the dissertation.
vi
Acknowledgements
Firstly, I would like to thank the Almighty for placing me at this esteemed place
amidst wonderful people at the most opportune time to help realise my goals and
challenge myself while doing so, in spite of many obstacles, that were faced and
crossed.
My gratitude towards my guide knows no bounds. I thank Dr. Jasmin Prasad, my
mentor, guide and a perpetual source of inspiration during my tenure as a post
graduate resident.
I thank Dr. JP Muliyil, Dr. Kuryan George, and Dr. Anu Oommen for the time and
thought they put in for this work.
My gratefulness extends to Dr. Nihal Thomas and Dr. Riddhi Das Gupta from the
department of Endocrinology, Diabetes and Metabolism for their expert guidance.
I would like to thank Dr. Vinod Abraham, Dr. Shanthidani Minz, Dr. Venkata
Raghava, Dr. Jacob John, Dr. Anu Rose, Dr. Divya Muliyil, Dr, Sam Marconi, Dr.
Bhavya, Dr. Sindhu and all the faculty of the Community Health Department of
CMC, Vellore for the impetus provided. Special mention and gratitude to the
Department of Family medicine, LCECU.
I am much obliged to Mrs. Sarala, Mrs. Inthira, the health aides working in
Community Health and Development department of CMC. Special heartfelt
salutations to Mr.Vijaykumar and Mr. Sivashanmugam for everything that they have
done for this study selflessly at all times.
vii
Mrs. Salomi from the computer cell was helpful at all times.
Heartfelt thanks to the CHTC and CHAD office staff Mrs. Mary, Mrs. Sumi, Mr.
Suresh, Mr. William and Mr. Sudhesh.
A big thank you to the laboratory staff of CHAD, Mr. Balaji and team, who were
supportive at all times.
My sincere thanks goes to Peripheral Health nurses, Part Time Community Health
Workers (PTCHWS) and the local volunteers of the areas for their unstinting support.
It would be remiss of me if I do not thank my friends and colleagues, Drs., Charles,
Dolorosa, Kusum, Martina, Mohan, Sumanto, Anjali, Madhu Mohan, Nirmala,
Shalini, Swathi, Deepak, Jackwin, Kiran, Nirupama, Riya, Sandeep, Rachel, Sobers,
Tarun, Karthika, Bincy, Harsh, Ranjith, Krithika and many others.
I will be eternally grateful and indebted to my parents and my sister, Akhila, for their
abiding love that has seen me through the good times and the bad. Their support is
inestimable and their love unfathomable.
Last but definitely not the least, I would like to offer my gratitude to the people of
Edayansathu, Thuthipet, Sathumadurai, Kurumberpalyam, Pangalathan and Nelvoy,
the villages that were part of this study. Their geniality and large-heartedness with
which they invited me into their houses and treated me as one of their own was
viii
Glossary of Abbreviations
AO – Abdominal Obesity
BMI – Body Mass Index
BP – Blood Pressure
CHAD - Community Health and Development
CI – Confidence Interval
CO – Central Obesity
CVD – Cardio Vascular Diseases
FBS – Fasting Blood Sugar
GO – Generalised Obesity
GPAQ – Global Physical Activity Questionaaire
HDL-C – High Density Lipoprotein Cholesterol
ICMR – Indian Council of Medical Research
LDL-C – Low Density Lipoprotein Cholesterol
LSCS – Lower segment Caesarean section
MET – Metabolic Equivalent of Task
MNREGA – Mahatma Gandhi National Rural Employment Guarantee Act
NCD – Non Communicable disease/s
NFHS – National Family Health survey
NPCDCS – National Programme for Prevention and Control of Cancer,
Diabetes, Cardiovascular diseases and Stroke
OR – Odds ratio
PPBS – Post-prandial blood sugar
SDG – Sustainable Development Goals
SES – Socio-economic status
TTM – Trans-Theoretical Model of health education
ix
Table of Contents
1. Introduction and Justification 1
2. Aim and Objectives 3
3 Review of Literature 4
3.1 Non communicable diseases 4
3.1.1 Problem statement and implications of NCDs 4
3.1.2 National Programme to prevent and control NCDs 6
3.1.3 Risk factors and Prevention of NCDs 6
3.2 Physical activity 8
3.2.1 Definition, Types and Measurement of physical activity 8 3.2.2 WHO Global Recommendations on physical activity
for health
9
3.2.3 Problem statement of insufficient physical activity 9
3.2.4 Barriers of physical activity among middle aged Indian
women
10
3.3 Physical activity and Metabolic Syndrome 11
3.4 Physical activity and Obesity 13
3.5 Physical activity and Dyslipidemia 15
3.6 Physical activity and Hypertension 15
3.7 Physical activity and Diabetes mellitus 16
3.8 Physiological health benefits of physical activity 16
x
4.1 Study Design 19
4.2 Study Setting 19
4.3 Study Population 21
4.4 Sampling technique 21
4.5 Sample size calculation 21
4.6 Data Collection 22
4.6.1 Variables measured 22
4.6.2 Tools used 23
4.7 Intervention 23
4.8 Method followed 27
4.8.1 Assessment of physical activity 27
4.8.2 Assessment of diet 28
4.8.3 Assessment of nutritional status 29
4.8.4 Measurement of blood pressure 30
4.8.5 Assessment of Biochemical parameters 30
4.9 Ethical issues and Confidentiality 31
4.10 Data management and analysis 32
4.10.1 Analysis of physical activity 32
4.10.2 Analysis of diet 34
4.11 Methodology Algorithm 35
5 Results 38
xi
5.2 Medical history and Family history of NCDs 42
5.3 Anthropometric characteristics 43
5.4 Physiological and biochemical parameters 44
5.5 NCD and risk factor status 45
5.6 Diet characteristics 48
5.7 Physical activity profile 49
5.8 Effect of community based intervention 52
5.9 Utilisation of community gymnasium / walking path 57
5.10 Determinants of physical activity level 58
5.11 Multivariate analysis of determinants 61
6 Discussion 62
7 Conclusions 73
8 Recommendations 75
9 Limitations 76
10 Bibliography 77
11 Annexures 83
11.1 IRB Approval letter 83
11.2 Information sheet – Tamil and English 88
11.3 Consent form – Tamil and English 94
11.4 Questionnaire – Pre and Post intervention 96
11.5 GPAQ Showcards 105
xii
[image:12.595.121.549.96.778.2]Index of Tables
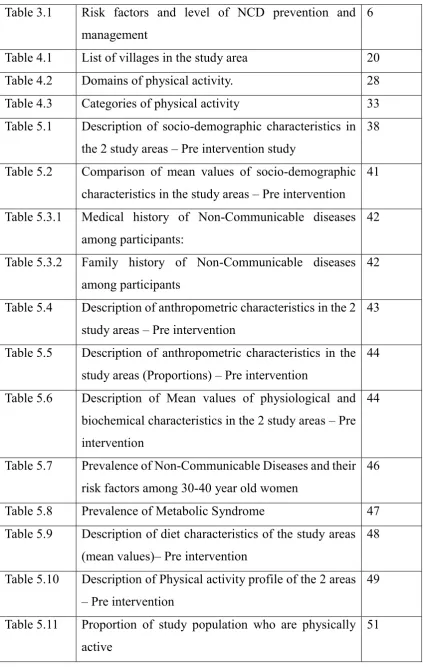
Table 3.1 Risk factors and level of NCD prevention and management
6
Table 4.1 List of villages in the study area 20
Table 4.2 Domains of physical activity. 28
Table 4.3 Categories of physical activity 33
Table 5.1 Description of socio-demographic characteristics in the 2 study areas – Pre intervention study
38
Table 5.2 Comparison of mean values of socio-demographic characteristics in the study areas – Pre intervention
41
Table 5.3.1 Medical history of Non-Communicable diseases among participants:
42
Table 5.3.2 Family history of Non-Communicable diseases among participants
42
Table 5.4 Description of anthropometric characteristics in the 2 study areas – Pre intervention
43
Table 5.5 Description of anthropometric characteristics in the study areas (Proportions) – Pre intervention
44
Table 5.6 Description of Mean values of physiological and biochemical characteristics in the 2 study areas – Pre intervention
44
Table 5.7 Prevalence of Non-Communicable Diseases and their risk factors among 30-40 year old women
46
Table 5.8 Prevalence of Metabolic Syndrome 47
Table 5.9 Description of diet characteristics of the study areas (mean values)– Pre intervention
48
Table 5.10 Description of Physical activity profile of the 2 areas – Pre intervention
49
Table 5.11 Proportion of study population who are physically active
[image:12.595.125.549.100.768.2]xiii
Table 5.12 Comparison of mean socio-demographic characteristics in both areas – Pre and Post Intervention surveys
52
Table 5.13 Comparison of Proportions of socio-demographic characteristics in both areas – Pre and Post Intervention
53
Table 5.14 Comparison of domains of physical activity of the two study areas – Pre and Post Intervention
54
Table 5.15 Proportion of study population who are physically active post-Intervention
56
Table 5.16 Association of Physical activity with Non-Communicable diseases and its risk factors
58
Table 5.17 Determinants of Physical activity level in the study populations
59
Table 5.18 Multivariate analysis to study the association of each determinant adjusting for all other co-variables
61
[image:13.595.124.551.476.705.2]Index of Figures
Figure 4.1 Map of Kaniyambadi block 19
Figure 4.11 Detailed Diagrammatic algorithm of the study method and design
35
Figure 5.1 Socio-economic status by B.G.Prasad classification
40
Figure 5.2 Mode of delivery 40
Figure 5.3 Prevalence of Diabetes mellitus 45
Figure 5.4 Prevalence of hypertension 45
Figure 5.5 Utilisation of community gymnasium 57
1
1.
Introduction and Justification
Physical activity is defined by WHO as any bodily movement that requires energy expenditure. It includes exercise as well as other activities done as part of playing, working, active transportation, house chores and recreational activities. Physical inactivity (lack of physical activity) is identified as the fourth leading risk factor for global mortality (1). Insufficient physical activity is one of the four primary risk factor for non-communicable diseases (NCDs). Physically active adults are also at a lower risk for depression and declines in cognitive function as one ages.(2)
People who are insufficiently active have a 20% to 30% increased risk of all-cause mortality compared to those who engage in at least 150 minutes of moderate intensity physical activity per week, or equivalent, as recommended by WHO.(3) According to WHO, global prevalence of insufficient physical activity among middle aged women in developing countries was 27%.(3)
NCDs are mainly cardiovascular diseases (like heart attacks and stroke), cancers, chronic respiratory diseases (such as chronic obstructive pulmonary disease and asthma) and diabetes. They disproportionately affect people in low- and middle-income countries where more than 75% of global NCD deaths occur.(4)
NCDs cause more deaths in the world currently than all other causes combined and
2
Approximately 42% of all NCD deaths globally occurred before the age of 70 years
which are called premature deaths which is preventable.(4)
In India, as of 2017, 61% of all deaths are due to non communicable diseases, with
total number of deaths being 58,17,000. 23% population have risk of premature death
by the four main NCDs.(5)
According to ICMR-INDIAB study done in 2014, prevalence of physical inactivity
among rural women was 62.3% which was one of the highest in India.(6)
A cross-sectional study with multi-stage cluster sampling design which was
conducted in a rural coastal Karnataka found that most participants did not perceive
a need to increase their physical activity level, though it was low and there was very
low awareness regarding chronic disease related health benefits of physical
activity.(7)
A study done in rural Vellore in 2012, showed prevalence of physical inactivity
among rural women to be 46.4% with high prevalence of most of the risk factors of
NCDs like overweight – 34.6%, central obesity - 55.3%, hypertension – 15.3%,
diabetes – 10.3%, metabolic syndrome – 34.5%.(8)
Most of these prevalence of NCDs and their risk factors were higher than Tamil Nadu
and India statistics. This prompted the need for a community based programme
focussing on improving physical activity profile, and also diet habits among the
general population, to prevent, reduce and postpone the incidence of risk factors of
3
2. Aim and Objectives
Aim:
To evaluate the effectiveness of a community based physical activity programme in
changing the physical activity profile of the community.
Objectives:
1. To measure the change in level of physical activity among women in the age
group 30-40 years of the selected villages in Kaniyambadi block, Vellore
following community based physical activity intervention for prevention of
Non-Communicable diseases.
2. To measure the level of physical activity among women in the age group
30-40 years of the selected villages in Kaniyambadi block, Vellore.
3. To study the determinants of physical activity among women in the age group
4
4.
Review of Literature
3.1 Non communicable diseases
Non communicable diseases are chronic diseases which are of long duration and generally slow progression. The four main types of non communicable diseases are cardiovascular diseases (includes heart attacks and stroke), cancer, chronic respiratory diseases (such as chronic obstructed pulmonary disease, asthma) and diabetes.(4)
3.1.1 Problem statement and Implications of NCDs:
Collectively, they are responsible for almost 70% of all deaths worldwide. Almost
three quarters of all NCD deaths, and 82% of the 16 million people who died
prematurely (before reaching 70 years of age), occur in low- and middle-income
countries. The rise of NCDs has been driven by four major risk factors: tobacco use,
physical inactivity, unhealthy diet and harmful alcohol use. (9)
Cardiovascular diseases (coronary heart disease, stroke, and hypertension) contribute
to 45% of all NCD deaths followed by chronic respiratory disease (22 %), cancers
(12 %) and diabetes (3%).(10)
5
WHO is organizing the Global Conference on NCDs in October, 2017 to launch a set of new global initiatives to help countries accelerate progress in reducing premature mortality from NCDs and fast-tracking efforts to attain SDG target 3.4 by 2030.(11)
16 lakh deaths per year can be attributed to insufficient physical activity. Close to 40 lakh annual deaths have been attributed to excess salt/sodium intake(4). Poverty is closely linked with NCDs. The rapid rise in NCDs is predicted to stall poverty reduction initiatives in low-income countries, particularly by increasing household costs associated with health care. Vulnerable and socially disadvantaged people get sicker and die sooner than people of higher social positions, especially because they are at greater risk of being exposed to harmful products, such as tobacco, insufficient and unhealthy dietary practices, and have limited access to health services.
In low-resource settings like ours, health-care costs for NCDs quickly drain household resources. The exorbitant costs of NCDs, including often lengthy and expensive treatment and loss of breadwinners, force lakhs people into poverty annually and stifle development.(12)
6
3.1.2 National Programme to prevent and control NCDs:
Government of India has instituted a National Programme for Prevention and
Control of Diabetes, Cardiovascular Diseases and Stroke (NPCDCS), objectives of
which are:
Awareness generation on lifestyle changes
Early Detection of NCDs
Capacity Building of health systems to tackle NCDs(14)
The following Interventions are planned in the programme: i) Health promotion
and health education for community, ii) Early Detection of Persons with High
Levels of Risk Factors (at the risk of developing disease) through screening iii)
Strengthening health systems at all levels to tackle NCDs and improvement of
quality of care(15)
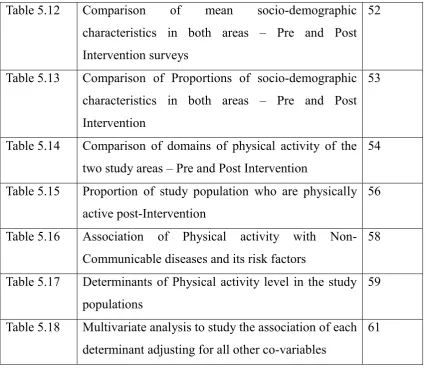
[image:19.595.91.527.532.739.2]3.1.3 Risk factors and Prevention of NCDs
:
7
Risky lifestyle behaviours are responsible for the risk factors of NCDs. Risk factors
are cumulative and operate on a life course perspective. (i.e. they influence the risk
throughout the life course. For example, childhood obesity is a major risk factor for
adult obesity and consequently diabetes and CVD). Risk factors operate in a
continuum. This means that even within the normal ranges, people with higher
level have higher risks. For example, individuals with systolic blood pressure of
130 mmHg have a higher risk of CVD, stroke and future death than those with 120
mmHg even though both are within ‘normal’ range. The risk factors are additive.
This means cumulative small elevations of risk factors are much more harmful than
isolated elevation of a single risk factors. It is important to note that all these risk
factors are amenable to modification through lifestyle changes. (5)
In brief, today’s unhealthy practices and habits are tomorrow’s risk factors.
Today’s risk factors are tomorrow’s disease. Thus, primary and secondary
prevention of chronic diseases and their common risk factors provide the most
sustainable and cost-effective approach to chronic disease prevention and control. It
has been reported that a large waist circumference is significantly inversely
associated with HDL cholesterol levels and significantly positively associated with
LDL cholesterol levels and blood pressure. From various studies, exercise and
increased physical activity had a significant effect on LDL cholesterol levels. A
higher percentage of those who exercised for half an hour or more daily had LDL
cholesterol levels <130 mg/dL than those who did not exercise regularly. (16).
BMI, is consistently related to increased blood pressure and unfavourable lipid
8
3.2 Physical activity:
3.2.1 Definition, Types and Measurement of physical activity:
Physical activity is defined by WHO as any bodily movement that requires energy expenditure. It includes exercise as well as other activities done as part of playing, working, active transportation, house chores and recreational activities. Physical inactivity (lack of physical activity) is identified as the fourth leading risk factor for global mortality (18).
Few terminologies while studying physical activity and health:
1. Exercise: A subcategory of physical activity that is planned, structured,
repetitive, and purposeful in the sense that the improvement or maintenance
of one or more components of physical fitness is the objective
2. MET: MET refers to metabolic equivalent of a task and 1 MET is the rate of
energy expenditure while sitting at rest. Physical activities frequently are
classified by their intensity, using the MET as a reference.
3. Moderate-intensity physical activity: On an absolute scale, moderate intensity
refers to the physical activity that is performed at 3.0–5.9 times the intensity
of rest. On a scale relative to an individual’s personal capacity,
moderate-intensity physical activity is usually a 5 or 6 on a scale of 0–10
4. Vigorous-intensity physical activity: On an absolute scale, vigorous intensity
refers to physical activity that is performed at 6.0 or more times the intensity
of rest for adults and typically 7.0 or more times for children and youth. On a
scale relative to an individual’s personal capacity, vigorous-intensity physical
9
3.2.2 WHO Global Recommendations on physical activity for health:
WHO recommendations in order to improve cardiorespiratory and muscular fitness,
bone health, reduce the risk of NCDs and depression are:
1. Adults aged 18–64 should do at least 150 minutes of moderate-intensity aerobic
physical activity throughout the week or do at least 75 minutes of vigorous-intensity
aerobic physical activity throughout the week or an equivalent combination of both
2. Aerobic activity should be performed in bouts of at least 10 minutes duration.
3. Adults should increase their moderate intensity aerobic physical activity to 300
minutes per week, or engage in 150 minutes of vigorous-intensity aerobic physical
activity per week, or an equivalent combination of both for additional health benefits.
4. Muscle-strengthening activities should be done involving major muscle groups on
2 or more days a week.(19)
3.2.3 Problem statement of insufficient physical activity:
The Global prevalence of Physical inactivity among adult women is 27% (20).
According to ICMR-INDIAB study done in 2014, physical inactivity among middle
aged rural women was 62.3% which was one of the highest in the country.(6) In a
study done in a similar setting in Vellore in 2012, prevalence of physical inactivity
among rural women was found to be 46.4% (8)
In a cross sectional study done in Kerala about risk factor profile for Chronic NCDs,
the relationship between Physical inactivity and diabetes, hypertension, overweight
was expressed as Odds ratios of 1.34, 1.64 and 2.5 respectively which showed
10
3.2.4 Barriers of physical activity among middle aged Indian women :
In a qualitative study conducted in Kerala in 2016, Four focus group discussions were conducted among individuals between 25 and 60 years of age, in a few areas of Thiruvananthapuram. Women associated physical activity mostly with household activities. The majority of the women considered their activity level adequate, although they engaged in what the researchers concluded were quite low levels of activity. Commonly reported barriers were lack of time, motivation, and interest; stray dogs; narrow roads; and not being used to the culture of walking. Facilitators of activity were seeing others walking, walking in pairs, and pleasant walking routes. Walking was reported as the most feasible physical activity by women.(22)
A systematic review of published studies reporting physical activity among South
Asian adults residing in South Asia. In Indian females the inactivity prevalence was
17.0%-79.6%, while majority of the studies (n = 5, 62.5%) reported it to be >
39.5%.(23)
A cross-sectional study with multi-stage cluster sampling design was conducted in
a rural coastal Karnataka. Most participants did not perceive a need to increase
their physical activity level and there is very low awareness regarding chronic
disease related health benefits of physical activity.(7)
Another study done in similar rural setting showed individuals with low physical
activity levels had higher prevalence of metabolic syndrome as compared to their
counterparts. Moreover, individuals with low physical activity levels had
significantly higher BMI, waist circumference, waist height ratio than individuals
11
higher among females in both the settings compared to males.(24)
While numerous studies suggest that lower levels of physical activity lead to obesity, there is also evidence for a reverse effect – that obesity leads to reduced levels of activity, and the association may be bi-directional, potentially to different degrees in different populations.(25)
The most common external barriers among the middle-aged respondents were 'not
enough time' (46.7%), 'no one to exercise with' (40.0%) and 'lack of facilities'
(33.4%). The most common internal barriers for middle-aged respondents were 'too
tired' (48.3%), 'already active enough' (38.3%), 'do not know how to do it' (36.7%)
and 'too lazy' (36.7%). These factors should be taken into account when healthcare
policies are being designed and when interventions such as the provision of facilities
to promote physical activity and exercise are being considered(26).
3.3 Physical activity and Metabolic Syndrome:
Metabolic syndrome is a cluster of metabolic disorders. When a patient presents with
these conditions together, the chances for future cardiovascular disease is greater
than any one factor presenting alone. Metabolic syndrome is a serious health
condition that affects about 23 percent of adults and places them at higher risk of
cardiovascular disease, diabetes, stroke and diseases related to fatty build-ups in
artery walls.
Metabolic syndrome occurs when a person has three or more of the following
12
Abdominal obesity (Waist circumference of greater than 40 inches in men,
and greater than 35 inches in women)
Triglyceride level of 150 milligrams per deciliter of blood (mg/dL) or greater
HDL cholesterol of less than 40 mg/dL in men or less than 50 mg/dL in women
Systolic blood pressure (top number) of 130 millimeters of mercury (mm Hg) or greater, or diastolic blood pressure (bottom number) of 85 mm Hg or
greater
Fasting glucose of 100 mg/dL or greater
A study done by Deedwania et al showed Age adjusted prevalence (%, 95%
confidence intervals) of metabolic syndrome in men and women was 33.3 (31.7–
34.9) and 40.4 (38.6–42.2). Individual components of metabolic syndrome in men
and women, respectively, were: high waist circumference 35.7 (34.1–37.3) and 57.5
(55.6–59.3), high blood pressure 50.6 (48.9–52.3) and 46.3 (44.4–48.1), impaired
fasting glucose/diabetes 29.0 (27.5–30.5) and 28.0 (26.3–29.7), low HDL cholesterol
34.1 (32.5–35.7) and 52.8 (50.9–54.7) and high triglycerides 41.2 (39.5–42.8) and
31.5 (29.7–33.2) percent. Prevalence of metabolic syndrome was significantly
greater in subjects with highest vs. lowest categories of education (45 vs. 26%),
occupation (46 vs. 40%), fat intake (52 vs. 45%), sedentary lifestyle (47 vs. 38%)
and body mass index (66 vs. 29%) (p < 0.05)(27).
A community study consisting of 1178 adults in urban eastern India by D.S Prasad
et al showed that even in poor parts of India, the prevalence of metabolic syndrome
was as high as 33.5% overall, 24.9 % in males and 42.3% in females. Older age,
13
middle-to-high socioeconomic status significantly contributed to increased risk of
metabolic syndrome(28)
A study was conducted to estimate prevalence of metabolic syndrome among 150
rural women in the age group of 30-50 years in a primary health centre area in Tamil
Nadu by I. Selvaraj et al and the prevalence was found to be 36%. The most
commonly observed components of metabolic syndrome in this study was increased
waist circumference (56.0%) followed by low HDL (45.3%), high triglyceride
(37.3%), high blood pressure 29.3%, and fasting blood sugar 12.7%.(29)
3.4 Physical activity and Obesity
WHO defines obesity as abnormal or excessive accumulation of fat that may impair
health. Body Mass Index (BMI) is used as an index of weight-for-height that is used
to classify obesity and overweight in adults.
BMI (kg/m2) = weight in kg
(Height in meter)2
Classification :
BMI > 25 (overweight)
>25–29·9 kg/m2 (pre-obese)
>30 kg/m2 (obesity).
>30–39·9 kg/m2 (obese class I),
>35–39·9 kg/m2 (obese class II),
14
WHO Asia Pacific guidelines to define obesity –
generalized obesity (GO) - BMI≥25kg/m2,
abdominal obesity (AO) - waist circumference ≥90 cm for men and ≥80cm for women) and
combined obesity (CO) - GO plus AO
Phase I of the ICMR-INDIAB study, with 13,800 subjects, conducted in Tamil Nadu,
Maharashtra, Jharkhand and Chandigarh showed a high prevalence of GO, AO, and
CO(30). A study conducted in Salem, Tamil Nadu with 263 subjects found that 44.9%
respondents were found to be pre-obese and 19.0% were obese. The estimated risk
for the females to have an increased metabolic risk was 9.4 times that of the males.
60.8% persons had abdominal fat accumulation, based on the waist to hip ratio.(31)
Effects of Obesity :
High blood pressure (Hypertension)
High LDL cholesterol, low HDL cholesterol, or high levels of triglycerides (Dyslipidemia)
Type 2 diabetes
Coronary heart disease
Stroke
Gallbladder disease
Osteoarthritis (a breakdown of cartilage and bone within a joint) Sleep apnoea and breathing problems
Some cancers (endometrial, breast, colon, kidney, gallbladder, and liver)
Low quality of life
15
3.5 Physical activity and Dyslipidemia
It is defined as elevated total or low density lipoprotein (LDL) cholesterol and
decreased high density lipoprotein (HDL) cholesterol.
In a study conducted by Ambrish Mithal et al in 2014, a total of 5400 patients with
T2DM from 178 centers across India were screened and it was found that
dyslipidemia control in Indian T2DM patients is very poor with almost half of them
not reaching their LDL -C goal.(32). The ICMR-INDIAB study of 2014 conducted
by Shashank. R. Joshi et al, showed that 13.9% had hypercholesterolemia, 29.5%
had hypertriglyceridemia, 72.3% had low HDL-C, 11.8% had high LDL-C levels and
79% had abnormalities in one of the lipid parameters.(33)
3.6 Physical activity and Hypertension
High blood pressure is a common condition in which the long-term force of the blood
against your artery walls is high enough that it may eventually cause health problems,
such as heart disease(34)
Classification Systolic BP (mmHg) DiastolicBP (mmHg)
Normal <120 And <80
Prehypertension 120-139 Or 80-89
Stage 1 hypertension 140-159 Or 90-99
16
A study conducted by Venkatachalam J et al in 2016 in Kancheepuram, TN with 3681
respondents aged 15 years and older showed 10.8% prevalence of hypertension,
which included the participants who are known hypertensive on treatment and/or
whose blood pressure was more than 140/90 mm Hg in sitting position for adult. The
prevalence of isolated systolic hypertension was 2.9%, 2.7% among male and 2.9%
among female subjects. The prevalence of hypertension increased proportionately
with increasing age. Hypertension was more prevalent among those who had the
habit of smoking tobacco (18.2%), alcohol consumption (17.4%), and those who
were obese (14.2%). (35)
3.7 Physical activity and Diabetes mellitus:
Diabetes is a group of metabolic disorders characterized by hyperglycemia resulting
from defects in insulin secretion, insulin action (hepatic and peripheral glucose
uptake), or both(36)
There are numerous studies to suggest that Physical activity prevents or postpones
incidence of Type 2 Diabetes mellitus in adults(37) (38)
3.8 Physiological health benefits of physical activity:
Health benefits of regular physical activity are plentiful and significant. As
mentioned by Center for Disease Control and Prevention, it improves body
composition, reduces risk of cardiovascular diseases, type 2 diabetes, metabolic
syndrome, few cancers. It also improves mental health and increases longevity.(39)
17
usually used to refer to the relative percentage of fat and fat-free tissue(40) Physical
activity has shown to affect body composition and weight favourably by promoting
fat loss and maintaining mean tissue mass(41)
A randomized control trial done among adults aged 40-65 years with dyslipidaemia
in Durham and other surrounding countries experimented an exercise programme
with three different exercise intensities against a control group to study its effects on
body weight, body composition and central adiposity. There was a significant dose
response relationship seen between the amount of weekly exercise and the amount
of weight change in overweight adults(39) A cross sectional study in India also found
a similar inverse relationship between physical activity and body composition(42)
Physical inactivity is known to be an important lifestyle modifiable factor for
prevention of NCDs which includes cardiovascular diseases (stroke and heart
disease), diabetes, cancer and chronic respiratory diseases ( chronic obstructive
pulmonary disease and asthma).(6) In 2016, it was published in Lancet journal that
physical inactivity was the 4th leading risk factor for death worldwide stating that it
as an urgent public health priority(43)
A study done analysing the effect of physical inactivity on the burden of non
communicable diseases worldwide estimated that physical inactivity causes 6% of
the burden due to coronary heart diseases, 7% of type 2 diabetes mellitus, 10% of
breast cancer and 10% of colon cancer. Interestingly it was also found that if the level
of inactivity decreased by 10% or 25%, more than 5 lakh to 13 lakh deaths could be
averted respectively and an increase in life expectancy of the world’s population
18
Regular physical activity is also known to boost the immune response. It is known
to increase systemic concentrations of muscle derived interleukins and circulating
neutrophil counts. This response is known to assist in the clearance of glucose and
lipoproteins from the circulation and improve insulin sensitivity. Additionally it is
known to prevent the initiation and development of cardiovascular diseases since
both macronutrients are integral in the development of atherosclerotic plaque(45).
Physical activity has a beneficial effect to the neurological system of the body as
well. It is known to increase resilience to stress, increase energy and reduce fatigue,
slows down brain atrophy and promotes neurogenesis and improve self-esteem(46).
Studies have found that adults who engage in regular physical activity experience
fewer depressive and anxiety symptoms(47)
In spite of all these advantages lack of physical activity is still an emerging public
health issue. In India, physical activity, largely, is from work and transportation
domains. A cross sectional study done in South India highlights the participants not
feeling the need to improve their physical activity levels and having very low
19
4. Methodology
:
4.1 Study design: A feasibility study of a community based intervention.
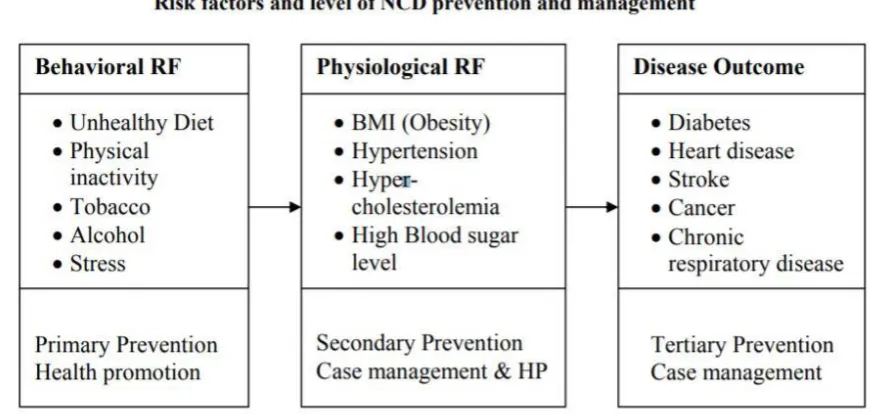
4.2 Study Setting: The community health department of Christian Medical College,
Vellore has established an integral health and development programme in
Kaniyambadi block (CHAD). The CHAD project covers 82 villages and a population
[image:32.595.90.526.360.727.2]of 1,15,505.
Figure 4.1
Intervention-A area
20
Following a multi-centric study about "Prevalence of Coronary Heart Disease and its
risk factors in urban and rural areas, Vellore”, sponsored by the ICMR done by the
Community health department and Cardiology department(49) ,the need for a
community based physical activity programme became a priority. The study was
conducted in 2 geographical areas in Kaniyambadi block of Vellore district, Tamil
[image:33.595.87.509.307.556.2]Nadu. Each area consisted of many villages.
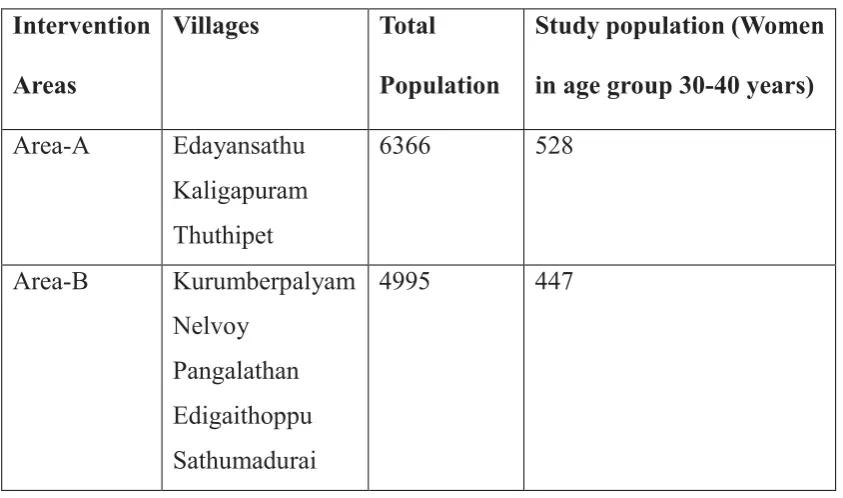
Table 4.1 : List of villages in the selected study areas:
Intervention
Areas
Villages Total
Population
Study population (Women
in age group 30-40 years)
Area-A Edayansathu
Kaligapuram Thuthipet
6366 528
Area-B Kurumberpalyam
Nelvoy Pangalathan Edigaithoppu Sathumadurai
4995 447
The suggestions and informal pleas of people from these villages to CHAD through
their village leaders and representatives, combined with the need for a
comprehensive programme to reduce risk factors of Non-Communicable diseases
prompted us to select these villages. The two areas were considerably far from each
21
4.3 Study Population: Women between 30-40 years of age who are Permanent
residents of the above mentioned villages, randomly selected from Census of
Kaniyambadi block maintained by CHAD Health Information system.
Exclusion Criteria:
Pregnant women.
Any musculo-skeletal or psychiatric conditions impairing cognition
contraindicating daily unsupervised moderate intense physical activity.
4.4 Sampling technique:
As mentioned above, the suggestions and informal pleas of villagers from
Edayansathu, Nelvoy and Sathumadurai prompted the respective village leaders to
propose an action plan to reduce Non-communicable diseases and its risk factors like
Obesity. This proposal combined with the need for a comprehensive programme to
reduce the risk factors of Non-Communicable diseases prompted us to select these
villages. The two areas were considerably far from each other i.e. around 8km apart,
on either side of a state highway (SH-38).
The participants for both the pre and post-Intervention studies were selected by
separate Simple random sampling from a list generated by Census of Kaniyambadi
block maintained by CHAD Health Information system.
4.5 Sample size Calculation:
According to the study, Diet and Physical Activity Among Women in Urban and
22
Jayamani, Vijayaprasad Gopichandran, Premila Lee, Greeda Alexander, Solomon
Christopher, Jasmin Helan Prasad, the proportion of population in rural Vellore with
adequate physical activity among middle aged women was found to be 50.7%.(50)
• To determine the increase in the proportion of women in the community who
are physically active from 50% to 70%, with 80% power, and considering
Cluster design effect to be 1.5 and relative precision being 20% of the
difference between actual and expected proportions (p- and q-, the desired
sample size will be,
• N = ((Zalpha + Zbeta)2 2 p-q-) / d2 x Design Effect (1.5)
N =
140
per arm.4.6 Data collection:
4.6.1 Variables measured:
Socio-demographic variables – Age, Education, Occupation, Family Income,
Marital status, Mode of delivery, Number of children, Housing details, Medical
and family history of Non-Communicable diseases.
Physical activity profile of the study participant
Diet profile
Nutritional status -Weight and Height (BMI), Waist and hip circumferences
(Waist / Hip ratio)Blood pressure
Blood glucose levels - Fasting venous blood glucose and post-prandial venous
blood glucose
23 4.6.2 Tools used:
Structured questionnaire to collect information on socio-demographic
information
Global Physical activity Questionnaire (GPAQ) to measure the physical activity
profile.
24 hour diet recall and food frequency questionnaire to measure the diet profile.
Calibrated mechanical weighing scale to measure weight.
Stadiometer to measure height.
Measuring tape to measure hip and waist circumferences.
Electronic BP apparatus to measure Blood pressure
Venous blood collection - Vacutainers, syringes, cotton, micropore tape, surgical
spirit for drawing blood for biochemical tests.
Biochemical tests – Erba Mannheim EM-200 fully automated Biochemical
analyzer.
4.7 Intervention details:
Two types of intervention strategies were planned and executed for the two areas :
Intervention-A included a planned community health education module, setting
up of an open-air Community gymnasium and identifying walking paths in the
villages.
24
Eight sessions of community health education were conducted in Intervention-A area
and five sessions were conducted in Intervention-B area. The number of sessions
depended on the geography and demography of the places. The health education
team consisted of the principal investigator, CHAD employed health educator,
village Health Aide and occasionally a social worker and local volunteers. Each
session in Intervention-A area lasted 60 minutes and in Intervention-B area lasted 50
minutes. People from all age groups and gender attended and participated in these
health education sessions.
The health education module consisted of 9 topics :
1. Non-Communicable diseases
What are Non-communicable diseases(NCDs)?
Types of NCDs
Prevalence of major NCDs and seriousness of the problem
Risk factors of NCDs – Modifiable and preventable
Why is it better to prevent than treat?
2. Obesity
What is considered as Obesity?
Risk factors associated with Obesity
Health and social problems associated with Obesity
Different ways to prevent being obese – Physical activity, Diet.
25 3. Hypertension
What is normal blood pressure and what is Hypertension?
Risk factors of Hypertension
Complications of Hypertension
Prevention and management of Hypertension
4. Stroke
What is a stoke and what are its effects?
What are the risk factors of stroke?
How to prevent Stroke?
5. Hypercholesterolaemia
Types of Cholesterol in our body
Normal ranges of cholesterol and what is considered as high cholesterol
Foods to eat and foods to avoid to maintain normal cholesterol in our body
6. Diabetes mellitus
What is Diabetes and how exactly does it affect our body? (Pathophysiology)
Types of Diabetes and How do you diagnose Diabetes
Risk factors of Diabetes
Symptoms of Diabetes – early , late
26
7. Physical activity equivalents of common food items
Common foods of Tamil Nadu and their common physical activity equivalents.
Food items - Idli, Chapati, Dosai, Poori, Vegetarian meals
Physical activity – Brisk walk, multiple light effort household chores, taking care
of cattle.
8. Mythbusters
Myth 1: “Physical activity takes too much time.”
Myth 2: “The older you are, the less physical activity you need.”
Myth 3: “Taking medication interferes with physical activity.”
Myth 4: “You have to be athletic to exercise.”
Myth 5: “Getting in shape makes you tired.”
9. Orientation to Community gymnasium
The health benefits of each equipment
Whats the best way to use each equipment
Air walker
Hip turner
Seated leg press
27 4.8 Method followed:
The list of eligible women was obtained from the health information system of the
Community Health Department of Christian Medical College, Vellore.
The study participants were approached individually by the principal investigator in
the setting of their house. The details of the study were explained to the study
participants in the local language in detail, and an Information sheet was provided
with contact number of the principal investigator and the base hospital. Thus, an
Informed consent was taken and each participant was allotted a unique ID number.
Socio-demographic details of each participant were collected by direct interview
using a structured questionnaire.
4.8.1 Assessment of physical activity:
GPAQ is a validated structured questionnaire developed by WHO for physical
activity surveillance. It collects information on physical activity participation in three
settings (or domains) and sedentary behavior. These domains are:
(a) Activity at work
(b) Travel to and from places
(c) Recreational activities and
(d) Sedentary activities.
Additional questions about home activities were asked which included
(a) Cleaning activities
(b) Kitchen activities
28
(d) Child Care and
(e) Self-care
Additional questions about usage of the community gymnasium were asked in the
post Intervention phase in Intervention-A area.
All the questions in GPAQ were asked in a uniform standardized template in local
language and the participants were given sufficient time to think and answer. What
activities constituted vigorous-intensity and moderate-intensity activity at work,
travel, vigorous-intensity and moderate-intensity recreational activities were
explained as per GPAQ guidelines with relevant generic showcards as examples for
ease of understanding.
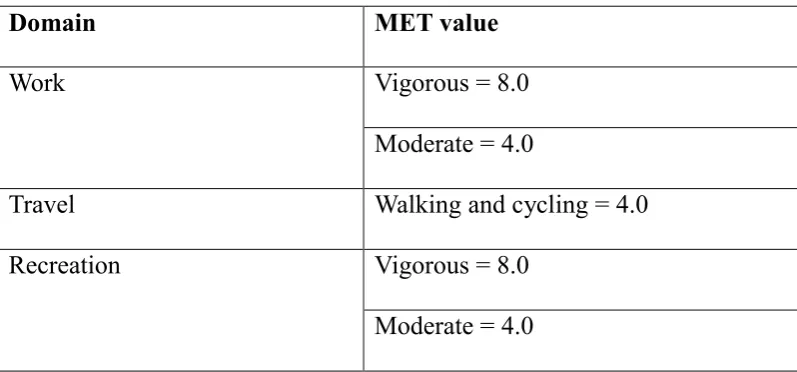
[image:41.595.89.488.428.614.2]The information collected about physical activity was converted to MET values by:
Table 4.2: Domains of physical activity.
Domain MET value
Work Vigorous = 8.0
Moderate = 4.0
Travel Walking and cycling = 4.0
Recreation Vigorous = 8.0
Moderate = 4.0
4.8.2 Assessment of Dietary intake:
A Semi-structured questionnaire for 24 hour Food Recall was used. Frequency of
fruits and fried food intake in a typical day/week was asked. Participant was asked
29
Standard measuring cups and spoons were used to assess the actual amount of food
consumed. If the participant had a feast or a fast due to ill-health, festival or any
reason, which was unlike her usual dietary habit, the previous 24 hour diet recall was
recorded. Using the database of ‘Nutritive Value of Indian Foods’ as given by the
National Institute of Nutrition, the total calorie, carbohydrate, protein and fat were
calculated.
4.8.3 Assessment of nutritional status:
– Height was measured by the Principal Investigator using standard Stadiometer
with the participant standing upright looking straight ahead without footwear,
with both their feet placed touching each other and knees extended.
– Weight was checked by the Principal Investigator using calibrated mechanical
weighing scale with participant standing upright without footwear.
– Waist circumference was measured by the Principal Investigator using
non-elastic measuring tape held at the midpoint between lower border of last rib and
anterior superior iliac spine in the Mid-axillary line. Hip circumference similarly
30 4.8.4 Measurement of Blood pressure:
– Blood Pressure was measured by the Principal Investigator twice 5 minutes
apart, using automated digital sphygmomanometer with the participant relaxed in
sitting position. If the difference between the 2 readings of either the systolic or
the diastolic BP was more than 10mm Hg, a third reading was taken. Closest of
the three readings to each other were considered in such cases.
4.8.5 Assessment of Biochemical parameters:
– Each participant was given a probable date and time of visit to their houses by
the Principal Investigator for collection of early morning blood samples for
biochemical tests (FBS, PPBS, Lipid profile). Most of the samples were collected in the early morning the next day of interview and almost all participants had
their bloods drawn within one week of interview. Participants whose blood
couldn’t be collected the next day were intimated by phone call too on the
previous day of blood collection to be fasting overnight and to have cooked food
ready so that post-prandial venous glucose could be collected on time and not too
late. A laboratory kit arranged by CHAD hospital lab was carried by the Principal
Investigator to each house. The kit contained vacutainers, disposable gloves,
syringes, vacutainer needles, clean cotton, micropore tape, surgical spirit, rubber
tourniquet and sharps disposing container. Blood was collected for Fasting
venous blood glucose and Lipid profile in the early morning and 2 hour
post-prandial venous blood glucose in the mid-morning with aseptic precautions by
31 4.9 Ethical issues:
– The biochemical results of the participants were followed up by the Principal
Investigator the same day, and in case of abnormal values, a referral letter was
given to the participant at the earliest and the concerned village Health aide who
is part of the CHAD healthcare system was intimated for further follow-ups. A
referral letter was given to people with high BP readings (>140/90 mm Hg) or
obesity (BMI >/=30) measured at the time of interview.
– Lifestyle modification advice was given either in person or over phone call to the
following participants :
o Blood sugars in pre-diabetes stage (FBS 100-125 and/or PPBS 140-199)
o Blood pressure in pre-hypertension phase (Systolic BP 120-139 mm Hg and/or
Diastolic BP 80-89 mm Hg)
o Any one of the parameters in Lipid profile outside the normal range.
o Overweight / Pre-Obese participants ( BMI 25 - 29.99)
o Waist circumference >/=80 cm
o Waist : Hip ratio > 0.85
Confidentiality:
Privacy and confidentiality was maintained during data collection. The results of the
biochemical tests and nutritional assessment were informed to the study participants
32 4.10 Data management and analysis:
Data collected was entered in Epidata 3.1 and analysis was done using SPSS version
20.
Descriptive statistics of the socio-demographic variables in intervention A and
intervention B villages were done. Chi-square tests and Student-t test were applied
to check whether the baseline characteristics of both villages were similar.
4.10.1 Physical activity:
MET score for most of the household activities were less than 4.0 according to widely
accepted Compendium of physical activities.(51) Thus, only three activities with
MET score of more than or equal to 4.0 were weighed in to the physical activity
calculation of that participant and MET score of 4 was given to each of these
activities:
o Heavy cleaning outside the house
o Washing clothes by hand
o Child care–vigorous activities (run, play with children – only active period)
Mean MET scores of vigorous-intensity and moderate-intensity activity at work,
travel, vigorous-intensity and moderate-intensity recreational activities of
participants were described for both the study areas and compared. Mean minutes of
sedentary activity per day of participants was also described for both the study areas
and compared.
The mean change in each of these activities was studied pre and post intervention in
33
Proportion of participants doing vigorous-intensity and moderate-intensity activity
at work, travel, vigorous-intensity and moderate-intensity recreational activities were
described and compared. Change in proportions of population doing each of these
activities was studied pre and post the intervention in both areas by Chi-Square test.
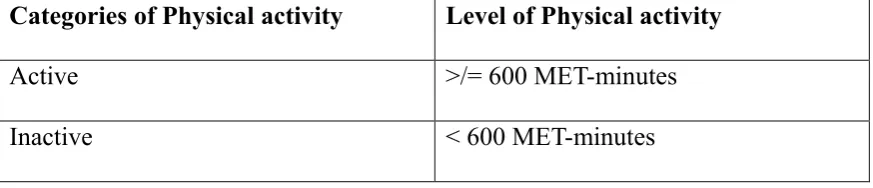
Physical activity profile of the areas was studied by categorizing participants as
‘Active’ and ‘Inactive’ by the WHO recommendations and criteria(52):
Throughout a typical week, including work activity, travel and recreation, adults
should do at least
• 150 minutes of moderate-intensity physical activity
OR
• 75 minutes of vigorous-intensity physical activity
OR
• An equivalent combination of moderate- and vigorous-intensity physical activity
[image:46.595.89.526.551.645.2]achieving at least 600 MET-minutes
Table 4.3: Categories of physical activity
Categories of Physical activity Level of Physical activity
Active >/= 600 MET-minutes
Inactive < 600 MET-minutes
This was described in proportions for both study areas and compared. Change in
proportions of Active and Inactive population was studied pre and post the
34 4.10.2 Diet
Mean values of total calorie intake per day, protein and carbohydrate consumption;
servings of fruits per day and frequency of fried food consumption was described for
both the study areas and compared.
Bivariate and multivariate analysis was done to see the association between various
determinants and the level of physical activity.
Level of physical activity in both intervention areas were compared using difference
35
4.11
Detailed Diagrammatic algorithm of the study method and design:
2 geographical areas each consisting of many villages were selected based on informal requests and pleas by the village population to CHAD through their village leaders to propose an action plan to reduce Non-communicable diseases and its risk factors like Obesity
AREA-A
Edayansathu Kaligapuram
Thuthipet
AREA-B
Kurumberpalyam Pangalathan
Nelvoy Edigaithoppu Sathumadurai
Women between 30-40 years of age who are Permanent residents of the selected villages, excluding:
Pregnant women.
Any musculo-skeletal or psychiatric conditions impairing cognition contraindicating daily unsupervised moderate intense physical activity.
Simple random sampling of study participants from Census of Kaniyambadi block maintained by CHAD Health Information system
.
Sample Size
36
Informed consent Informed consent
Data Collection:
Socio-demographic variables.
Physical activity profile - GPAQ.
Diet profile – 24 hour recall, food frequency
Nutritional status -Weight and Height (BMI), Waist and hip circumferences (Waist / Hip ratio)
Blood pressure
Blood glucose levels - Fasting venous blood glucose and post-prandial venous blood glucose.
Fasting lipid profile.
Intervention:
Community health education module – 5 sessions conducted
Referral to base hospital (CHAD) if any of the variables measured were found abnormal.
Lifestyle modification advice by P.I if any of the variables measured were slightly abnormal
Intervention Details:
Setting up of an open-air Community gymnasium.
Identifying walking paths in the villages.
Community health education module – 8 sessions conducted
Approached subjects, if satisfied any exclusion criteria, were excluded during
data collection also.
Community Health Education Module
8 topics
5 Sessions, attended by people of all ages and gender.
Each session was of duration 50 minutes.
Tool - Flip Charts. Community Health Education Module
9 topics
8 Sessions conducted, attended by people of all ages and gender.
Each session was of duration 60 minutes.
37
Post Intervention Data Collection – after 2 months
Sample size = 73 Post Intervention Data Collection-
after 2 months Sample size = 81
Data Collection:
Socio-demographic variables.
Physical activity profile.
Diet profile Data Collection:
Socio-demographic variables.
Physical activity profile.
Diet profile
Data Entry – Epidata version 3.1
Data Analysis – SPSS version 20 Data Entry – Epidata version 3.1 Data Analysis – SPSS version 20
Planned : Anthropometric, blood pressure and Biochemical assessment after 6 months.
Planned : Anthropometric, blood pressure and Biochemical assessment after 6 months.
Further continuation of the study planned – Periodic assessments
Planned – after 6 months
38
5. Results
Among the total 309 study participants in the Pre-intervention phase, 160 were from
the Intervention A areas and 149 were from the Intervention B areas.
5.1 Socio-Demographic characteristics:
Table 5.1: Description of socio-demographic characteristics in the 2 study areas – Pre intervention study
Characteristics Categories Intervention
A area (160) Intervention B area (149) Total (309)
No. (%) No. (%) No. %
Age (years) 30-35 86 53.8 74 49.7 160 51.8
36-40 74 46.2 75 50.3 149 48.2
Education Nil 4 2.5 9 6 13 4.2
Primary school 4 2.5 8 5.4 12 3.9
Middle school 24 15 25 16.8 49 15.9
High school 87 54.4 80 53.6 167 54.0
Intermediate / Diploma
23 14.4 22 14.8 45 14.6
Graduation 8 5 4 2.7 12 3.9
Post graduation or Professional
10 6.2 1 0.7 11 3.5
Occupation Homemaker 75 46.9 63 42.3 138 44.7 Unskilled /
Semi-skilled
66 41.2 74 49.7 140 45.3
Skilled worker 7 4.4 6 4 13 4.2
Clerical 4 2.5 3 2 7 2.3
Semi-profession
8 5 3 2 11 3.5
Marital Status Unmarried 9 5.6 4 2.7 13 4.2
Ever Married 151 94.4 145 97.3 296 95.8 Number of
children
0 8 5.3 6 4.1 14 4.7
1-2 102 67.5 106 73.1 208 70.3
>2 41 27.2 33 22.8 74 25
39
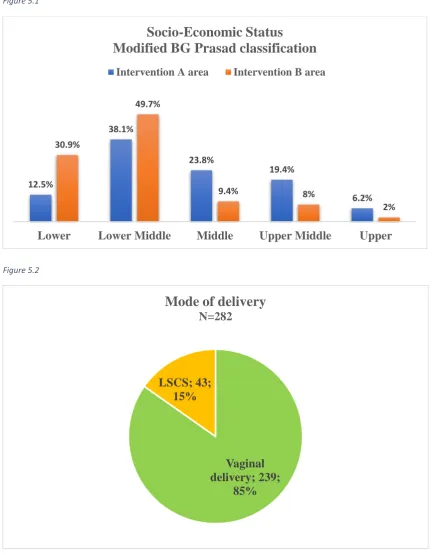
The two study areas were comparable in most of their socio-demographic
characteristics with no statistical differences except the socio-economic status (p
<0.0001). There were more participants who were of lower social classes in
Intervention-B area than Intervention-A area, as depicted in the bar diagram. (Figure
1)
6% of participants in Intervention-B area were illiterates as compared to 2.5% in
area-A, whereas 6.2% participants in area-A were postgraduates or had professional
degrees as compared to 0.7% in area B, although this was not statistically significant.
In Intervention-B area, 49.7% of participants were involved in unskilled and
semi-skilled work, most of whom (84%) were involved in the employment provided by
the MNREGA. On the other hand, 41.2% of participants in Intervention-A area were
engaged in unskilled and semi-skilled work, most of which included daily wage
labour in small factories.
Overall, occupation of study participants ranged from teachers (8; 4.7%), nurses (3;
1.8%), clerical jobs (5; 2.9%), tailors (12; 7%), salaried employees of small scale
industries (8; 4.7%), work at home like beedi rolling, incense sticks preparing,
garland making, packaging, shop attending, etc. (15; 8.8%), housemaids (7; 4.1%),
Anganwadi and ICDS workers (3; 1.8%), shop owners (2; 1.2%), Group-D workers
in schools and hospitals (8; 4.7%), animal rearing / tending to animals for income
(18; 10.5%), daily wage labourers, agricultural / construction labourers (82; 48%)
In Intervention-A area, 3 in 4 participants (73.8%) lived in a pucca house, as
compared to 5 in 6 participants (83.2%) in Intervention-B area, difference not being
40
Figure 5.1
Figure 5.2
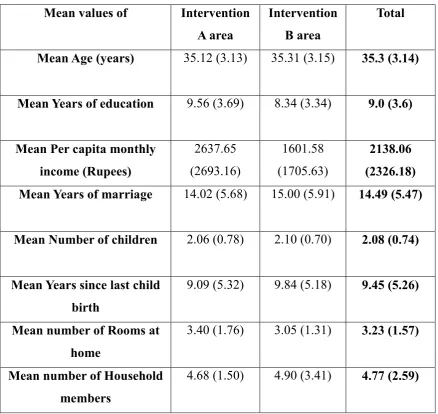
The participants in the 2 study areas were similar except Mean number of years of
education (p= 0.003) and mean monthly family income (p= <0.0001), the difference
being statistically significant. Mean years of education in area A was significantly
higher (9.56 years) than area B (8.34 years) with p value <0.0001.
12.5%
38.1%
23.8%
19.4%
6.2% 30.9%
49.7%
9.4% 8%
2%
Lower Lower Middle Middle Upper Middle Upper
Socio-Economic Status
Modified BG Prasad classification
Intervention A area Intervention B area
Vaginal delivery; 239;
85% LSCS; 43;
15%
41
Likewise, mean per-capita monthly income was higher in area-A (Rs.2,637.65) than
area-B (Rs.1601.58), the difference of which was statistically significant with p value
[image:54.595.88.527.262.676.2]<0.0001.
Table 5.2: Comparison of mean values of socio-demographic characteristics in
the study areas – Pre intervention
Mean values of Intervention A area
Intervention B area
Total
Mean Age (years) 35.12 (3.13) 35.31 (3.15) 35.3 (3.14)
Mean Years of education 9.56 (3.69) 8.34 (3.34) 9.0 (3.6)
Mean Per capita monthly income (Rupees)
2637.65 (2693.16)
1601.58 (1705.63)
2138.06 (2326.18) Mean Years of marriage 14.02 (5.68) 15.00 (5.91) 14.49 (5.47)
Mean Number of children 2.06 (0.78) 2.10 (0.70) 2.08 (0.74)
Mean Years since last child birth
9.09 (5.32) 9.84 (5.18) 9.45 (5.26)
Mean number of Rooms at home
3.40 (1.76) 3.05 (1.31) 3.23 (1.57)
Mean number of Household members
42
5.2 Medical and Family history of NCDs
Table 5.3.1: Medical history of Non-Communicable diseases among participants: Previously diagnosed NCD among participants Intervention-A area Intervention-B area Total
Number % Number % Number %
Diabetes mellitus 6 3.8 5 3.4 11 3.6
Hypertension 0 0 3 2.0 3 1
Heart diseases 1 0.6 0 0 1 0.3
Thyroid abnormalities 12 7.5 10 6.7 22 7.1
Bronchial Asthma 4 2.5 3 2.0 7 2.3
[image:55.595.87.526.145.359.2]Psychiatric illnesses 3 1.9 0 0 3 1
Table 5.3.2: Family history of Non-Communicable diseases among participants: Family history of
NCD Intervention-A area Intervention-B area Total
Number % Number % Number %
Diabetes mellitus 57 35.6 39 26.2 96 31.1
Hypertension 41 25.6 29 19.5 70 22.7
Seizure disorder 3 1.9 2 1.3 5 1.6
Heart diseases 5 3.1 5 3.4 10 3.2
Thyroid abnormalities 10 6.3 2 1.3 12 3.9
Bronchial Asthma 20 12.5 7 4.7 27 8.7
Psychiatric illnesses 3 1.9 1 0.7 4 1.3
Both the study areas were similar in proportion of study participants with
self-reported non communicable diseases. In total, 3.6% participants had diabetes
[image:55.595.88.526.411.641.2]43
and were on medications.
31.1% and 22.7% participants had a family history of diabetes mellitus and
hypertension respectively. 8.7% and 3.2% had a family history of bronchial asthma
and heart ailments.
5.3 Anthropometric characteristics:
Table 5.4: Description of anthropometric characteristics in the 2 study areas – Pre intervention
Mean values of Intervention A
area
Intervention B
area
Total
Height (cm) 153.46 (5.14) 153.44 (6.05) 153.45 (5.59)
Weight (kg) 63.45 (12.98) 61.41 (12.75) 62.47 (12.89)
BMI 26.93 (5.29) 26.01 (5.08) 26.48 (5.20)
Waist circumference (cm) 88.50 (11.41) 83.89 (11.54) 86.28 (11.68)
Waist : Hip ratio 0.856 (0.056) 0.828 (0.061) 0.842 (0.060)
The difference in mean waist circumference (p= <0.0001) and mean waist : hip ratio
(p= <0.0001) between the 2 study areas were found to be statistically significant.
Intervention-A area participants had higher waist circumference and waist/hip ratio
than area-B.