Pattern of physical activity and associated sociodemographic factors:
A community based study using Global Physical Activity Questionnaire
R Kumari1, D Bansal1, Bhola Nath2
(Index words: physical activity, non-communicable disease, metabolic equivalents)
1Department of Community and Family Medicine, AIIMS, Rishikesh, 2Department of Community Medicine, GDMC, Dehradun, India.
Correspondence: BN e-mail: <[email protected]>. Received 13 August 2018 and revised version accepted 03 October 2018.
Abstract
Introduc tion Non-communic able diseases (NCDs) account for nearly half of the overall global burden of disease. Physical inactivity has been reported to be a major independent “modifiable” risk factor for NCDs. Assessment of pattern of physical activity and associated factors would help in informing the participants and policy makers for appropriate interventions.
Methodology A community based cross sectional study in Doiwala block of Dehradun district, in a state of north India, was conducted among early middle-aged adults i.e., 30-50 years of age. Based on the prevalence of 26.1% recommended physical activity, the sample size was calculated to be 296. Standard Global Physical Activity Questionnaire (GPAQ) was used to assess physical activity pattern.
Results Mean age of the respondents was 39 years. The proportion of people engaged in vigorous activities, at work or for recreation was only 8.5%. Moderate activity at work (16.7% vs 9.5%) and walking/ bicycling while travel to and from places (63.9% vs 38.5%) was more common in rural areas as compared to urban areas. Moderate activity for recreation was however more common in urban areas (31.8% vs 14.6%). Sedentary habits of women in urban areas were unhealthier as compared to women in rural areas as well as men in urban areas.
Conc lusion and Rec ommendations Integration of physical activity at work of people engaged in skilled and professional jobs by instituting minor modifications in the working environment is recommended.
Introduction
Non-communicable diseases (NCDs) account for nearly half of the overall global burden of disease and contribute to six out of every ten deaths [1]. Physical inactivity has been reported to be a major independent Ceylon Medical Journal 2018; 63: 159-168
DOI: http://doi.org/10.4038/cmj.v63i4.8774
modifiable risk factor for NCDs. It has now been identified as the fourth leading risk factor for global mortality, contributing to 6% of deaths globally [2]. The other three risk factors include high blood pressure, tobacco use and high blood glucose, two of which in turn are directly affected by physical activity (PA).
Physical activity is defined as any bodily movement produced by skeletal muscles that substantially elevates energy expenditure [3]. The health benefits of regular (5 times per week) moderate intensity physical activity are well established [4]. Regular PA has been reported to lower blood pressure in adults with hypertension both directly and indirectly through reduction of visceral fat [5,6]. Participation in regular PA has been reported to improve blood glucose control by increasing insulin sensitivity and also prevents or delays onset of type 2 diabetes [7]. Apart from these benefits, adequate PA is also known to increase mental well-being [8].
Physical inactivity levels are rising in many countries including the developing countries [9]. PA can be undertaken in several domains of daily life, including work, transport and leisure time [10]. This distinction is especially important in developing and transitional countries, where recreational PA makes a smaller con-tribution to total energy expenditure than occupational or transportation related activity [11,12]. With the increasing urbanization, availability of modern equipment in day to day life, faster means of communication and commutation, rising living standards, work pressure and non-favorable environmental conditions, the levels of PA are deemed to decrease.
World Health Organization (WHO), in 2010 stated that regular monitoring of the level of PA and physical fitness of the entire population should be considered a public health priority. The measurement of population levels of PA is necessary to guide health promotion initiatives and policy formulation and to assess the impact of large-scale policies and programs designed to increase activity [13].
The present study was undertaken in Dehradun district of Uttarakhand, India, which is a new, small and geographically challenging state and therefore has its unique health profile and risk factors.
This study aims to describe the pattern of PA in early middle-aged population of selected areas of Dehradun district and to examine the association of various socio-demographic and environmental factors with the PA pattern.
Methodology
This was a community based cross sectional study conducted among early middle-aged adults i.e. 30-50 years of age in the selected areas. Middle-aged population is those people between 30 and 64 years of age [14]. The division into early and middle aged adults was arbitrary for the present study. The reason for choosing early middle aged i.e. 30-50 years was because this group is usually the employed/ actively working group and have different lifestyle related factors as compared to the late middle-aged population i.e. 50 to 64 years and the young adults (18 years – 30 years). In addition, NCDs affect Indians, a decade earlier as compared to those in western countries. All those individuals more than or equal to 30 years of age and less than or equal to 50 years of age on the day of interview were included in the study.
Those adults not willing to participate, severely ill, physically handicapped or in special physiological groups such as pregnant and lactating were excluded from the study as their PA levels would be deviated towards lower side and would not be reflective of the normal population. Calculation of sample size was done considering the prevalence of recommended PA of 26.1% as reported in a study in India using the GPAQ questionnaire [15]. Sample size was calculated using the formula [16]: n=(Z2
1-/2 pq)/ L2, where Z
(0.05)=1.96, n=required sample size, p (prevalence rate)= 26.1, q=1-p=73.9, L= least permissible error (absolute precision) of 5%, desired confidence level=95%. Hence sample size = [(1.96) 2 × 26.1 × 73.9] / 5 × 5= 296.26 296. The data was analyzed for 292 respondents due to incomplete responses from four participants.
Multistage stratified sampling was used to select the sample population. Dehradun district is one of the seven districts in Garhwal division of Uttarakhand, a state in North India. The district is divided into six developmental blocks Chakrata, Kalsi, Vikasnagar, Sahaspur, Raipur and Doiwala. One of the blocks was selected and further from this block, one ward (urban) and one sub-centre area (rural) were randomly selected for the study. 296 participants (74 males and females, from both urban and rural areas) were selected randomly for interview after selecting households from the list of households from block headquarters and sub-centre. At each household, two adults, one male and one female in the specified age group were interviewed. In case the house was locked or the respondents were not available in the house, another household was selected.
The interview was conducted in Hindi, the local language. The questionnaire consisted of sociodemo-graphic details, PA assessment, behavioural risk factors, PA related environmental perception, and diagnosed chronic diseases.
Global Physical Activity Questionnaire (GPAQ), which is a validated questionnaire developed by WHO, was used for assessment of PA in adults in field setting [17,18].
Environmental perceptions in relation to PA was assessed using a tool known as “ALPHA measure of environmental perceptions”, which has good reliability and predictive validity [19]. Both the questionnaires were translated in Hindi, the local language, and back trans-lated to ensure accuracy of translation by two independent bilingual translators. Another expert resolved the discrepancies. Same investigator, who knew both the languages, administered the questionnaires, to overcome any interviewer bias.
Data regarding socio-demographic characteristics, behavioural risk factors and chronic diseases was collected through a pre-designed, pre-tested ques-tionnaire, which was pilot tested on a sample of adults and modified accordingly.
Statistical analysis
Data was entered in Microsoft (MS) excel and analyzed using EpiInfo version 7.2.2.6 and SPSS version 23. Bivariate analysis of proportions was done using chi square test and Fischer exact test where applicable. Unadjusted odds ratio (OR) with 95% confidence intervals (CI) were calculated and reported. Binary logistic regression analysis was applied to predict the variables having significant association with VIA/MIA at work and recreation. The results were considered significant at 0.05 level of significance.
Ethical considerations
Ethics clearance for the study was obtained from the institutional ethical committee of the present institute (IEC code 71/STS/2015).
Results
respondents (86.6%) were married, with about two third of them having a nuclear family. About one fourth of the participants had one or the other addictions such as gutka, paan, tobacco chewing, smoking or alcohol drinking. About 28% of respondents in both rural and urban areas suffered from one or more diagnosed chronic diseases. Amongst people suffering from chronic diseases (82 people), hypertension was the commonest reported disease (24.3%) followed by diabetes mellitus and back pain (18.3% each).
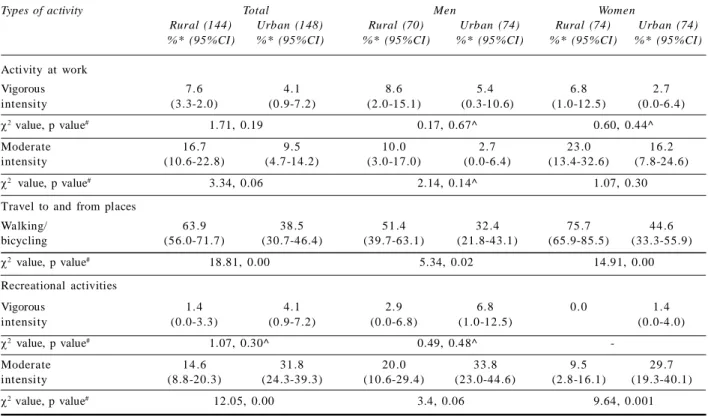
The involvement of people in vigorous intensity activity (VIA) at work (5.8%) was found to be very poor. Only 13% were involved in moderate intensity activity (MIA) at work; rest 81% of the respondents were, either not employed or involved in sedentary work. Another 23.3% of people undertook MIA for recreation, while 2.7% participants undertook VIA, making a total of 26%; rest three fourth of the study participants were not involved in any recreational activity (Table 1).
Significant differences were observed in the proportion of people undertaking MIA for recreation (p<0.001) with respect to locality. Rural people reported using bicycle or walking while travelling more than the urban (p<0.001) and these differences were also observed separately among men (p<0.02) and women (p<0.001) both. On the other hand, more urban people were involved in MIA for recreation (31.8% vs 14.6%). Comparatively higher
proportion of urban women were involved in MIA for recreation as compared to rural women (29.7% vs 9.5%) (Table 1).
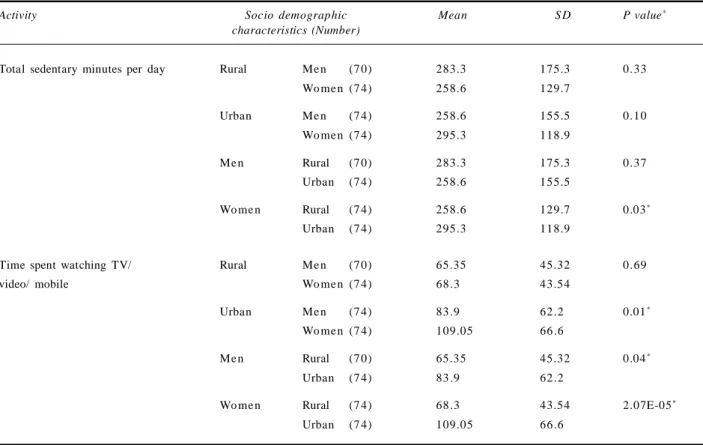
Significant differences were reported between rural and urban women with respect to both the sedentary behaviors, with urban women having higher means (295.3 min vs 258.6 min and 109.05 min vs 68.3 min respectively). Significant differences were also observed between men and women in urban areas with respect to time spent watching TV/ video/ mobile (p<0.01), with women having a higher mean compared to men. Urban men also spent higher time watching TV/ video/ mobile as compared to rural men (83.9 min. vs 65.35 min., p<0.04) (Table 2).
Bivariate analysis for sociodemographic charac-teristics and VIA/MIA at work showed that females, people belonging to reserved categories, lower education levels, unemployed/ homemakers, those with income Rs 20000, and those having a chronic disease were more involved in VIA/ MIA at work as compared to other groups. On applying binary logistic regression, after including these predictors in the model, -2 Log likelihood ratio for regression model was reported to be 207.5 and it could explain 25.5% of the variability in outcome variable. Significant predictors of VIA/MIA at work, as determined by regression were gender (OR 3.3), chronic disease (0.63), caste (0.31), and education (0.08) (Table 3).
Table 1. Description of various types of physical activities undertaken according to Global Physical Activity Questionnaire (GPAQ) with respect to locality and gender of the respondents
Activity at work
Vigorous 7.6 4.1 8.6 5.4 6.8 2.7
intensity (3.3-2.0) (0.9-7.2) (2.0-15.1) (0.3-10.6) (1.0-12.5) (0.0-6.4)
2 value, p value# 1.71, 0.19 0.17, 0.67^ 0.60, 0.44^
Moderate 16 .7 9.5 10 .0 2.7 23 .0 16 .2
intensity (10.6-22.8) (4.7-14.2) (3.0-17.0) (0.0-6.4) (13.4-32.6) (7.8-24.6)
2 value, p value# 3.34, 0.06 2.14, 0.14^ 1.07, 0.30
Travel to and from places
Walking/ 63 .9 38 .5 51 .4 32 .4 75 .7 44 .6
bicycling (56.0-71.7) (30.7-46.4) (39.7-63.1) (21.8-43.1) (65.9-85.5) (33.3-55.9)
2 value, p value# 18.81, 0.00 5.34, 0.02 14.91, 0.00
Recreational activities
Vigorous 1.4 4.1 2.9 6.8 0.0 1.4
intensity (0.0-3.3) (0.9-7.2) (0.0-6.8) (1.0-12.5) (0.0-4.0)
2 value, p value# 1.07, 0.30^ 0.49, 0.48^
-Moderate 14 .6 31 .8 20 .0 33 .8 9.5 29 .7
intensity (8.8-20.3) (24.3-39.3) (10.6-29.4) (23.0-44.6) (2.8-16.1) (19.3-40.1)
2 value, p value# 12.05, 0.00 3.4, 0.06 9.64, 0.001
Types of activity Total Men Women
Rural (144) Urban (148) Rural (70) Urban (74) Rural (74) Urban (74)
%* (95%CI) %* (95%CI) %* (95%CI) %* (95%CI) %* (95%CI) %* (95%CI)
*The percentages are calculated column wise. # p value of <0.05 is considered significant. ^ Fisher exact test results are stated as at least one
Another analysis for exploring VIA/ MIA at recreation showed that people from urban locality, males, those with higher education levels, people with employment, those with income > Rs 20000 per month and those without an addiction were more involved in VIA/ MIA for recreation as compared to their counterparts. Binomial logistic regression analysis on including these variables gave a -2 Log likelihood ratio of 259.3 and the model could explain 32.7% of variability in outcome variable. Significant predictors of VIA/MIA at recreation, as determined by regression analysis wer e locality (OR 3.3), gen der (OR 2.76), income (7.94), and absence of addiction (6.93) (Table 4).
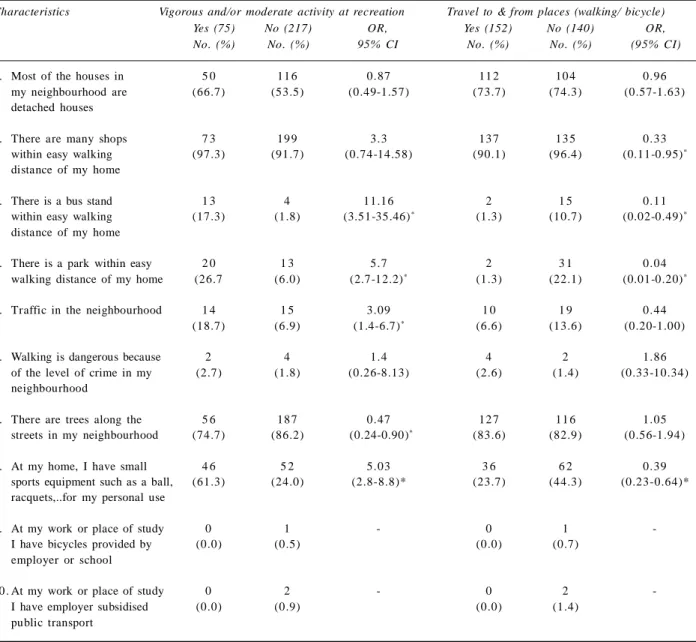
Analysis of association of environmental perception by the respondents with respect to undertaking vigorous and/ or moderate activity at recreation revealed that presence of a bus-stand within easy walking distance (OR, CI= 11.16, 3.51-35.46), or a park (5.7, 2.7-12.2) and possession of sports equipment at home (5.03, 2.8-8.8), traffic in the neighborhood (3.09, 1.4-6.7) had a positive effect on involvement in recreational activities. Presence of trees in the neighborhood did not promote recreational activities (0.47, 0.24-0.90). Presence of shops within walking distance, bus stand, park and playing equipment were negatively associated with travel to and from places by either walking or cycling (Table 5).
Table 2. Description of sedentary behaviour according to GPAQ with respect to locality and gender of the respondents
Activity Socio demographic Mean S D P value*
characteristics (Number)
Total sedentary minutes per day Rural Me n (7 0) 283.3 175.3 0.33
Wo me n (7 4) 258.6 129.7
Urban Me n (7 4) 258.6 155.5 0.10
Wo me n (7 4) 295.3 118.9
Me n Rural (7 0) 283.3 175.3 0.37
Urban (7 4) 258.6 155.5
Wo me n Rural (7 4) 258.6 129.7 0.03*
Urban (7 4) 295.3 118.9
Time spent watching TV/ Rural Me n (7 0) 65.35 45.32 0.69
video/ mobile Wo me n (7 4) 68 .3 43.54
Urban Me n (7 4) 83 .9 62 .2 0.01*
Wo me n (7 4) 109.05 66 .6
Me n Rural (7 0) 65.35 45.32 0.04*
Urban (7 4) 83 .9 62 .2
Wo me n Rural (7 4) 68 .3 43.54 2.07E-05*
Urban (7 4) 109.05 66 .6
Table 3. Association of vigorous and/or moderate and sedentary activity at work with respect to various sociodemographic characteristics
Sociodemographic Vigorous and/or Sedentary activity Unadjusted OR, Adjusted OR
characteristics moderate activity at work (246) (95% CI) (95% CI)
at work (46) %* (95%CI)
%*, (95% CI)
Locality
Rural (144) 18 .7 81 .3 1.56
-(12.4-25.1) (74.9-87.6) (0.83-2.96)
Urban (148)^ 12 .8 87 .2
(7.4-18.2) (81.8-92.6)
Gender
Female (148) 22 .3 77 .7 2.89 3.29
(15.6-29.0) (71.0-84.4) (1.45-5.76)# (1.22-8.85)$
Male (144)^ 9.0 90.97
(4.3-13.7) (86.3-95.7)
Caste
Others (246) 12 .2 87.80 0.26 0.31
(8.1-16.3) (83.7-91.9) (0.13-0.53)# (0.14-0.67)$
SC/ ST/ OBC (46)^ 34 .8 62 .2
(21.0-48.5) (51.5-79.0)
Education
Graduation/Diploma, 1.2 98 .8 0.04 0.08
professional and higher (83) (0.0-3.6) (96.4-100) (0.006-0.33)# (0.01-0.63)$
Other than graduation (209)^ 21 .5 78 .5
(16.5-27.6) (72.5-83.5) Occupation
Unemployed/ homemakers (133) 20.30 79 .7 1.88 1.86
(13.5-27.1) (72.9-86.5) (0.99-3.55)# (0.72-4.78)
Employed (159)^ 11 .9 88.05
(7.8-17.9) (82.1-92.2) Income in Rs.
>20000 (57) 1.8 98 .2 0.07 0.18
(0.0-9.4) (94.8-100) (0.01-0.56)# (0.02-1.44)
20000 (235)^ 19 .2 80 .8
(14.6-24.7) (75.3-85.4)
Marital status
Married (253) 16 .2 83 .8 1.31
-(11.7-20.7) (79.3-88.3) (0.48-3.56)
Single/ Widow (39)^ 12 .8 87 .2
(5.6-26.7) (73.3-94.4)
Type of family
Nuclear (185) 16 .2 83.78 1.10
-(10.9-21.5) (78.5-89.1) (0.56-2.12)
Joint (107)^ 14 .9 85.05
(8.2-21.7) (78.3-91.8)
Addiction
No (221) 16 .3 83.71 1.19
-(11.4-21.2) (78.8-88.6) (0.56-2.53)
Yes (71)^ 14 .1 85.92
(6.0-22.2) (77.8-94.0) Chronic disease
No (210) 12 .9 87.14 0.49 0.635
(8.3-17.4) (82.6-91.7) (0.25-0.94)# (0.31-1.30)
Yes (82)^ 23 .2 76.83
(14.0-32.3) (67.7-86.0)
^Reference category *The percentages are calculated row wise. #Significant Unadjusted Odds ratio-included in regression model. $Significant
Table 4. Distribution of vigorous/moderate and sedentary activity at recreation with respect to various sociodemographic characteristics
Sociodemographic Vigorous and/or moderate Unadjusted Adjusted OR
characteristics activity at recreation OR CI) OR CI)
Yes (75) No (217)
%*, (95% CI) %* (95%CI)
Locality
Urban (148) 35 .8 64 .2 3.09 3.3
(28.1-43.5) (56.5-71.9) (1.76-5.44)# (1.73-6.30)$
Rural (144)^ 15 .3 84 .7
(9.4-21.2) (78.8-90.6)
Gender
Male (144) 31 .3 68 .7 1.79 2.76
(23.7-38.8) (61.2-76.3) (1.05-3.05)# (1.10-6.92)$
Female (148)^ 20 .3 79 .7
(13.8-26.7) (73.3-86.2) Caste
Others (246) 26 .4 73 .6 1.29
-(20.9-31.9) (68.1-79.1) (0.61-2.75)
SC/ST/OBC (46)^ 21 .7 78 .3
(9.8) (66.3-90.2)
Education
Other than graduates (209) 19 .1 80 .9 0.32 0.64
Graduation/Diploma, (14.4-25.0) (74.9-85.6) (0.19-0.56)# (0.28-1.47)
professional and higher (83)^ 42 .2 57 .8
(31.5-52.8) (47.2-68.5)
Occupation
Employed (159) 30 .8 69 .2 1.83 0.96
(24.2-38.4) (61.6-75.8) (1.06-3.16)# (0.38-2.42)
Unemployed/ housewife (133)^ 19 .5 80 .5
(12.8-26.3) (73.7-87.2) I ncome
>20000 (57) 61 .4 38 .6 7.76 7.94
(48.8-74.0) (26.0-51.2) (4.12-14.60)# (3.36-18.79)$
20000 (235)^ 17 .0 83 .0
(12.7-22.3) (77.6-87.2)
Marital status
Married (253) 26 .1 73 .9 1.18
-(20.7-31.5) (68.5-79.3) (0.53 -2.61)
-Single/Widow (39)^ 23 .1 76 .9
(12.6- 38.3) (61.7- 87.3)
Type of family
Nuclear (185) 26 .5 73 .5 1.12
-(20.1-32.8) (67.2-79.9) (0.64 -1.94)
-Joint (107)^ 24 .3 75 .7
(16.2-32.4) (67.6-83.8)
Addiction
No (221) 30 .3 69 .7 3.43 6.93
(24.3-36.4) (63.6-75.7) (1.56 - 7.54)# (2.61-18.37)$
Yes (71)^ 11 .3 88 .7
(3.9-18.6) (81.4-96.1)
Chronic disease
No (210) 25 .2 74 .8 0.92
-(19.4-31.1) (68.9-80.6) (0.52-1.64)
Yes (82)^ 26 .8 73 .2
(17.2-36.4) (63.6-82.8)
Discussion
The present analysis provides valuable insight into patterns and correlates of PA among urban and rural, middle aged population of Doiwala block of Dehradun district. The study observed insufficient PA in 38.7% of the respondents as per WHO recommendations, which is comparable to 42.06% physical inactivity levels reported in recent study done in eleven cities across India [20], 34.2% as reported by Krishna et al in Faridabad (Haryana) [21] and 29.4% as reported by Mittal et al [22]. Activity level of 61.3% reported in our study is also similar to that reported by studies conducted in various countries such as Vietnam (56%), Australia (57-62%), China (66%), Indonesia (67%), Japan (57%), Myanmar (65%), New
Zealand (67-70%), Sweden (69%), and Thailand (59%) [11,23-30]. However, other surveys from India show a higher prevalence of sufficiently active as 77%, 84%, 88% and respectively [26,31,32]. Being a hilly state, it was expected that PA levels would be higher than rest of the country, which was not found to be true.
The extremely poor involvement of people in VIA either at work (5.8%) or for recreation (2.7%) is a matter of concern as it may herald the onset of lifestyle diseases due to physical inactivity.
People in rural areas were more involved in MIA at work and travelling as opposed to urban people who undertook MIA for recreation indicating preferences for different types of activities. In present study, sedentary Table 5. Description of environmental perception by the respondents undertaking vigorous
and/ or moderate intensity activity for recreation based on ALPHA questionnaire
1 . Most of the houses in 5 0 11 6 0.87 11 2 10 4 0.96
my neighbourhood are (66.7) (53.5) (0.49-1.57) (73.7) (74.3) (0.57-1.63) detached houses
2 . There are many shops 7 3 19 9 3.3 13 7 13 5 0.33
within easy walking (97.3) (91.7) (0.74-14.58) (90.1) (96.4) (0.11-0.95)*
distance of my home
3 . There is a bus stand 1 3 4 11.16 2 1 5 0.11
within easy walking (17.3) (1.8) (3.51-35.46)* (1.3) (10.7) (0.02-0.49)*
distance of my home
4 . There is a park within easy 2 0 1 3 5.7 2 3 1 0.04
walking distance of my home (26.7 (6.0) (2.7-12.2)* (1.3) (22.1) (0.01-0.20)*
5 . Traffic in the neighbourhood 1 4 1 5 3.09 1 0 1 9 0.44
(18.7) (6.9) (1.4-6.7)* (6.6) (13.6) (0.20-1.00)
6 . Walking is dangerous because 2 4 1.4 4 2 1.86
of the level of crime in my (2.7) (1.8) (0.26-8.13) (2.6) (1.4) (0.33-10.34) neighbourhood
7 . There are trees along the 5 6 18 7 0.47 12 7 11 6 1.05
streets in my neighbourhood (74.7) (86.2) (0.24-0.90)* (83.6) (82.9) (0.56-1.94)
8 . At my home, I have small 4 6 5 2 5.03 3 6 6 2 0.39
sports equipment such as a ball, (61.3) (24.0) (2.8-8.8)* (23.7) (44.3) (0.23-0.64)* racquets,..for my personal use
9 . At my work or place of study 0 1 - 0 1
-I have bicycles provided by (0.0) (0.5) (0.0) (0.7)
employer or school
10 . At my work or place of study 0 2 - 0 2
-I have employer subsidised (0.0) (0.9) (0.0) (1.4)
public transport
Characteristics Vigorous and/or moderate activity at recreation Travel to & from places (walking/ bicycle)
Yes (75) No (217) OR, Yes (152) No (140) OR,
No. (%) No. (%) 95% CI No. (%) No. (%) (95% CI)
activity levels were similar among men and women in rural areas. Sugathan et al, Agarwal VK et al and Haldiya KR et al have also reported no significant gender differences [33-35]. However, some studies have shown female preponderance towards physical inactivity, as observed in our study in urban areas [21,22,36,37].
Men reported to be more inactive at work in our study, which is primarily due to their engagement in more skilled and professional jobs nowadays. Females on the other hand were involved in MIA while undertaking household chores. Association of lower education and income with VIA/MIA at work is quite understandable. The association of reserved caste with higher VIA/MIA at work indicates its association to various jobs involving intensive labour. Association of VIA/MIA with chronic diseases was obliterated on regression analysis.
As expected, VIA/MIA for r ecr eation was correspondingly lesser in rural area, among females, those with lower income since these group of people were primarily engaged in VIA/MIA at work as stated above, leaving less time to be involved in these activities.
Overall proportion of people involved in VIA/MIA at recreation was only 26%, which is relatively lower, given the fact that India is standing at the edge of facing an epidemic of NCDs. However, this figure is higher than 10% as reported in ICMR-INDIAB study [15]. There is similar situation in China [38], where only 28.9% of rural residents and 7.9% of urban residents reported leisure time PA. In Vietnam and Brazil also, the prevalence of physical inactivity in the recreational domain was found to be 90.6% and 80.7% respectively [11,39]. This type of association has been reported in several international studies also [40-43]. However, it is not possible to say with certainty that high-SES individuals are more active to an extent that benefits their health.
Negative association of presence of bus stand and travelling by walking/bicycling is understandable, as people would prefer bus, to walking down. Similarly, presence of parks had a negative association again due to their presence in urban areas, where people travel less on feet/ bicycle.
The sociodemographic factors could only explain 25-32% of variability in VIA/MIA at work and recreation, indicating that irrespective of the sociodemographic characteristics, every person can adopt a more active life style.
Limitations
The assessment of PA levels was based on people’s responses and therefore could overestimate the activity levels. Also, being a cross sectional study, on a limited population, confounding effect of various factors on PA levels could not be studied and the results cannot be generalized to whole Uttarakhand.
Recommendations
Integration of PA at work of people engaged in skilled and professional jobs by instituting minor modifications in the working environment is recommended. For improving the activity levels, a 10-15 minutes routine workout at the institution for all the employees capable of undertaking the exercise may be made mandatory as in metropolitan cities.
Acknowledgements
The authors are deeply obliged to ICMR for supporting this study as a part of STS project. We also extend our heartfelt gratitude to the Director, Dean, AIIMS, Rishikesh and HOD, Department of Community and Family Medicine, AIIMS, Rishikesh for their unending support, which made the accomplishment of this project possible. Lastly, we acknowledge the participants for sparing their valuable time and for being a part of this project.
References
1. The global burden of disease: 2004 update. World Health Organization, Geneva, 2008.
2. Global health risks: mortality and burden of disease attributable to selected major risks. Geneva, World Health Organization, 2009.
3. Aust NZJ, MedCaspersen CJ, Powell KE, Christenson GM. Physical activity, exercise, and physical fitness: Definitions and distinctions for health-related research. Public Health Rep 1985; 100(2): 126-31.
4. Willett WC, Koplan JP, Nugent R, Dusenbury C, Puska P, Gaziano TA. Prevention of chronic disease by means of diet and lifestyle changes in disease control priorities in developing countries. 2nd edition. Edited by Jamison DT, Breman JG, Measham AR, Alleyne G, Claeson M, Evans DB, Jha P, Mills A. Washington (DC): Musgrove P; 2006.
5. Ishikawa K, Ohta T, Zhang J, Hashimoto S, Tanaka H. Influence of age and gender on exercise training-induced blood pressure reduction in systemic hypertension. Am J Cardiol 1999: 84(2): 192-6.
6. Reaven PD, Barrett-Connor E, Edelstein S. Relation between leisure-time physical activity and blood pressure in older women. Circulation 1991; 83(2): 559-65.
7. Hamman RF, Wing RR, Edelstein SL, Lachin JM, Bray GA, Delahanty L, Hoskin M, Kriska AM, Mayer-Davis EJ, Pi-Sunyer X. Effect of weight loss with lifestyle intervention on risk of diabetes. Diabetes Care 2006; 29(9): 2102-7.
8. Fox KR. The influence of physical activity on mental well-being. Public Health Nutr 1999; 2(3A):411-18.
10. Armstrong T, Bauman A, Davies J. Physical activity patterns of Australian adults. Canberra: Australian Institute of Health and Welfare; 2000.
11. Trinh OT, Nguyen ND, Dibley MJ, Phongsavan P, Bauman AE. The prevalence and correlates of physical inactivity among adults in Ho Chi Minh City. BMC Public Health 2008; 8: 204.
12. Hallal PC, Victoria CG, Wells JCK, Lima RC. Physical inactivity: prevalence and associated variables in Brazilian adults. Med Sci Sports Exerc 2003; 35(11): 1894-900.
13. Bauman A, Phongsavan P, Schoeppe S, Owen N. Physical activity measurement – a primer for health promotion. Promot Educ 2006; 13(2): 92-103.
14. Enlund H, Nissinen A, and Tuomilehto J. Antihypertensive drug treatment in a middle-aged population. Hypertension 1982; 4 (5): 716-24.
15. Anjana et al. Physical activity and inactivity patterns in India – results from the ICMR-INDIAB study (Phase-1) [ICMR-INDIAB-5]. International Journal of Behavioral Nutrition and Physical Activity 2014; 11: 26.
16. Lawanga SK, Lemeshaw S. Sample size determination in health studies: A practical manual. Geneva.WHO; 1991.
17. World Health Organization. Global Physical Activity Questionnaire (GPAQ) analysis guide. Available from: http:/ /www.who.int/ch p/steps/resources/GPAQ_ Analysis_ Guide.pdf. Accessed on 18.01. 2015.
18. Bull FC, Maslin TS, Armstrong T. Global physical activity questionnaire (GPAQ): nine country reliability and validity study. J Phys Act Health 2009, 6(6): 790-804.
19. Spittaels H, Verloigne M, Gidlow C, Gloanec J, Titze S, Charlie F, et al. Measuring physical activity-related environmental factors: reliability and predictive validity of the European environmental questionnaire ALPHA. International Journal of Behavioral Nutrition and Physical Activity 2010; 7(1): 48.
20. Gupta R, Deedwania PC, Sharma K, Gupta A, Guptha S, Achari V, et al. Association of Educational, Occupational and Socioeconomic Status with Cardiovascular Risk Factors in Asian Indians: A Cross-Sectional Study. PLoS ONE 2012; 7(8): e44098.
21. Krishnan A, Shah B, Lal V, Shukla DK, Paul E, Kapoor SK. Prevalence of risk factors for non-communicable disease in a rural area of Faridabad district of Haryana. Indian J Public Health 2008; 52(3): 117-24.
22. Mittal M, Arora M, Bachhel R, Kaur N, Sidhu RS. Physical activity, indices of obesity and mean arterial blood pressure: Does place of living matters? rural vs urban. J Clin Diagn Res 2011; 5(5): 1038-42.
23. Bauman A, Bellew B, Vita P, Brown W, Owen N. Getting Australia active: towards better practice for the promotion of physical activity Melbourne: National Public Health Partnership; 2002.
24. Mutner P, Donfeng G, Wildman RP, Chen J, Qan W, Whelton PK, He J. Prevalence of physical activity among Chinese adults: Results of the international collaborative study of
cardiovascular disease in Asia. Am J Public Health 2005; 95(9): 1631-6.
25. Centre for Disease Control Research and Development; NIHRD Ministry of Health Republic of Indonesia; World Health Organisation: Final Report. Integrated Community Based Intervention on Major NCDs in Depok Municipality Geneva: World Health Organisation; 2003.
26. Bauman A, et al. The International Prevalence Study on Physical Activity: results from 20 countries. Int J Behav Nutr Phys Act 2009; 6: 7-11.
27. World Health Organisation: WHO STEPwise approach to NCD surveillance. Myanmar. Disaggregation of urban and rural data (rural) 2003 Geneva: World Health Organisation; 2003.
28. New Zealand Government. SPARC trends: trends in participation in sport and active leisure, 1997-2001 Wellington: New Zealand Government; 2003.
29. Bergman P, Grjibovski AM, Hagstromer M, Bauman A, Sjostrom M. Adherence to physical activity recom-mendations and the influence of socio-demographic correlates – a population based cross-sectional study. BMC Public Health 2008; 8: 367.
30. Macniven R, Bauman A, Abouzeid M. A review of population-based prevalence studies of physical activity in adults in the Asia-pacific region. BMC Public Health 2012; 12: 41.
31. Shah B, et al. Development of Sentinel Health Monitoring Centres for Surveillance of Risk Factors of Noncom-municable Diseases in India (April 2003 to March 2005): Collated Results of 6 Centres. Indian Council of Medical Research: New Delhi; 2005.
32. Guthold R, Ono T, Strong KL, Chatterji S, Morabia A. Worldwide variability in physical inactivity a 51-country survey. Am J Prev Med 2008; 34(6): 486-94.
33. Sugathan TN, Soman CR, Sankaranarayanan K. Behavioural risk factors for non communicable diseases among adults in Kerala, India. Indian J Med Res 2008; 555-63.
34. Agrawal VK, Basannar DR, Sing RP, Dutt M, Abraham D, Mustafa MS: Coronary risk factors in a rural community. Indian J Public Health 2006; 50(1): 19-23.
35. Haldiya KR, Mathur ML, Sachdev R. Lifestyle-related risk factors for cardiovascular disease in a desert population of India. Indian J Med Res 2014; 139(2): 252-9.
36. Sullivan R, Kinra S, Ekelund U, Bharathi AV, Vaz M, Kurpad A, Collier T, Reddy KS, Prabhakaran D, Ben-Shlomo Y, et al. Socio-demographic patterning of physical activity across migrant groups in India: results from the Indian Migration Study. PLoS One 2011; 6(10): e24898.
37. Agrawal R, Chaturvedi M, Singh S, Gu pta SC. An epidemiological study of dietary and exercise habits as correlates of hypertension in persons aged 45 years and above in Agra District. Indian J Comm Health 2012; 24(2): 91-6.
of Cardiovascular Disease in Asia. American Journal of Public Health 2005; 95(9): 1631-6.
39. Dias-da-Costa JS, Hallal PC, Wells JCK, Daltoe T, Fuchs SC, Menezes AMB, Olinto MTA. Epidemiology of leisure-time physical activity: a population based study in southern Brazil. Cadernos de Saúde Pública 2005; 21(1): 275-82.
40. President's Council on Physical Fitness and Sports: National Adult Physical Fitness Survey. Phys Fitness Res Digest 1974; 4: 1-27.
41. Statistics Canada. Culture statistics/recreational activities 1976. Catalog No. 87-501, occasional. Minister of Supply and Services, Ottawa, 1980, (a) pp. 16,45.
42. Canada Fitness Survey: Fitness and lifestyle in Canada. Canada Fitness Survey, Ottawa, May 1983.