DISCOUNTING DISENTANGLED
Moritz A. Drupp
1, Mark C. Freeman
2,
Ben Groom
3and Frikk Nesje
4∗December 22, 2017
The economic values of investing in long-term public projects are highly sensitive to the social discount rate (SDR). We surveyed over 200 experts
to disentangle disagreement on the risk-free SDR into its component parts,
including pure time preference, the wealth effect and return to capital. We
show that the majority of experts do not follow the simple Ramsey Rule,
a widely-used theoretical discounting framework, when recommending SDRs.
Despite disagreement on discounting procedures and point values, we obtain a
surprising degree of consensus among experts, with more than three-quarters
finding the median risk-free SDR of 2 percent acceptable.
Keywords: Social discount rate, project appraisal, expert opinions, simple
Ramsey Rule, disagreement.
JEL codes: H43, D61, Q58.
We report the results of a survey of experts on “one of the most critical
problems in all of economics” (Weitzman 2001: 260) about which there has
been a great deal of disagreement: the long-term social discount rate (SDR).
The sample contains over 200 academics who are defined as experts on social
discounting by virtue of their publications. A key innovation of our survey
is that we elicit information on the fundamental determinants of the SDR,
which allows us to disentangle the main sources of disagreement. The experts’
acceptable ranges for the SDR are also elicited, which allows an examination
of whether there is any space for agreement on discounting. Our findings
lead us to the conclusion that current policy guidance on the evaluation of
long-term public projects—such as climate change mitigation and long-lived
infrastructure—requires substantial revision, in particular, a departure from
the simple, deterministic Ramsey Rule.
The appropriate SDR and the procedure for its calculation have long been
a source of disagreement among economists. Historically, economists have
found themselves either stumbling around in the “dark jungles of the second
best” in pursuit of an answer or accused of “stoking the dying embers of the
British Empire” if they claim to find one (Baumol 1968: 789; Nordhaus 2007:
691). Such disagreements resurfaced after the recommendations of the Stern
Review on the Economics of Climate Change proved to be extremely sensitive
to the choice of the SDR (Nordhaus 2007, 2008; Stern 2007). The extent
of disagreement was book-ended by Stern’s normative (prescriptive) position
which lead to a central SDR of 1.4%, and Nordhaus’ positive (descriptive)
position, which lead to a long-term SDR of 4.5%. These opposing positions
lead to radically different views on the appropriate level of climate change
It is for reasons like these that discounting the distant future is viewed as
such a “critical problem”. Yet, aside from these well publicized cases, we lack
a good understanding of the extent and the sources of this disagreement. A
survey by Weitzman (2001) provided some indication of the extent of
disagree-ment by asking over 2000 economists for the appropriate “real interest rate”
for the analysis of climate change mitigation: responses ranged from -3% to
27%. Yet, the Weitzman survey was silent on the reasons for this huge
varia-tion in opinion, even on whether respondents were using positive or normative
principles to inform their response. Such information is crucial to
understand-ing the basis for SDRs and the principles that guide long-term policy analysis.
Our study is motivated by the need for more clarity on this issue.
In order to disentangle the causes of disagreement on the SDR we
struc-ture the survey around a well-known framework for inter-temporal welfare
evaluations: Time Discounted Utilitarianism and the simple Ramsey Rule.
Specifically, we elicit expert responses on two key components of the SDR:
the pure rate of time preference and the elasticity of marginal utility. In
ad-dition to these “central normative parameters” (Nordhaus 2008: 33), we ask
experts to estimate growth and the risk-free rate of interest. In this way we
obtain information on both positive and normative arguments for the SDR
(Arrow et al. 1996, 2012). These concepts are familiar to economists working
on discounting, but also have the merit of being policy relevant.1 Importantly
though, we allow sufficient flexibility for experts not to be constrained by the
simple Ramsey Rule when making their recommendations on the SDR. This
flexibility is particularly crucial as it is to be expected that experts have varied
views on how to calculate SDRs. For example, our parsimonious survey was
designed such that experts did not have to tackle the thorny issue of project
risk, by asking for a SDR with which to discount certainty-equivalent cash
flows. Yet allowing for flexibility in responses allowed macroeconomic sources
of risk and uncertainty to be factored in by experts when recommending
ap-propriate ‘risk-free’ SDRs for certainty-equivalents.
The responses make for interesting reading. The median (mean)
recom-mended SDR of our experts is 2 percent (2.3 percent). This is substantially
lower than the median (mean) values of 3 percent (4 percent) reported by
Weitzman (2001).2 We also find that there remains substantial disagreement
over this value, with individual recommendations ranging between 0 and 10
percent. Despite this, 92 percent of experts report that they would be
com-fortable with a SDR somewhere in the interval of 1 percent to 3 percent, and
over three-quarters find a SDR of 2 percent acceptable.
Looking at the empirical distributions of individual discounting
determi-nants, we find that expert opinion is particularly varied on the rate of pure
time preference. The modal value is zero, in line with many prominent
opin-ions. But with a median (mean) of 0.5 percent (1.1 percent), we cannot confirm
the IPCC’s (2014: 229) conclusion that there is“a broad consensus for a zero
or near-zero pure rate of time preference”. Also, while we find that experts
recommend placing greater weight on normative than positive issues when
determining the SDR, most believe that the SDR should be informed by both.
An unambiguous result of our survey is that the prominence of the simple
Ramsey Rule in public policy needs to be revisited. When we impute the
simple Ramsey Rule for all experts individually, we find wide discrepancies
between these values and their recommended SDRs. The rich body of
tive responses provided by our experts explains the need for long-term public
decision-making to depart from the confines of this framework. Accounting for
a comprehensive set of technical issues, such as the inherent uncertainties and
changing relative prices of non-marketed goods, was one set of recommended
departures. Stressing the importance of different societal criteria, which
em-body broader notions of intergenerational equity and sustainability, was
an-other. A third set of recommendations aimed at ensuring that decision-making
is participatory and takes a more procedural approach.
Indeed, many argue for a more “democratic” approach to informing
govern-mental guidance on social discounting (e.g. Dasgupta 2008: 158). Yet, because
the questions raised by long-term cost-benefit analysis are highly complex,
there are also arguments for so-called “genuine specialists” (Pindyck 2017;
Sunstein 2014: 550) to play an active role. The opinions of experts play an
important role in public policy. Numerous expert panels held in recent years
show that social discounting is no exception.3 Precisely because discounting
policy is so often influenced by such specialists, it is imperative to obtain a
more complete picture of the range of opinions they hold. By presenting the
responses of a large number of experts on the determinants of the long-term
SDR, we contribute to the ongoing academic debate over improving approaches
to intergenerational decision-making. We also provide detailed information for
the discounting policy revisions taking place in several countries.
I.
Survey Design
A.
Conceptual Background
Even a cursory glance at the literature on long-term decision-making
re-veals a multitude of conceptual approaches which could lead to different
rec-ommendations for the SDR. Some disagreement revolves around which rate of
return to capital or interest rate best describes the opportunity cost of public
investment. On the normative side, approaches such as Time Discounted
Util-itarianism (TDU) and PriorUtil-itarianism, are consequentialist. Other approaches
add procedural rules, such as sustainablility requirements, to a
consequential-ist framework (see, for example, Asheim and Mitra 2010; Chichilnisky 1996).
In each case extensions and variants abound.4
Our survey allows respondents to provide qualitative responses which could
reveal the fine-grained details of their particular perspectives on
intergenera-tional decision-making. However, the main part of the survey is structured
around TDU, as it provides a clear means of disentangling key sources of
disagreement on the SDR in terms of widely-understood concepts.
The standard TDU social welfare function, W0, takes the following form
W0 =
Z T t=0
exp(−δt)U(Ct) dt, (1)
where welfare at time 0 depends on all future time-separable utilities of a
representative agent whose utility depends on comprehensive real per-capita
consumption Ct. Utility is discounted at a constant rate of pure time
prefer-ence, δ, which determines how much weight is placed on future utilities from
today’s perspective. A frequently-used simplifying assumption is that utility
is isoelastic: U(Ct) = (1−η)−1(C1
−η
t −1) if η 6= 1 and U(Ct) = ln(Ct) if
η = 1. Here, η is the constant elasticity of marginal utility of consumption,
which reflects how averse society is to the differences in consumption that arise
over time due to growth.5
The TDU framework thus captures some key features of the inter-temporal
trade-offs that society faces and can lead to a simple social discounting rule
known as the Ramsey Rule (Ramsey 1928):
r=δ+η g, (2)
where r is the risk-free return to capital, and g is the real, per-capita,
growth rate of consumption. This optimality condition equates the returns
to saving/investment in risk-free capital on the production side (r) with the
welfare-preserving inter-temporal trade-off on the consumption side (δ+η g).
The latter is the exact solution to the first order condition of the optimal
consumption problem with a constant growth rate, g = gt = t−1ln(ct/c0).
Although speaking to optimal saving, the Ramsey Rule also provides a
the-oretical foundation within TDU for determining the SDR in the absence of
uncertainty (Arrow et al. 2012).
Disagreement on long-term discounting often focuses on the two key
wel-fare parameters, δ and η, and their normative-positive content. There is also
disagreement about the role of r in social discounting (Arrow et al. 1996;
Nordhaus 2007). Two main interpretations of this rule in this context are in
common use. First, the opportunity cost of capital approach focuses on the
trajectory of the risk-free capital stock, and its rate of return r:
SDR=r, (3)
which anchors the SDR to the yield on relatively risk-free assets, e.g.
gov-ernment bonds. This approach relates to the ‘positive’ approach to social
discounting followed by the US Environmental Protection Agency (US EPA
2010), among others.
The second approach concerns the trajectory of consumption and asks how
to optimally distribute the returns of a marginal project over time. In a
de-terministic world this consumption-side approach leads to the simple Ramsey
Rule (SRR):
SDR=SRR=δ+η g, (4)
leading to two reasons why society might discount the future: the rate of
societal pure time preference, δ; and a ‘wealth effect’, η×g, which captures
the idea that society may place less weight on future net benefits if the future is
more wealthy. The SRR is typically considered to be the ‘normative’ approach,
and is the interpretation followed by Her Majesty’s Treasury in the UK (HMT
2003) and the German Environmental Agency (UBA 2012), for instance.
While the deterministic structure is helpful to organize ideas on social
discounting and to pin down some main sources of disagreement within a
parsimoniously structured survey, it is clear that long-term public
decision-making has to deal with uncertainty. At the very least, two types of uncertainty
matter: one that relates to the growth rate of consumption and another that
relates to the payoffs from the marginal project itself. For example, if growth in
each year is independently and identically Normally distributed, an extended
SDR=ERR=δ+η¯g−0.5η(η+ 1)σ2, (5)
with ¯g = µ + 0.5σ2, where µ is the mean of real, per-capita logarithmic
consumption growth and σ2 is its variance (Gollier 2012). Uncertainty in
growth reduces the risk-free SDR for a prudent social planner for precautionary
reasons, with the precautionary effect given by −0.5η(η+ 1)σ2.6
While the ERR captures the basic idea of the precautionary effect, equation
(5) is based upon a rather limited expression of growth uncertainty. Stronger
precautionary effects could emerge if it is expected that large, non-marginal
and possibly persistent shifts in growth are possible, such as would be
experi-enced in a major depression. Barro (2006) models a growth process with the
prospect of such events and illustrates the reduction in the risk-free rate that
this would entail.7 In the long-term context in which our survey takes place,
growth processes like this could play an important part in determining the
appropriate risk-free SDR, and may underpin responses from our experts.
Another important element of uncertainty is project specific risk: the risk
associated with the project benefits. Because the focus of this study is purely
on the components of the risk-free SDR, it is important that the survey is able
to abstract from project specific risks so that the risk-free elements of the SDR
can be isolated. For instance, in finance it would be typical to deploy a project
specific discount rate. This would contain a positive (negative) risk premium
6A planner is prudent if the third derivative of the utility function is positive. According to Gollier (2012: Table 3.3), the global average precautionary effect amounts to -1 percent. 7Gollier (2012: 75-76) provides a simple example of the point made by Barro (2006). If
λrepresents the growth shock as an instantaneous percentage loss of GDP, which happens with a probability p, and growth otherwise (with probability 1−p) follows a Brownian motion, the appropriate risk-free SDR becomes:
on top of the risk-free rate to reflect a positive (negative) correlation of the
project payoffs with the returns from a market portfolio. The Capital Asset
Pricing Model (CAPM) model provides a central theoretical foundation for this
approach. In the context of the Ramsey framework, the consumption-based
CAPM model recommends a similar adjustment, except that the risk premium
would now reflect the correlation of the project’s benefits with consumption
growth in the macroeconomy. A survey which could elicit project specific
risk premiums would require an extensive array of questions on different types
of projects. Yet our concern is with the risk-free SDR, which is a common
element of the SDR for the appraisal of all projects.8
In order to focus on disagreement regarding key elements of the risk-free
SDR, we frame the survey around certainty-equivalent values. This isolates
the risk-free SDR because costs and benefits that are presented in
certainty-equivalent terms should be discounted at a risk-free rate.9 Using certainty
equivalence facilitates a parsimonious survey which elicits elements of the
risk-free rate without drawing out the additional complexities raised when
estimating project-specific discount rate risk-premia.10
Beyond the question of uncertainty, a number of other extensions are
8In the Discussion section, we further explain that the risk-free component of the SDR is a crucial component even when discounting expected cash-flows at a risk-adjusted rate.
possible—such as accounting for the changing relative prices of non-market
goods (Gollier 2010; Traeger 2011) or declining discount rates (Arrow et al.
2013)—as well as alternative approaches outside of Time Discounted
Utili-tarianism. Importantly, by eliciting the SDR separately from the individual
components of the simple Ramsey Rule, and by including the option for
quali-tative responses, the survey does not force experts into the Procrustean bed of
the simple Ramsey Rule. Flexibility in the way in which experts could respond
allows for many different possible rationales to be expressed.
B.
The Survey Questions
The survey asked respondents about the SDR and some of its fundamental
determinants.11 The questionnaire began with the following contextual
pream-ble, followed by seven brief quantitative questions and an optional comments
section for qualitative responses:
Imagine that you are asked for advice by an international
govern-mental organization that needs to determine the appropriate real
social discount rate for calculating the present value of
certainty-equivalent cash flows of public projects with intergenerational
con-sequences.
For its calculations, the organization needs single values for the
components of the real social discount rate. While this does not
capture all of the important complexities of social discounting, it
does reflect most existing policy guidance on the matter. Your
an-swers will therefore help to improve the current state of
decision-making for public investments.
Specifically, you are asked to provide your recommendations on the
single number, global average and long-term (>100 years) values
of the following determinants of the social discount rate:
1. Growth rate of real per-capita consumption [X% per year].
2. Rate of societal pure time preference (or utility discount rate) [X%].
3. Elasticity of the marginal utility of consumption [X].
4. Real risk-free interest rate [X% per year]. Remember that this should be
a global average and long-term forecast.
5. What relative weight (summing up to 100%) should the governmental
body place on the following rationales for determining the social discount
rate:
(a) Normative issues, involving justice towards future generations [X%],
and
(b) Descriptive issues, involving forecasted average future returns to
fi-nancial assets [X%]?
6. What is your recommended real social discount rate for evaluating the
certainty-equivalent cash flows of a global public project with
intergener-ational consequences [X% per year]?
7. What minimum and maximum real social discount rate would you be
comfortable with recommending [X% to X percent per year]?
8. Do you have any additional comments [X]?
Questions 1–2 elicited responses on the two key normative parameters δ
andη. Questions 3-4 asked for forecasts of the long-term global average growth
rate of real per-capita consumption, g, and real interest rate, r. Question 6
asked for the point-value of the SDR that should be recommended for
with intergenerational consequences. The open comments section, Question
8, allowed for feedback on the survey, where respondents could, and often did,
point towards various deviations from the simple Ramsey rule.
Question 5 elicited information about each respondent’s approach to
dis-counting by asking for the relative weight that the governmental body should
place on normative versus positive approaches to determining the SDR.
Re-sponses were measured on a sliding scale from 0 to 100 percent. This explores
the disagreement in rationales that has been evident at least since Arrow et
al. (1996): whether normative issues, involving intergenerational ethics and
justice, or positive issues, involving forecasted future returns to financial
as-sets, or a mixture of both should determine the SDR. Importantly, the sliding
scale admits many interpretations of normative and positive other than those
associated with the Ramsey Rule. For instance, responses could reflect the
relative weight that respondents place on different consequentialist or
deonto-logical ethical frameworks. Finally, in Question 7 we asked for the minimum
and maximum values of the SDR that respondents would be comfortable with
recommending, in order to elicit an ‘agreeable range’.
C.
Expert Selection and Survey Dissemination
Because our survey aimed at disentangling the determinants of the
long-term SDR, we restricted our sample to scholars who have been involved with
these complex issues. For the purposes of this paper, an individual is deemed
to be a potential ‘expert’ if he or she is a (co-)author of at least one pertinent
publication in the field of (social) discounting in a leading economics journal.
A journal was classified as ‘leading’ if, according to the ranking of 600
or higher, together with the topical Review of Environmental Economics and
Policy. This amounts to 103 peer-reviewed journals. A publication is deemed
to be ‘pertinent’ if it was published between January 2000 and March 2014
and, according to the Google Scholar engine, included at least one of the terms
‘social discounting’, ‘social discount rate’ or ‘social discount factor’.12
Correct-ing for scholars with multiple publications, and discardCorrect-ing papers that did not
pass a weak relevancy test, our sample includes 627 potential experts.13
There are a number of limitations to this selection strategy. First, by
re-stricting the search to publications since the year 2000 to only capture
schol-ars active in the current debate on social discounting, we potentially miss
some relevant earlier contributors. Second, by selecting experts based on their
publications, we necessarily include co-authors of relevant papers who are not
themselves experts on discounting. Third, due to the rather generous weak
rel-evancy test, we include a number of scholars who might not regard themselves
as true experts on the issue. Fourth, we do not pick up relevant publications
in the field that have used other terms to discuss discounting. Finally, we miss
potentially relevant articles in lower-ranked journals.14 This may introduce a
geographical bias into our sample by under-representing those from
develop-ing nations. Despite these possible short-comdevelop-ings, the definition of expert that
we deploy here is close to the one frequently used by policy makers, both in
general policy contexts and in relation to social discounting.
12To obtain a broader set of potential experts, we further performed a search based on abstracts for the term ‘discount rate’ within the same journals in EconLit. Using EconLit allowed restricting the search to more relevant papers that already discussed discounting in the abstract (a general Google Scholar search for the term ‘discount rate’ yields more than 300 000 hits, containing a large number of irrelevant papers that would need to be manually evaluated). Of the 627 potential experts, 219 were obtained through the EconLit search.
13See Supplementary material B for further details on the selection procedure.
Starting in May 2014, we sent out a link to the online survey (implemented
in SurveyMonkey) via e-mail to all potential experts, and used three general
rounds of reminders, each time slightly varying the subject line and motivation
for answering the survey.15 In later rounds, we offered the option of completing
the survey in a Word document or in the e-mail itself to increase flexibility.
II.
Survey Results
Table 1 provides summary statistics for expert responses. By November
2014 we had received responses from 197 experts, including 12 who solely
provided qualitative feedback containing important insights. We also received
replies from 27 scholars explaining why they did not answer the survey, without
warranting inclusion as qualitative responses.16 Responses were also obtained
after the survey closed from 38 previous non-respondents. This group is used
to check for non-response bias. Following several standard procedures to test
for non-response bias, we find no systematic unidirectional biases for SDR
recommendations (see Appendix A.).
Overall, we elicited 262 responses out of a pool of 627 potential experts.
The response rate is 30 percent if we only consider the 185 quantitative
re-sponses. If we include all responses, the rate rises to 42 percent. Each is in
line with comparable online surveys with economists (Necker 2014). Besides
this, the sampling strategy was successful in obtaining responses from ‘blue
ribbon’ academic leaders on social discounting, including 12 of the 13 experts
of the Arrow et al. (2012) panel who advised the US EPA on this matter.
15Supplementary material C provides the initial e-mail text.
Table 1: Descriptive Statistics on Survey Results
Variable Mean StdD Median Mode Min Max N
Real growth rate per capita 1.70 0.91 1.60 2.00 -2.00 5.00 181 Rate of societal pure time 1.10 1.47 0.50 0.00 0.00 8.00 180 preference
Elasticity of marginal utility 1.35 0.85 1.00 1.00 0.00 5.00 173 Real risk-free interest rate 2.38 1.32 2.00 2.00 0.00 6.00 176
Normative weight 61.53 28.56 70 50 0 100 182
Positive weight 38.47 28.56 30 50 0 100 182
Social discount rate (SDR) 2.27 1.62 2.00 2.00 0.00 10.00 181 SDR lower bound 1.12 1.37 1.00 0.00 -3.00 8.00 182 SDR upper bound 4.14 2.80 3.50 3.00 0.00 20.00 183
Quantitative responses 185
Qualitative responses 100
Responses used for analysis 197
Explained non-responses 27
Bias-check responses 38
Total number of responses 262
Note: “StdD” refers to standard deviation and “Min” (“Max”) to minimum (maximum) recommendation.
A.
Quantitative Responses
A.1 Recommended Long-Term Social Discount Rate
In recent years, prominent experts such as Gollier (2012), Nordhaus (2008),
Stern (2007) and Weitzman (2007) have proposed very different SDRs.
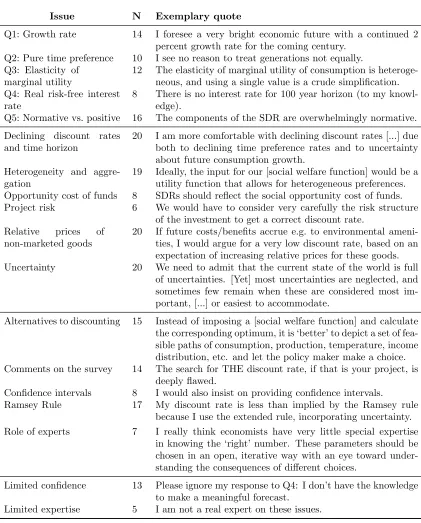
Fig-ure 1 (a) illustrates the extent of disagreement on the SDR for discounting real
certainty-equivalent cash flows of a global public project with intergenerational
consequences. The lowest recommendation is 0 and the highest 10 percent.
However, the vast majority of experts provide point recommendations in the
SDR recommendations of 68 percent of experts. The mean (median) value
of the recommended SDR are 2.27 percent (2 percent), which are much lower
than the corresponding values from Weitzman’s (2001) survey of economists
of 3.96 percent (3 percent). Yet the most common single value recommended
in these two different surveys is 2 percent. These results deviate substantially
from the discount rates recommended in important recent guidelines, including
the IPCC Fifth Assessment Report (IPCC 2014: 230).
A.2 Rate of Societal Pure Time Preference
Positions on the rate of societal pure time preference, δ, have historically
been the subject of intense disagreement. Luminaries of economics, such as
Pigou, Ramsey and Harrod, believed that the well-being of each generation
ought to be weighted equally, and so pure time preference should be zero. This
view stems from their classical impartial Utilitarian philosophy. Disagreement
surfaced again more recently with the publication of the Stern Review (Stern
2007), which took a similar stance. Many alternative arguments exist for the
use of a positive rate of societal pure time preference (e.g. Arrow 1999;
Koop-mans 1960; Nordhaus 2007). Figure 1 (b) shows substantial disagreement
among experts on their chosen value for this parameter. As the modal value,
0 percent is a focal point, and, if we include those responses that lie in the
range of 0 to 0.1 percent, 38 percent take what might be called the
Ramsey-Stern view. Yet, the distribution of responses is substantially right-skewed
with a median of 0.50 percent, a mean of 1.10 percent and a maximum
recom-mendation of 8 percent. Based on these results, we cannot confirm the IPCC’s
(2014: 229) conclusion that “a broad consensus for a zero or near-zero pure
0
.1
.2
.3
Density
0 2 4 6 8 10
Real social discount rate (in %)
(a) 0 .2 .4 .6 .8 1 Density
0 2 4 6 8
Rate of societal pure time preference (in %)
(b) 0 .2 .4 .6 .8 1 Density
0 1 2 3 4 5
Elasticity of the marginal utility of consumption
(c) 0 .1 .2 .3 .4 .5 .6 .7 .8 Density
−2 0 2 4 6
Growth rate of real per capita consumption (in %)
(d) 0 .2 .4 .6 .8 Density
0 2 4 6
Real risk−free interest rate (in %)
(e) 0 .01 .02 .03 .04 Density
0 20 40 60 80 100 Normative weight for determining the real SDR (0−100%)
[image:18.612.117.512.91.603.2](f)
A.3 Elasticity of the Marginal Utility of Consumption
Settling on a value of the elasticity of the marginal utility of consumption,
η, is an intricate affair. The reason is that it might capture vastly different
concepts and thus lend itself to different interpretations. These are not only
divided along the lines of normative (e.g., issues of distribution) and
posi-tive (e.g., preferences for consumption smoothing) determinants, but might
also capture the inverse of the elasticity of intertemporal substitution or
so-cietal preferences for the aversion of consumption inequalities across space,
time and also states of nature. All these rationales could have been used by
different experts to inform their response, although the survey setting might
reasonably have led respondents to primarily consider interpretations relating
to an intertemporal consumption smoothing or inequality context, as opposed
to representing aversion to risk. Previous discussions in the literature point
towards a range of 0.5 to 4 (Cowell and Gardiner 1999; Dasgupta 2008),
al-though Groom and Maddison (2017) argue strongly for a narrower range of
between 1.5 and 2 for the UK based on revealed preference approaches. The
resulting expert recommendations for the elasticity of the marginal utility of
consumption as presented in Figure 1 (c) are indeed widely dispersed, with a
mean of 1.35 and a median and mode of 1. These values provide some support
to the often made assumption of logarithmic utility.
A.4 Growth Rate of Real Per-Capita Consumption
Figure 1 (d) presents the results of our respondents’ forecasts of the growth
rate of real per-capita consumption, g. The overwhelming majority forecast a
positive growth rate, with a mean of 1.7 percent and a median of 1.6 percent
(cf. Table 1). This is close to the 2 percent growth rate of consumption
percent growth rate in GDP per-capita over the period 1900 to 2000 in
non-OECD countries (Boltho and Toniolo 1999). Three experts project a negative
growth rate, and 55 respondents forecast a lower growth rate than the IPCC’s
(2000) lower bound projection of 1.3 percent for the period from 1990 to 2100.
28 experts forecast a growth rate larger than 2 percent.
A.5 Real Risk-Free Interest Rate
The mean long-run real risk-free rate of interest among our respondents
was 2.38 percent, with a standard deviation of 1.32 percentage points and a
median value of 2 percent.17 The mean response was higher than the observed
real rate of return on relatively risk-free assets in many countries at the time
of the survey. There are several possible reasons for this apparent discrepancy.
The assets typically (although loosely) described as ‘risk-free’ are
Govern-ment bills and bonds, but neither quite meets the theoretical ideal for
long-term social discounting.18 In practice, social discounting policy has tended to
regard bonds as the appropriate relatively risk-free asset to benchmark, due
to their longer time horizon (see, e.g., Stern 2008; OMB 2016; US EPA 2010).
When estimating the schedule of declining discount rates within a positivist
framework, researchers have also used bond yields (Newell and Pizer 2003;
Groom et al. 2007; Freeman et al. 2015). Within the practice of corporate
17While our question explicitly asked for a forecast of arisk-free interest rate, we cannot exclude the possibility that some respondents were instead providing a forecast return on production, or even equity, capital. Such returns include the premium associated with in-vesting in risky assets and therefore are not appropriate for discounting certainty-equivalent cash-flows. This may lead to an upward bias in the sample responses.
finance, there is also a strong preference for using Treasury bond yields as a
proxy for the risk-free rate in capital budgeting (Bancel and Mittoo 2014).19
Over the period 1900-2016 (since 2000), the global average real return was
approximately 0.8 (-0.5) percent for bills and 1.8 (4.8) percent for bonds
(Dim-son et al. 2017: 10). The mean response of 2.38 percent is therefore not too
dissimilar to the mean global bond rates witnessed since 1900.20 Furthermore,
when predicting long-run global rates it is likely that experts were considering
different scenarios for the 21st Century, in which the growing economies of
Asia, Africa and Latin America have higher rates of return, and hence change
the composition of global interest rates.
A.6 Normative versus Positive Approaches
A central point of disagreement on the SDR concerns the question of
whether normative issues, involving justice towards future generations, or
positive issues, involving forecast average future risk-free rates, or a mix of
the two should determine the SDR (Arrow et al. 1996, 2014). Not everyone
agrees that Time Discounted Utilitarianism is the correct ethical basis for
in-tergenerational decision-making in the first place. For instance, some prefer
deontological ethics which emphasise duties, while others prefer rights-based
approaches. In line with this history of disagreement on the SDR, our
inten-tion for Quesinten-tion 5 is to establish the extent to which recommendainten-tions on
the SDR are influenced by“positive predictions and ethical judgments”
(Rick-etts and Shoesmith 1992: 210–211). A clear finding from our data is that a
19Freeman (2009) also argues that the theoretical case is stronger for using bonds over bills in this context.
large majority of experts (80 percent) think that both dimensions are relevant
(see Figure 1 (f)). However, they generally recommend that governmental
in-stitutions should place greater weight on normative issues in determining the
SDR; this has a mean (median) weighting of 61.53 percent (70 percent). When
considering extremes, 14 percent (5 percent) of experts placed 0 (100 percent)
weight on positive considerations, while 42 experts were divided equally
be-tween the two rationales; making this the modal response. These findings
underscore that setting the SDR requires both forecasts and value judgments.
B.
Qualitative Responses
More than half of our respondents provided comments ranging from short
remarks, such as “risk matters”, to explanations over multiple pages. The
qualitative observations provide a rich body of evidence which sheds light on
various complexities of the theory and practice of social discounting. We group
these comments into four main categories that address (i) individual survey
questions Q1-Q5, (ii) technical issues, (iii) methodological issues, and (iv)
concerns about limited expertise. Each category has multiple subcategories.
Table B.1 in Appendix B. provides an overview of the most common issues
raised, including the number of experts commenting on it and an exemplary
quote, sometimes edited for brevity. The five most often raised subcategories
are: ‘declining discount rates and time-horizon’, ‘uncertainty’, ‘substitutability
and environmental scarcity’, ‘heterogeneity and aggregation’, and ‘comparison
III.
Analysis
A.
Determinants of the SDR
We now examine the relationship between experts’ recommended SDRs
and its fundamental determinants.21 In line with what one would expect from
the Ramsey framework, the correlations between the rate of pure time
prefer-ence,δ, as well as the ‘wealth effect’,η×g, and expert’s SDR recommendation
are positive. More precisely, a univariate increase inδ of one percentage point
increases the SDR recommendation by 0.34 percentage points (p < 0.01).22
The effect of an increase in η×g by one percentage point increases the SDR
by 0.15 percentage points (p < 0.01).23 The main driver of the wealth
ef-fect is the forecasted growth rate, while η is not significantly associated with
higher SDR recommendations in isolation. An increase in r by one
percent-age point is associated with an increase of the SDR by 0.52 percentpercent-age points
(p < 0.01). A very robust and sizable determinant of the SDR is the weight
that experts would put on normative as compared to positive issues
(‘norma-tive weight’) when forming their SDR recommendation. We find that each
additional percentage-point of the relative weight put on normative issues
re-duces the SDR by 0.02 percentage points (p < 0.01). This implies that a pure
‘positivist’ (normative scale = 0) would recommend a SDR that is 2 percentage
points higher than a pure ‘normativist’ (normative scale = 100 percent).
We further examine how other considerations expressed through experts’
qualitative comments may determine SDR recommendations. For this, we
build on the categorization of qualitative comments as shown in Table B.1
21Further analysis is presented in a previous working paper version (Drupp et al. 2015). 22All test are based on two-sided t-tests.
and analyze the relation of the SDR to the three most-mentioned categories.
Experts commenting on declining discount rates recommend an SDR that is
0.70 percentage points lower (p < 0.05), consistent with arguments provided in
the pertinent literature.24 Furthermore, experts commenting on uncertainty
recommend an SDR which is 0.69 percentage points lower (p < 0.01), also
consistent with the view that prudence in the face of uncertainty tends to
lower the appropriate SDR.25For those experts commenting on environmental
scarcity and relative price effects, we find SDR values that are lower by 0.97
percentage points (p < 0.01). Again, this is consistent with the literature on
dual discounting and the relative price changes of non-market goods.26
While our survey was only designed to capture select fundamental
deter-minants of the SDR for reasons of parsimony, and as the qualitative comments
of repondents do not paint a complete picture, it is clear that we only
cap-ture some of the determinants of the SDR.27 Overall, however, this analysis
suggests that responses appear to be theoretically motivated.
24See, e.g., Arrow et al. (2013), Cropper et al. (2014), Gollier et al. (2008), Groom et al. (2005), Newell and Pizer (2003), Weitzman (2001).
25See, e.g., Gollier (2008), Traeger (2009), Weitzman (1998), Weitzman and Gollier (2010). 26See, e.g., Baumg¨artner et al. (2015), Drupp (2016), Drupp and H¨ansel (2018), Gollier (2010), Hoel and Sterner (2007), Sterner and Persson (2008), Traeger (2011).
B.
Experts’ SDRs and the Ramsey Rule framework
An important issue for governmental guidance on social discounting is to
consider which theoretical framework may form the basis of recommendations
on the SDR. The previous analysis of discounting determinants has revealed
that experts’ SDR responses are indeed informed by some of its
fundamen-tal determinants in a way that would be based on theories discussed in
Sec-tion I. A. We now scrutinize whether and to what extent experts’ SDR
rec-ommendations may be in line with the simple Ramsey Rule (SRR) or the
extended Ramsey Rule (ERR) that feature prominently in policy guidelines.
We first impute the SRR using responses on individual components from
each expert. We find that its median (mean) [modal] value is 3 (3.48) [4]
percent. The mean SRR is thus 1.21 percentage points higher than the mean
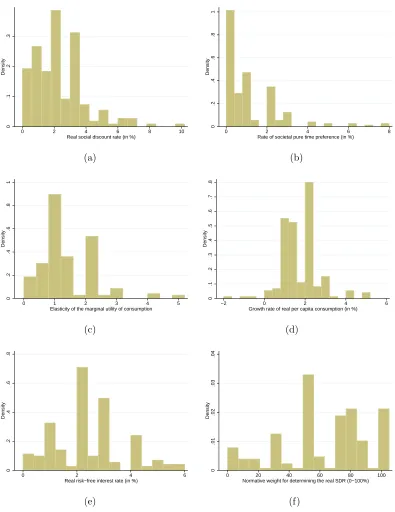
SDR. Figure 2 displays a histogram of the differences between individual SDRs
and imputed SRRs, excluding five outliers. The SDR coincides with the SRR
for only 36 respondents.28 This strongly suggests that the simple, deterministic
Ramsey Rule is not the preferred model for determining the SDR for the
majority of experts. Indeed, the qualitative responses of many experts reveal
well-motivated reasons for departing from this framework. We now explore
potential reasons for the large heterogeneity in differences between the SDR
and the SRR depicted in Figure 2.
One prominent alternative to the SRR that many experts might have
re-lied upon is the more general ERR. Indeed, a number of respondents
explic-itly stated that they considered uncertainty in the economy’s baseline growth
when forming their SDR recommendation.29 In the extended Ramsey Rule,
28It is important to note that the fact that these responses are equal does not necessarily imply that experts based their SDR response on the SRR.
0
.2
.4
.6
Density
-5 0 5
[image:26.612.196.416.87.250.2]SDR - SRR (in %-points)
Figure 2: Histogram of the difference between the recommended SDR and the
imputed simple Ramsey Rule (SRR =δ+η×g), in the interval [-5.5, 5.5].
a precautionary savings motive results in ERR−SRR = −0.5η(η+ 1)σ2 ≤0,
whereσ2 is the volatility of real per-capita consumption growth (Gollier 2002,
2011).30 If respondents use the ERR for determining their SDR, we would
expect that SDR<SRR. This seems to be the case for most respondents (see
Figure 2). While we do not elicit forecasts of σ, we can indirectly infer the
value of this parameter that would make the ERR consistent with the SDR for
any given expert. We can reconcile the SDR of only seven respondents with
the ERR if their applied estimate of σ ∈ (0%,3.6%]. This is the value of σ
used by Gollier (2012: Table 3.1). Allowing σ ∈(0%,9%], the SDR response
of 41 experts can be reconciled with the ERR. The mean (median) value ofσ
that would ensure consistency between the SDR and ERR response for the 97
experts for whom SDR<SRR is 11 percent (10 percent), which is considerably
higher than standard estimates for this parameter value (Gollier 2011). This
implies that even though a number of experts may have relied on the ERR,
the precautionary savings motive in this framework is unlikely to have been
the only determinant driving lower SDRs.
Yet, experts may have factored in more severe forms of uncertainty, such as
jump-risks in the spirit of Barro (2006), or considered other issues that drive
a wedge between the recommended SDRs and imputed SRRs. Indeed, a range
of arguments have been provided by experts for lower SDRs. Among others,
these point towards the use of declining discount rates or the consideration of
changes in the relative price of non-marketed environmental goods.
Figure 2 also shows a number of experts recommended SDRs that are
higher than the imputed SRR and thus cannot be reconciled by precautionary
savings. Such positions were often motivated by arguments relating to the
opportunity cost of governmental funds, indicating the need to evaluate
in-tergenerational projects using the opportunity cost of capital, rather than the
SRR or ERR, together with the idea that the former will typically be higher.
Beyond these technical arguments, further criticism focused on the need for
alternative approaches to inform intergenerational decision-making.31
Overall, the analysis demonstrates that within the expert community there
are several distinct schools of thought on how to discount intergenerational
projects, which are more nuanced than the standard normative-positive
di-chotomy. In particular, our analysis reveals quantitatively and qualitatively
that many experts are skeptical about the central role of the simple Ramsey
Rule in determining policy recommendations on long-term public projects.
31Experts recorded doubts about whether“a representative agent model with a standard
0
.1
.2
.3
.4
Density
0 10 20
Maximum comfortable SDR Minimum comfortable SDR
(a)
0
.2
.4
.6
.8
1
Percent
−5 0 5 10 15
Lower Bound of Interval
2% SDR interval 0% SDR interval (single value)
[image:28.612.119.514.114.273.2](b)
Figure 3: Figure (a) depicts the minimum and maximum SDR values that individual experts are still comfortable with recommending. The x-axis in Figure (b) shows the lower bound of an interval of given size (e.g. 2 percent) and the y-axis the proportion of experts whose acceptable SDR range has some overlap with an interval of a particular size starting at that point.
C.
Disagreement on Social Discount Rates
Point recommendations on the SDR range from 0 to 10 percent. It is
therefore unsurprising that the minimum acceptable SDRs reported by some
experts are above the maximum acceptable SDRs of others (Figure 3 (a)).
Yet, a closer inspection of the experts’ acceptable ranges shows that there is
considerable space for agreement on the SDR.
The colored histogram in Figure 3 (b) shows the proportion of experts
whose acceptable SDR range includes any given SDR value. From this colored
histogram we can also conclude that, besides being the median and modal
point SDR recommendation (cf. Table 1), a SDR of 2 percent is also contained
in the acceptable range of more experts than any other value (77 percent). The
transparent histogram shows, for any given SDR value, x, the proportion of
at x = 1% on this histogram reveals that the interval [1%,3%] is overlapped
by the acceptable range of the SDR for 92 percent of experts.
These data on SDR ranges shed light on which of the prominent positions
voiced in the academic and public debate—the long-term SDR of 4.5 percent
in Nordhaus (2008), or Stern’s (2007) central SDR value of 1.4 percent—
is more representative of the expert community. Based on the point SDR
recommendations, we find that while 30 percent of experts recommend Stern’s
SDR of 1.4 percent or lower, only 9 percent of experts recommend Nordhaus’
value of 4.5 percent or higher, with 61 percent forming the middle ground
between these two. The SDRs employed by Nordhaus (2008) and Stern (2007)
are included in the acceptable range of 31 percent and 58 percent of experts,
respectively. While there is more support for Stern’s position, our findings
suggest that neither may be deemed robust enough by policy-makers, who
might prefer instead to take a position between the two.
IV.
Discussion
In this section we discuss advice on determining an appropriate SDR for
long-term policy making from the survey evidence. Three immediate questions
arise. First, what role should experts play in providing the raw materials for
the SDR? Second, how should heterogeneities in expert views be treated when
calculating the appropriate SDR? Third, what does this survey tell us about
A.
The Role of Experts
The role of experts in public policy has itself been a source of
disagree-ment (Dasgupta 2008; Weitzman 2001). One typical criticism is that guidance
on social discounting should be informed via more“democratic” means
(Das-gupta 2008: 158). It is often claimed that economists do not command any
special expertise in matters of ethics. Yet some discussants explicitly
advo-cate an active role for“genuine specialists” to steer the process of setting SDRs
(Pindyck 2017; Sunstein 2014: 550). This comes as no surprise, as the
ques-tions raised by intergenerational discounting are highly complex. Compared
to members of the general population, experts will have spent considerably
more time considering the intricate issues that arise. We also note that
gov-ernmental guidance on social discounting is generally influenced by expert
opinion, as are other areas of policy as evidenced by, for example,
member-ship of Monetary Policy Committees. There is also a distinction to be drawn
within economics between genuine specialists and general economists.
Mone-tary Policy Committee members typically fall into the former category, as do
those who have provided recent advice to international governments on social
discounting. Therefore, while there are good arguments for more inclusive
approaches, it is also imperative that advice is heard from genuine experts on
the determinants of the long-term SDR. It is thus also crucial to obtain a more
representative account of expert opinions, such as we provide in this paper.
B.
Dealing with Heterogeneity
Based on the heterogeneous responses to this survey, a decision-maker
might reasonably ask which single rate to use when discounting the
adjudicate between conflicting opinions, and aggregate different forecasts, is a
contentious issue to which there is no single accepted answer.32 Given the lack
of clear theoretical guidance on how to aggregate individual expert responses,
what remains may be to rely on a data-driven approach. Fortunately, this
points towards a rather clear recommendation: a long term SDR of 2 percent
is not only the modal and median recommendation but also the SDR value that
is included in the acceptable ranges of most experts (77 percent). Interestingly,
this long-run SDR of 2 percent is lower than the equivalent recommendations
of the UK, French and US governments.
C.
Discounting Expected Cash Flows
The exercise that we have undertaken here has been framed around
cer-tainty equivalence. For this reason, the recommended SDRs discussed are
risk-free rates, appropriate for calculating present values for risk-risk-free or
certainty-equivalent costs and benefits. However, in most circumstances, governments
use expected cash-flows directly as if they were already certainty-equivalent
values.33 The problem then is that if thereare project-specific risks, and these
are correlated with consumption risk, then public projects may contribute to,
32One proposal is to calculate the discountfactor for each respondent, and then construct the social discount factor as a weighted average of individual discount factors. This is the approach taken by Weitzman (2001) and leads to a declining term structure of SDRs. The difficulty with this approach is that it is not clear what weights to assign to each of the expert discount factors. While Weitzman (2001) gives each response equal importance, this has been a controversial choice (Freeman and Groom 2015; Heal and Millner 2014; Jouini et al. 2010; Millner and Heal 2017; Weitzman and Gollier 2010; Gollier and Zeckhauser 2005). In particular, Freeman and Groom (2015) show that the appropriate weighting depends on whether responses reflect disagreement on value judgments or uncertainty about forecasts.
or diminish, macroeconomic risk. The appropriate SDR for evaluating the net
benefits in such cases should then vary from one project to another depending
on their risk profiles. The SDR for a climate change mitigation project, for
example, is likely to differ vastly from that appropriate for health, transport
and education projects if the social planner is using expected, not
certainty-equivalent, benefits. Any given project should be penalized (rewarded) using
a specific risk adjustment depending on whether it increases (reduces)
macroe-conomic risk (e.g. Gollier 2012: 193). For instance, consider a project j with
a project consumption beta, βj.34 The consumption-based CAPM model
esti-mates the SDR for project j as the risk-adjusted discount rate:
SDRj =SDR+π(βj), (7)
where the last term, π(βj), represents the risk premium.35 From equation (7)
it is clear that all projects require information on the risk-free discount rate
even in this expected cash flow setting, and this has been the focus of this
paper. Estimating the risk premiums associated with long-term projects is a
tricky issue about which there is little general agreement.36 Further research
is required to elicit expert opinions on these matters.
34This captures the percentage contribution to societal benefits of a risky project when overall consumption increases by 1 percent.
35For instance, Gollier (2012: 191) shows that under the assumptions of Section IA, and jointly normal project and consumption risks with correlation coefficientρ, the risk premium is given byπ(βj) =ηβjσ2where βj =ρσj/σ.
V.
Conclusion
We have presented evidence from a survey of over 200 experts on the
de-terminants of the long-term real social discount rate (SDR) for discounting
certainty-equivalent cash flows of public projects with intergenerational
con-sequences. The SDR is, perhaps, the single most important driver of any
cost-benefit analysis evaluating long-term public projects. We find that the
median (mean) recommended SDR of our experts is 2 percent (2.3 percent).
While there is considerable disagreement between respondents on point
rec-ommendations, which range from 0 to 10 percent, more than three-quarters
of those surveyed would find the median and modal SDR of 2 percent
accept-able for risk-free projects. More than 90 percent are comfortaccept-able with a SDR
somewhere in the interval of 1 percent to 3 percent.
A key innovation of our survey is that we not only elicit responses on
the appropriate and acceptable SDR itself, but also on individual discounting
determinants: recommendations on the rate of pure time preference and the
elasticity of marginal utility of consumption, as well as predictions of long-term
per-capita consumption growth and the average real risk-free rate of interest.
This disentangled data allow us to shed some light on which approaches to
so-cial discounting experts use. Importantly, our disentangled data show that the
simple deterministic Ramsey Rule, which is still found in governmental
guide-lines on cost-benefit analysis across the world, cannot explain the responses of
the majority of our experts. This finding suggests that more complex models
for social discounting are required, a conclusion that is supported by the rich
body of qualitative responses we received. Many of our respondents provided
comments relating to a number of extensions and alternatives to the simple
prices of non-marketed goods, as well as entirely different (e.g. non-Utilitarian
or procedural, rather than consequential) approaches to societal evaluation.
Policy guidance on social discounting should consider these alternatives to
ensure efficient and equitable decisions on long-term public projects.
Further inspection of the data on individual discounting determinants yields
findings that go beyond their value as potential inputs to governmental
dis-counting guidelines. First, we find that the modal value of the pure rate of time
preference is zero. Yet, with a median (mean) of 0.5 percent (1.1 percent), our
results cannot confirm the IPCC’s (2014: 229) conclusion that there is“a broad
consensus for a zero or near-zero pure rate of time preference”. Second, our
data suggest that the IPCC should consider lower growth scenarios in future
assessments. Third the median and modal recommended elasticity of marginal
utility of consumption of unity provides some support for the frequently made
assumption of logarithmic utility. Lastly, we find that there exists
consider-able disagreement between experts on the relative importance of normative
and positive approaches to discounting. Most report that the SDR should
reflect both, highlighting that these previously accepted categories overly
po-larize more nuanced expert views. Engaging with both disagreement about
values and uncertainty over forecasts is therefore an essential task for
inform-ing decision-makinform-ing on long-term public projects.
Overall, our findings lead us to the conclusion that the prominence of the
simple Ramsey Rule needs to be revisited as it provides an inadequate guide for
determining SDRs, and that much of current policy guidance concerning social
discounting and the evaluation of long-term public projects requires updating.
While not uncontentious, our survey points to a long-term global SDR for
certainty-equivalent cash flows of 2 percent. This risk-free SDR is lower than
(Nordhaus 2008, Weitzman 2001), yet closer to recent revealed evidence on
long-term discounting from the housing-market (Giglio et al. 2015).
Our results provide insights into the determinants of the risk-free SDR
that form key building-blocks in a range of approaches to evaluating societal
decision-making. For instance, our data on the rate of pure time preference
and the elasticity of the marginal utility of consumption may inform the
cal-ibration of the social welfare functions in integrated assessment models of
climate change. Yet, as the future is inherently uncertain, governments should
take into account risk and uncertainty when evaluating long-term projects.
Building on the results presented in this paper, decision-makers would
there-fore be well-advised to consider the components of the risk-adjusted SDR, or
how certainty-equivalents can be estimated, when evaluating long-term public
Appendix
A.
Non-Response Bias and Representativeness
We followed several standard procedures to test for the existence of
non-response bias. First, from December 2014 to April 2015 we contacted via
e-mail and telephone 60 randomly selected non-respondents. This allowed us
to obtain a further 38 responses, with 14 of these experts providing
qualita-tive data and 24 giving reasons for their initial non-responses.37 Second, our
sample includes quantitative responses from 11 of the 13 “blue ribbon”
ex-perts on social discounting from the Arrow et al. (2012) panel that advised
the US EPA.38 Third, we divide the sample between early and late responses
(Dalecki et al. 1993, Necker 2014), defined by the subsample of 58 experts
that directly responded to the first e-mail and those that answered a reminder
e-mail. We check for potential non-response bias by comparing mean and
median responses of each of these groups (see Table A.1). While there are
differences regarding some discounting determinants, we find that there are no
statistically significant differences in SDR values across different groups.
A further common measure for potential non-response bias is to consider
groups by gender and location (Necker 2014).39 We find that male experts
se-lected into responding to our survey relative to the non-response group (91
per-cent versus 81 perper-cent). The proportions of respondents and non-respondents
37Reasons include having insufficient time (11 times) as well as insufficient expertise (10 times), which may indicate self-selection of experts into responding to the survey.
38A twelfth panel member initially provided qualitative evidence only, but stated after the survey was completed that he would “follow the view of the median panelist.”
Table A.1: Comparison with Non-Respondents and Arrow et al. Experts
g δ η r Normative SDR SDRmin SDRmax
Results from the 185 quantitative responses
Mean 1.70 1.10 1.35 2.38 61.53 2.27 1.12 4.14 Median 1.60 0.50 1.00 2.00 70.00 2.00 1.00 3.50
N 181 180 173 176 182 181 182 183
Results from the 14 randomly selected previous non-respondent responses
Mean 1.63 1.46 1.23 1.96 71.36 2.02 1.01 3.09 Median 1.50 1.00 1.00 1.75 75.00 2.00 0.63 3.00
N 12 12 8 12 12 13 14 13
Results from 11 of the 13 Arrow et al. (2012) panel experts
Mean 1.80 0.60 1.51 2.66 57.27 2.62 1.30 4.00 Median 2.00 0.50 1.50 3.00 50.00 3.00 1.00 4.00
N 11 11 11 11 11 11 11 11
Results from the 58 early responses
Mean 1.49 0.73 1.47 2.26 60.14 1.99 0.92 3.68 Median 1.50 0.38 1.50 2.00 50.00 2.00 0.75 3.00
N 58 58 56 58 58 58 58 58
Results from the 127 late responses
Mean 1.80 1.27 1.29 2.44 62.18 2.40 1.21 4.35 Median 1.80 0.90 1.00 2.00 70.00 2.00 1.00 4.00
N 123 122 117 118 124 123 124 125
are balanced in terms of characteristics such as being a full Professor (49
per-cent versus 48 perper-cent) and average year of Ph.D. completion (1993.6 versus
1993.7). Experts currently based in Europe selected into responding (49
per-cent of respondents versus 32 perper-cent of non-respondent). This may have led
to a slight underestimation of the mean SDR given a slight propensity of
Eu-ropeans to be more normative than non-EuEu-ropeans.40 Overall, our findings do
not suggest substantial and systematic unidirectional non-response biases for
SDR recommendations.
B.
Overview of Qualitative Responses
Table B.1: Overview of Qualitative Responses
Issue N Exemplary quote
Q1: Growth rate 14 I foresee a very bright economic future with a continued 2 percent growth rate for the coming century.
Q2: Pure time preference 10 I see no reason to treat generations not equally. Q3: Elasticity of
marginal utility
12 The elasticity of marginal utility of consumption is heteroge-neous, and using a single value is a crude simplification. Q4: Real risk-free interest
rate
8 There is no interest rate for 100 year horizon (to my knowl-edge).
Q5: Normative vs. positive 16 The components of the SDR are overwhelmingly normative. Declining discount rates
and time horizon
20 I am more comfortable with declining discount rates [...] due both to declining time preference rates and to uncertainty about future consumption growth.
Heterogeneity and aggre-gation
19 Ideally, the input for our [social welfare function] would be a utility function that allows for heterogeneous preferences. Opportunity cost of funds 8 SDRs should reflect the social opportunity cost of funds. Project risk 6 We would have to consider very carefully the risk structure
of the investment to get a correct discount rate. Relative prices of
non-marketed goods
20 If future costs/benefits accrue e.g. to environmental ameni-ties, I would argue for a very low discount rate, based on an expectation of increasing relative prices for these goods. Uncertainty 20 We need to admit that the current state of the world is full
of uncertainties. [Yet] most uncertainties are neglected, and sometimes few remain when these are considered most im-portant, [...] or easiest to accommodate.
Alternatives to discounting 15 Instead of imposing a [social welfare function] and calculate the corresponding optimum, it is ‘better’ to depict a set of fea-sible paths of consumption, production, temperature, income distribution, etc. and let the policy maker make a choice. Comments on the survey 14 The search for THE discount rate, if that is your project, is
deeply flawed.
Confidence intervals 8 I would also insist on providing confidence intervals.
Ramsey Rule 17 My discount rate is less than implied by the Ramsey rule because I use the extended rule, incorporating uncertainty. Role of experts 7 I really think economists have very little special expertise
in knowing the ‘right’ number. These parameters should be chosen in an open, iterative way with an eye toward under-standing the consequences of different choices.
Limited confidence 13 Please ignore my response to Q4: I don’t have the knowledge to make a meaningful forecast.
References
Arrow, K.J. (1999), Discounting, Morality, and Gaming. In: Discounting
and Intergenerational Equity, edited by Portney, P.R., and J.P. Weyant.
Washington, D.C.: Resources for the Future.
Arrow, K.J., Cline, W., M¨aler, K.G., Munasinghe, M., Squitieri, R., and J.
Stiglitz (1996), Intertemporal Equity, Discounting, and Economic Efficiency.
In: Climate Change: Economic and Social Dimensions of Climate Change,
Contribution of Working Group III to the Second Assessment Report of the
Intergovernmental Panel on Climate Change, edited by Bruce, J.P., Lee, H.,
and E.F. Haites. Cambridge: Cambridge University Press.
Arrow, K.J., Cropper, M.L., Gollier, C., Groom, B., Heal, G., Newell, R.,
Nordhaus, W.D., Pindyck, R., Pizer, W., Portney, P., Sterner, T., Tol,
R.S.J., and M.L. Weitzman (2012), How Should Benefits and Costs Be
Discounted in an Intergenerational Context? The Views of an Expert Panel,
RFF Discussion Paper 12(53), Resources for the Future.
Arrow, K.J., Cropper, M.L., Gollier, C., Groom, B., Heal, G., Newell, R.,
Nordhaus, W.D., Pindyck, R., Pizer, W., Portney, P., Sterner, T., Tol,
R.S.J., and M.L. Weitzman (2013), Determining Benefits and Costs for
Future Generations, Science 341(6144): 349–350.
Arrow, K.J., Cropper, M.L., Gollier, C., Groom, B., Heal, G., Newell, R.,
Nordhaus, W.D., Pindyck, R., Pizer, W., Portney, P., Sterner, T., Tol,
R.S.J., and M.L. Weitzman (2014), Should Governments Use a Declining
Discount Rate in Project Analysis?, Review of Environmental Economics
Arrow, K.J., and R.C. Lind (1970), Uncertainty and the Evaluation of Public
Investment Decisions, American Economic Review 60(3): 364–378.
Asheim, G.B. (2010), Intergenerational Equity, Annual Review of Economics
2(1): 197–222.
Asheim, G.B., and T. Mitra (2010), Sustainability and Discounted
Utilitar-ianism in Models of Economic Growth, Mathematical Social Sciences 59:
148–169.
Bansal, R., M. Ochoa and D. Kiku (2016), Climate Change and Growth Risks,
NBER Working Paper, available at: http://www.nber.org/papers/w23009.
Bancel, F., and Mittoo, U.R. (2014). The gap between the theory and practice
of corporate valuation: Survey of European experts. Journal of Applied
Corporate Finance, 26: 106-117.
Barro, R.J. (2006), Rare disasters and asset markets in the twentieth century,
The Quarterly Journal of Economics 121(3): 823–866.
Baumg¨artner, S., A.-M. Klein, D. Thiel and K. Winkler (2015), Ramsey
Discounting of Ecosystem Services, Environmental and Resource Economics
61: 273–296
Baumol, W.J. (1968), On the Social Rate of Discount, American Economic
Review 57: 788–802.
Baumstark, L., and C. Gollier (2014), The Relevance and the Limits of the
Arrow-Lind Theorem, Journal of Natural Resources Policy Research 6(1):
Boltho, A., and G. Toniolo (1999), The Assessment: The Twentieth Century
- Achievements, Failures, Lessons, Oxford Review of Economic Policy 4:
1–17.
Botzen, W.W., and J.C. van den Bergh (2014), Specifications of Social Welfare
in Economic Studies of Climate Policy: Overview of Criteria and Related
Policy Insights, Environmental and Resource Economics 58(1): 1–33.
Chichilnisky, G. (1996), An Axiomatic Approach to Sustainable Development,
Social Choice and Welfare 13: 231–257.
Combes, P.P., and L. Linnemer (2010), Inferring Missing Citations: A
Quan-titative Multi-Criteria Ranking of all Journals in Economics, GREQAM
Working Paper 2010-25.
Cowell, F.A., and K. Gardiner (1999), Welfare Weights, OFT Economic
Research Paper 202, STICERD, London School of Economics.
Cropper, M.L., Freeman, M.C., Groom, B., and W. Pizer (2014),
Declin-ing Discount Rates, American Economic Review: Papers and Proceedings
104(5): 538–543.
Dalecki, M.G., Whitehead, J.C., and G.C. Blomquist (1993), Sample
Non-Response Bias and Aggregate Benefits in Contingent Valuation: An
Ex-amination of Early, Late and Non-Respondents,Journal of Environmental
Management 38(2): 133–143.
Daniel, K.D., Litterman, R.B., and G. Wagner (2016), Applying asset pricing
theory to calibrate the price of climate risk, NBER Working Paper No.

![Figure 2: Histogram of the difference between the recommended SDR and theimputed simple Ramsey Rule (SRR = δ + η × g), in the interval [-5.5, 5.5].](https://thumb-us.123doks.com/thumbv2/123dok_us/1954850.155954/26.612.196.416.87.250/figure-histogram-dierence-recommended-theimputed-simple-ramsey-interval.webp)