This is a repository copy of An Experimental Study of the Kinetics of OH/OD(v=1,2,3) + SO : the Limiting High Pressure Rate Coefficients as a Function of Temperature₂ .
White Rose Research Online URL for this paper: http://eprints.whiterose.ac.uk/114543/
Version: Accepted Version
Article:
Blitz, MA orcid.org/0000-0001-6710-4021, Salter, RJ, Heard, DE
orcid.org/0000-0002-0357-6238 et al. (1 more author) (2017) An Experimental Study of the Kinetics of OH/OD(v=1,2,3) + SO : the Limiting High Pressure Rate Coefficients as a ₂
Function of Temperature. Journal of Physical Chemistry A, 121 (17). pp. 3175-3183. ISSN 1089-5639
https://doi.org/10.1021/acs.jpca.7b01294
(c) 2017, American Chemical Society. This document is the Accepted Manuscript version of a Published Work that appeared in final form in the Journal of Physical Chemistry A, copyright (c) American Chemical Society after peer review and technical editing by the publisher. To access the final edited and published work see:
https://doi.org/10.1021/acs.jpca.7b01294
[email protected] https://eprints.whiterose.ac.uk/ Reuse
Unless indicated otherwise, fulltext items are protected by copyright with all rights reserved. The copyright exception in section 29 of the Copyright, Designs and Patents Act 1988 allows the making of a single copy solely for the purpose of non-commercial research or private study within the limits of fair dealing. The publisher or other rights-holder may allow further reproduction and re-use of this version - refer to the White Rose Research Online record for this item. Where records identify the publisher as the copyright holder, users can verify any specific terms of use on the publisher’s website.
Takedown
If you consider content in White Rose Research Online to be in breach of UK law, please notify us by
1
An Experimental Study of the Kinetics of OH/OD(v=1,2,3) + SO
2: the
Limiting High Pressure Rate Coefficients as a Function of
Temperature
Mark A. Blitz,a,b* Robert J. Salter,a,c Dwayne E. Heard a,b and Paul W. Seakins a,b
a School of Chemistry, University of Leeds, Leeds, LS2 9JT, UK
b National Centre for Atmospheric Science, University of Leeds, Leeds, LS2 9JT, UK
c Now at Deloitee MCS, 3 Rivergate, Temple Quay, Bristol, BR1 6GD, UK
2
Abstract
The kinetics of the reaction OH/OD(v=1,2,3) + SO2 have been studied using a
photolysis / laser induced fluorescence technique. The rate coefficients
OH/OD(v=1,2,3) + SO2, k1, over the temperature range 295 – 810 K were used to
determine the limiting high pressure limit, k1. This method is usually applicable if the
reaction samples the potential well of the adduct, HOSO2, and if intramolecular
vibrational relaxation is fast. In the present case, however, the rate coefficients showed
an additional fast removal contribution as evidenced by the increase in k1 with
vibrational level; this behaviour together with its temperature dependence is consistent
with the existence of a weakly bound complex on the potential energy surface prior to
adduct formation. The data were analysed using a composite mechanism that
incoporates energy transfer mechanisms via both the adduct and the complex, and
yielded a value of k1(295 K) equal to (7.2 ± 3.3) × 10-13cm3 molecule-1 s-1, (errors at
1)a factor of between two to three smaller than the current recommended IUPAC and
JPL values of (2.021..00) and (1.6 ± 0.4) × 10-12 cm3 molecule-1 s-1 at 298 K, respectively,
although the error bars do overlap. k1was observed to only depend weakly on
3
1. Introduction
Sulphur dioxide (SO2) is a trace pollutant gas in the Earth’s atmosphere. Measurements
of atmospheric concentrations of SO2 suggest that its primary sources are
anthropogenic1 and that it has a relatively short atmospheric lifetime of the order of a
few days with respect to reaction with OH. Sulphur released from biogenic sources
tends to be in more reduced forms, notably carbonyl sulphide, dimethyl sulphide (DMS)
and H2S.2-4 The oxidation and interconversion of these species are linked and, while it
is estimated that the majority of DMS is converted to SO2, biogenic sources produce
only 10-25% of the total atmospheric load of SO2.2, 5-7The majority of atmospheric SO2
is directly emitted by human activity and it may have significant environmental impact
as it is almost entirely converted to sulphuric acid(H2SO4) in the atmosphere, leading
to the formation of acid rain8 as well as particulate formation.9-10
As with most atmospheric pollutants, gas phase oxidation of SO2 by reaction
with the OH radical is the main route of chemical removal:
OH + SO2 (+ M) HOSO2 (+ M)
R1
with HOSO2 further reacting with O2 11 to form SO3, which then reacts with H2O to
form H2SO4.12-13 H2SO4 leads to aerosol formation and is the major source of new
particles in the atmosphere:14
HOSO2(g)O2/H2O H2SO4(g) sulphate R2
Reaction R1 is pressure dependent and is in its falloff regime at atmospheric pressure
and below. Its kinetics in this pressure regime have been extensively studied,15-18 and
RRKM modelling of these data have been used to recommend the limiting
high-pressure rate coefficient: Wine et al.18 recommended a value for k
4
420 K equal to 1.3 × 10⁻¹² (T/300 K)-0.7 cm3 molecule-1 s-1 and Cobos and Troe 19
recommended k1∞= 2.7 × 10⁻¹² exp(-80K/T) cm3 molecule-1 s-1 (k1× 10 -12 cm3 molecule-1 s-1).
More recently Fulle et al. 20 measured k1 over an extended pressure range up to
96 bar and their estimate of k1∞was significantly larger (3.6 × 10⁻¹² cm3 molecule-1 s-1
at 300 K) than the above recommendations, and a significant positive activation energy
was observed, contrary to the recommendations. Blitz et al.21 investigated the
temperature dependence of k1∞ by monitoring the removal of vibrationally excited
hydroxyl radical, OH(v=1), in the presence of SO2 – the so-called proxy method to
measure k1∞ (see below) - and observed a slight negative temperature dependence,
where the value of k1∞2.04 ± 0.10)× 10-12 cm3 molecule-1 s-1) was significantly lower
than that of Fulle et al., but above the recommendation of Wine et al. IUPAC evaluated
the OH + SO2 reaction in 2012 recommending k1∞ = (2.012..00) × 10-12 cm3 molecule-1 s
-1 at room temperature, but with no recommendation on the temperature dependence.22
The JPL evaluation 23 of this reaction did not consider the Fulle et al. data and assigned
a value k1∞ = (1.6 ± 0.4) × 10-12 cm3 molecule-1 s-1, slightly lower than the IUPAC value.
In this study, the value for k1∞ and its temperature dependence has been
investigated by monitoring the removal of vibrationally excited hydroxyl radical,
OH/OD(v=1,2,3), in the presence of SO2. In our previous study,21 where only OH(v=1)
in the presence of SO2 was monitored, it was argued that the excited HOSO2 adduct
5
Assigning the vibrational relaxation rate coefficient as the limiting high-pressure rate
coefficient, k, of a reaction was first proposed by Jaffer and Smith,24 and it appears to be valid for reactions that form a reaction collision complex on a long-range attractive
surface, i.e. the reaction rate coefficient is independent of vibrational energy. This
approach is known as the proxy method and is depicted in Scheme 1 for the reaction
R1:
OH (v
= 1) + SO
2 1
k
HOSO
2**
k
IVROH (v
= 0) + SO
2 1 1 k k
HOSO
2*
] [ M M k
HOSO
2 Scheme 1where HOSO2** represents the adduct prior to intramolecular vibrational relaxation
(IVR) and HOSO2* the adduct following IVR. Ergodicity is a central tenet of
unimolecular reaction rate theory and appears to be valid for almost all thermal
reactions. Re-dissociation of HOSO2**, k-1, occurs mostly to OH (v=0) via HOSO2* so
that the removal rate coefficient derived from measurements of OH (v=1), k1, is a good
approximation of the limiting high-pressure rate coefficient, k1∞. Current understanding
indicates occurs via a collision complex on a long-range attractive surface, therefore
there is no kinetic isotope effect and k1∞should be reasonably approximated by:
OD + SO2 (+ M) DOSO2 (+ M)
R1,D
Hence the determination of k1,D∞ provides additional information on R1. Throughout
this paper it is assumed that k1,D∞ is equal to k1∞, even though it is not identical. This
6
valid for a number of systems, for example OH + NO,24 and OH + NO2.25 In general,
as the size of the system increases, the rate of re-dissociation, k-1, decreases26 and the
ergodicity assumption is more readily satisfied. This present study shows that the
removal of OH/OD(v=1,2,3) is not solely via the proxy mechanism and there is an
additional non-reactive vibrational relaxation contribution via collisions that access a
shallower, long range van der Waals well. We show that both contributions can be
modelled, and hence are able to assign a more reliable value for k1that is lower than
current recommendations. A detailed consideration of rate coefficient for the reaction
of vibrational ground state OH with SO2, the possible influence of SO2 photolysis on
the kinetics and a comparison of previous literature is presented in the companion
paper.
2. Experimental
Laser Flash Photolysis / Laser Induced Fluorescence
The apparatus used to measure the vibrationally excited state OH/OD(v=1,2,3) kinetics
is similar to that described previously,21,27 thus only the salient features are highlighted.
An excimer laser (Lambda Physik, LPX 105) was used as the photolysis laser (~ 100
mJ / pulse) for OH/OD (v=1,2,3) generation. The output from an excimer laser (Lambda
Physik, LPX 105) pumped dye laser (Lambda Physik, FL2002), was used to monitor
OH(v=1,2,3) by off-resonance fluorescence using the dye mixture PTP / DMQ to
produce ~ 3 mJ per pulse over the range 345 – 360 nm. OD(v=1,2,3) was probed using
the doubled output from a Nd:YAG (Continuum Powerlite 8010) pumped dye laser
7
OH/OD(v) are given in Table 1. The subsequent fluorescence (A2+ 2
i) passed
through a 308 nm interference filter (Barr Associates), detected using a photomultiplier
(Electron Tubes 9813) and the subsequent signal was integrated and digitized on a
LeCroy (Waverunner LT372) oscilloscope before being transferred for storage on a PC.
Little laser scattered light was observed when detecting species using off-resonant, blue
shifted fluorescence schemes. A LabVIEW program controlled the delay generator
which scanned the time delay between the photolysis and probe laser, and recorded via
the oscilloscope the OH/OD signal. Typically, the time delays were scanned over 200
- 400 points, with each point being the average of up to ten samples. The pulse repetition
frequency of the lasers was 5 Hz such that a fresh gas mix was exposed for each
photolysis pulse.
The gases were introduced into the reaction cell through a mixing manifold.
Control of the gas flows was regulated by mass flow controllers. After the mixing
manifold, the gases entered a ten-way cross, stainless steel reaction cell designed for
high temperature experiments with a surrounding ceramic fiber heater (Watlow). The
pressure in the cell was controlled by throttling the exit valve of the cell and monitored
via a capacitance manometer. The total flow was > 10 sccm per Torr total pressure,
ensuring that the gases were swept through the cell between laser pulses. The
temperature was measured inside the cell by type K thermocouples probing close to the
reaction region ensuring temperatures were known to ±5 K. The OH/OD (v=1,2,3)
experiments were conducted at a total pressure between 20 - 50 Torr and the
8
SO2 was purified by first degassing and then diluted in He. H2 (Air Products,
99.999) and He (BOC, CP grade 99.999%) were used directly from the cylinder.
OH/OD (v=0,1,2,3) precursors
As in our previous paper 27 vibrationally excited hydroxyl radicals were generated from
two photon dissociation of SO2 at 248 nm to form O(1D):
SO2 + 2 hv 248 nm O(1D) + SO P1
followed by the reaction:
O(1D) + H2 OH(v=0-4) + H R3
Reaction 3 has been widely studied both experimentally and theoretically28-30 and is
known to produce the following ratios of vibrationally excited OH: v= 1:2:3:4; 0.29:
0.32: 0.25: 0.13.28 By substituting D2 for H2 vibrationally excited OD was produced:
O(1D) + D
2 OD(v=0-3) + D R4
Typically, the concentration of SO2added to the system was ≤ 5 × 10¹⁶ molecule cm-3
and to ensure that the majority of the O(1D) reacts with hydrogen/deuterium, high
concentrations of H2 or D2 (~ 1 × 10¹⁷ molecule cm-3) was added to the system. The
reaction:
OH (v= 1) + H2/D2 OH(v=0) + H2/D2 < 1×10-14 cm3 molecule-1 s-1 31 R5
is relatively slow and is a constant removal process as the H2/D2 concentration was kept
constant when [SO2] was varied to determine bimolecular rate coefficients. The
reaction H/D + SO2 to give vibrationally excited hydroxyl does not occur to any
significant extent at the temperatures studied here 32 and hence does not affect the
9
3. Results
OH/OD(v=1,2, 3) + SO2
Laser excitation spectra of both OH/OD (=1, 2 and 3) were taken at room temperature
and simulated spectra calculated using the LIFBASE33 program. The experimental
values were observed to be in excellent agreement with the calculated line positions.
The actual lines used in the experiment are given in Table 1, and were usually the most
intense.
The reaction O(1D) + H2, R3, forms OH in vibrational levels up to OH (v = 4).
28 These high vibrational levels may form sufficiently long-lived collision adducts with
SO2, which result in efficient formation of the ground vibrational state as depicted in
Scheme 1:
OH (v= x) + SO2 OH (v= 0) + SO2 (k1∞) R1,PROXY
or undergo VET via a single step cascade mechanism:
OH (v= x) + SO2 OH (v= (x-1)) + SO2 (kVET i) R1,SSH
Theory indicates that VET via a multiple step is much less probable.34 Provided VET
is not close to resonant, this type of cascade mechanism is sufficiently described by the
Shin variation of Schwartz, Slawsky and Herzfeld (SSH) theory which incorporates a
more realistic form for the intermolecular potential than was used in the original
theory.34-38 In the recent trajectory study by Glowacki et al.39 the fate of the HO-SO 2
collision adduct was investigated and it was found that the lifetime of the collision
adduct was too short to efficiently form the OH ground vibrational state, the statistical
limit, as depicted in Scheme 1. However, the dissociation of the adduct resulted mainly
in loss of vibrational energy, especially so the higher the initial vibrational level.
10
k1∞, should be valid, even though the vibrational levels have not reached the statistical
limit, as depicted in Scheme 1.
For the present system both adduct formation and non-reactive vibrational
energy transfer (VET), collisions may result in a single step cascade mechanism, hence
the OH/OD (v=1,2,3) concentration versus time traces may have significant growth
from the higher vibrational levels, and the overall reaction scheme governing the
concentration of OH/OD (v=1,2,3) is thus:
OH(v=i) + SO2 OH(v=i-1) + SO2 k1,i (k1∞+kVET i)
OH(v=i+1) + SO2 OH (v=i) + SO2 k1,i+1 (k1∞+kVET i+1)
where k1,i and k1,i+1 are the rate coefficients for both adduct formation and non-reactive
VET in OH(v=i) and (v=i+1), respectively, i = 1,2,3. How each component is identified
is given in the discussion below, and hence leads to a determination of k1∞. Glowacki
et al.39 did observe trajectories corresponding to two vibrational quanta jumps via
adduct formation but these events were much less significant than single quantum
jumps. Therefore the change in concentration of OH/OD (v=1,2,3) is given by the
general differential equation:
i
i v i k
k dt i v d )] ( OH ][ SO [ )] ( OH [ 2 , 1 )] 1 ( OH ][ SO [ 2
1
ki v i E1
Solution of Equation 1 yields a multi-exponential time dependence for OH/OD(v=
11
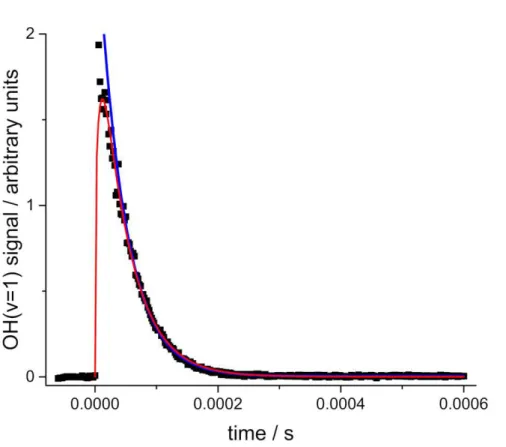
Figure 1. Typical OH( =1) decay in the presence of SO2 (1.07 × 10¹⁶ molecule cm-3)
at 295 K, where filled squares are the measured fluorescence intensities. The total pressure is equal to 37.3 Torr and the added H2 (6.84 × 10¹⁶ molecule cm-3) ensures that
the O(1D) is titrated to OH(). The lines are a biexponential (red) and (from t=50 s) exponential (blue) fit to the data, where the decay rate coefficients are (2.69 ± 0.39) and (2.29 ± 0.02) ×104 s-1, respectively. Note that the red and blue lines converge and this
is the point where the culled exponential analysis is carried out (see text for details).
For any given vibrational level, the full solution involves growth from more
than one higher vibrational level; hence the analytical solution is complicated. In
addition, if there is growth from multiple quanta jumps – Glowacki et al. showed that
this occurs 39– then the solution becomes intractable even when the initial vibrational
populations are known. An approximate solution is to treat it as a two level system:
growth from above is lumped together and loss from the probed vibrational level. This
leads to an analytical biexponential solution, and an example of fitting this to the data
12
loss rate coefficient from the probed level often had large errors, especially when its
values were close to the growth rate coefficient from the higher vibrational levels.
Although constraints could be applied to improve the errors on the returned rate
coefficient, a more systematic and easier approach is to fit the OH/OD(=1,2,3) data to
a single exponential decay given by:
t k
t
v
e
v
obs 0)]
3
,
2
,
1
(
OH/D
[
)]
3
,
2
,
1
(
OH/D
[
E2where kobs= ki [SO2] + kother, ki = (k1∞+ kVET i) and kother is the pseudo first order rate
coefficient for loss of these states by other routes. Contributions from growth in
OH/OD(v=1,2,3) are revealed as a decrease in the observed pseudo-first-order rate
coefficient, kobs.40 To minimise this contribution, individual points were sequentially
culled starting from t = 0, the decay trace recalculated and this procedure repeated until
there was no increase in the fitted rate coefficient, see Figure 1. In our previous paper
on OH + C2H227 we carried out simulations and determined that the error in the observed
rate coefficient from using equation E2 was ~ 10 - 15% of the actual rate coefficient
entered into the numerical model. This is in agreement with the cascade analysis carried
out by Silvente et al.40 In Figure 2 the returned ki[SO2] parameters versus [SO2] are
plotted from analysis of the OH(v=1) + SO2 at 295 K data using the biexponential
equation and a single exponential, E2.
Both biexponential analysis (E1) and culled exponential (E2) analysis returned
rate coefficients in close agreement, but both analyses are potentially prone to
systematic errors, so it is difficult to indicate which returns the most accurate rate
coefficients. As culled exponential analysis is more straightforward to apply, we have
13
the returned values for ki are potentially skewed, it is reasonable to expect that these
values are affected in a similar way. It is estimated that this skewing of the data is no
greater than 15%, hence a 15% error was added to ki. Analysis of the OH(v=1) + SO2
at 295 K data using equation E1 is shown in Figure 1.
From analysis of all the vibrational levels (see Table 2) it was evident that ki
increased strongly with i, which has been previously observed in OH(v=1,2) + C2H227
and indicates that non-reactive VET is the major component of the removal process.
Therefore the growth rate coefficient is faster than the loss rate coefficient, hence the
OH(v=i) trace better approximates a single exponential with a pseudo-first rate
coefficient ki[SO2] at later times. In Figure 1 it can be seen that after ca. one half-life
14
Figure 2. Typical bimolecular plot for OH(v=1) at 295 K, ~ 40 Torr total pressure of
He, where the squares and circles are obtained from equations E1 (ki[SO2] = kobs) and
E2, respectively, and linear regression gives bimolecular rate coefficient of (2.24 ± 0.16) and (2.04 ± 0.01) × 10-12 cm3 molecule-1 s-1, respectively.
The fitted rate coefficient, kobs, was measured over a range of sulphur dioxide
concentrations. The concentration of added H2/D2 was always greater than the highest
SO2 concentration, ~5×10¹⁶ molecule cm-3, and the total pressure was typically ~40
Torr. The gradient of kobs vs. [SO2] graph is the bimolecular rate coefficient ki. Typical
plots of kobs against [SO2] are shown in Figure 2 along with the best straight-line fit to
the data, via linear regression. Bimolecular rate coefficients were measured at
temperatures between 295 K and 810 K and the results are shown in Tables 2 and 3.
All the results are summarized in Table 2 and 3 (OH/OD(v=1,2,3)) and plotted
in Figures 3 and 4. From Table 2 and Figure 3, it is clear that the value k1= 3.6 × 10⁻¹²
cm3 molecule-1 s-1 determined from the measurements of Fulle et al.20 at 295 K is too
15
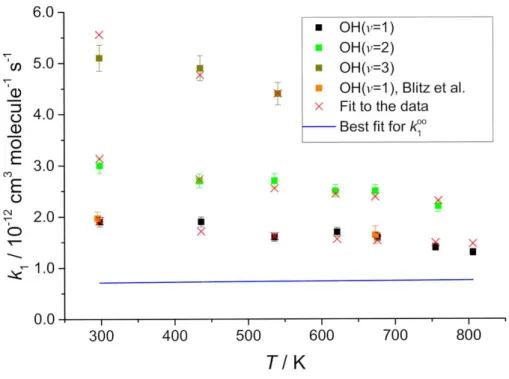
Figure 3. OH(v=1,2,3) + SO2 data fitted to composite function that accounts for
complex formation and non-reactive VET, SSH-type. The symbols are the data, which includes Blitz et al.,21 and the red crosses are the best fit (Equation 4, see Table 4 for the fitting parameters). These fitting parameters predict k1= (7.1 ± 3.3)
××cm3 molecule-1 s-1, the blue line.
16
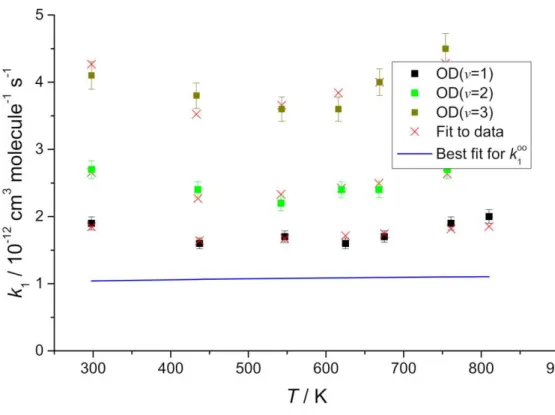
Figure 4. OD(v=1,2,3) + SO2 data fitted to composite function that accounts for
complex formation and non-reactive VET, SSH-type. The symbols are the data and the red crosses are the best fit (Equation 4, see Table 4 for the fitting parameters). These fitting parameters predict k1= (10.4 ± 2.5) ××cm3 molecule-1 s-1, the
blue line.
4. Discussion
Interpretation of the results for OH/OD(v=1,2,3)
The results from these experiments show that the rate coefficients, ki, for the removal
of OH/OD(v=1,2,3) by SO2 (Figures 3 and 4) increase with increasing vibrational level,
i. This means that the system is more complicated than removal by adduct formation,
i.e. the proxy method as depicted in Scheme 1. In our previous study on reaction R1, 21
only OH(v=1) + SO2 was studied and it was assumed that only the proxy method was
17
indicate that this value is an overestimate of k1 as the increase in ki with vibrational
level means that there is a contribution from non-reactive VET. This increase of ki on
vibrational level was previously observed in our study on OH(v =1,2) + C2H2,27 where
it was concluded that a weakly bound, van der Waals, vdW, complex facilitates an
additional route for loss of vibrational energy. This weakly bound complex is too short
lived at the temperatures of these experiments for efficient intramolecular energy
redistribution and VET is better described by an extended form of SSH theory
developed by Shin.34-38 The weakly bound adduct between OH + C
2H2 is ~ 10 kJ mol-1
41-42 but no such adduct has been observed or predicted between OH + SO
2. To explain
the present results a weakly bound complex needs to be invoked, and its presence also
provides explanation of why k1 is so small, something that is hard to rationalise if
HO-SO2 is formed on a simple barrierless potential energy surface, PES. The trajectory
calculations by Glowacki et al.39 were carried on a simple, barrierless, analytical PES
that started with a vibrationally excited HO-SO2 chemically bound adduct and followed
its progression to OH + SO2; no vdW complex was included on this PES. Therefore the
results from this calculation are only applicable for vibrational energy transfer from the
HO-SO2 adduct and not from the vdW complex, which is the major loss route in the
system.
The OH/OD(=1,2,3) + SO2 data in Figures 3 and 4, respectively, show that
each increase in the vibrational level results in a significant increase in ki, but this
increase is less than if VET were assumed to conform to SSH theory: 34
1 1 2
i
VET i VET k
18
This indicates that vibrational energy removal via the proxy mechanism is making a
significant contribution to ki. Over the range 300 - 500 K, ki shows a small but
discernible decrease, and the OD data, which appears to be of higher quality than the
OH data – the SO2 photolysis products produced a background signal that was
subtracted away – above 500 K increases to a small extent. This temperature
dependence is subtle compared to OH(v=1,2) + C2H2 where a distinct minimum was
observed at ~ 300 K, with ki increasing much more strongly with temperature. This
higher temperature minimum for OH(D)/SO2 implies that its vdW complex is slightly
more strongly bound than that between OH/C2H2, ~ 10 kJ mol-1, 41-42 based on the
observation that the probability for VET in HCl and HF was seen to go through a
minimum at ca. 350 and 1000 K, respectively, where the heats of dimerization are 9
and 25 kJ mol-1, respectively.34
The theory of non-reactive vibrational energy transfer is based on the original
theoretical work by Schwartz, Slawsky and Herzfeld (SSH) who developed a model for
vibration to translation energy transfer on a repulsive potential and demonstrated that
the rate coefficient increases with temperature according to the relationship ln k
1/T1/3.34 The model was further developed by Shin to include an attractive component
to the potential and demonstrated that an inverse temperature dependence of the rate
coefficient occurs at low temperature, where ln k 1/T2. 34-37 Shin constructed his
analysis on dipole - dipole or dipole – quadrupole interactions and used this model to
explain the irregular temperature dependence of vibrational energy transfer for HF with
several other encounter molecules (e.g. DF, HF and CO2). In our previous paper on OH
19
vibrational energy via both the vdW complex, extended SHH, and the HO-SO2 adduct,
the proxy method, and the rate coefficient is given by:
E i T D T C
i B n AT
k exp 1 ( /295)
) ( VET 2 3 / 1 E4
where kVETv i is the overall bimolecular rate coefficient for loss of OH/OD in (i=1,2,3),
B, C, D are the SSH parameters and A and E are the parameters describing the high
pressure limit for reaction R1, k1. The parameter n describes the enhancement of the
rate coefficient for non-reactive VET with increasing vibrational quantum number and
n was explored during the analysis; for a harmonic oscillator, n = 2.
Equation E4 was used to fit the OH and OD(v=1,2,3) + SO2 rate coefficient
data, where T and v were the two independent variables and the data were weighted to
the uncertainty in kVET, I, weight 1/2. A non-linear least-square fitting routine was
used to locate the best-fit parameters, and the resulting fit is shown in Figures 3 and 4,
and the returned parameters and uncertainties are given in Table 4. From Figures 3 and
4 it can be seen that Equation E4 is a good fit to both the OH and OD (v=1, 2 and 3) +
SO2 data. There are no vibrations or combinations in SO2 that lie within 30 cm-1 of the
OH stretch, so energy transfer is expected to be non-resonant and adequately described
by the left hand terms of equation E4. However, the interpretation of the non-reactive
VET B, C and D parameters is beyond the scope of this analysis.
In the analysis the value of n was constrained such that n ≥ 2.0, the harmonic
limit. It is noted that in this analysis the uncertainties in the non-reactive VET
parameters (Table 4) are considerably larger than k1∞(T). Table 4 gives the values for
20
positive dependence on temperature. As noted above, the OD data were of better quality
than the OH data and all the fitting parameters were allowed to float, see Table 4. For
the OH data the temperature dependence of k1∞ - E in Table 4 - was fixed to the same
value as OD and the value of D was not allowed to be negative; this ensures that
non-reactive VET increases at low T, as is the case for OD and OH + C2H2.27 The OD(v)/SO2
data points to a similar value for the limiting high-pressure rate coefficient, k1(D)∞, for
OD + SO2 (+M) DOSO2 (+ M)
R1(D)
which reinforces the current assignment, but it is not clear if they should be the same
due the uncertain impact of the pre-reaction complex.
General Discussion
From Figure 3, the OH(v=1,2,3) + SO2 data show a distinct dependence on the
vibrational level, vtherefore the value of k1∞in our previous work,21 where we assigned
k1∞ equal to k(OH(v=1) + SO2), is an overestimate (n.b. the absolute rate coefficient for
OH(v=1) removal we previously determined is in excellent agreement with the present
work, see Figure 3). Figure 3 indicates that OH(v) removal by SO2 is mainly by energy
transfer in collisions that do not sample the deep HOSO2 well (SSH-type behaviour),
in contrast to vibrational relaxation via the proxy mechanism where relaxation occurs
following IVR in the deep well. In the present case, the latter is minor but is being
identified in our analysis in order to assign k1∞. Analysis via equation E4 reinforced this
observation and assigned a value k1∞ = (7.2 ± 3.3) × 10-13 cm3 molecule-1 s-1. Therefore
the OH(v=1,2,3) + SO2 data indicate that the value of k1∞(T) is smaller than both the
IUPAC and JPL recommendations: (2.0 12..00) and (1.6 ± 0.4) × 10-12 cm3 molecule-1 s-1,
21
the literature values for OH(v=0) + SO2 measurements, together with some new
measurements, are analysed using a master equation. However, it is noted that if the D
parameter, which increases the rate coefficient as temperature is lowered, is floated with
a lower bound equal to 1.5 × 10⁵, the value obtained for OD(v=1,2,3) + SO2, this returns
a value k1∞ = (11.5 ± 3.6) × 10-13 cm3 molecule-1 s-1, see Table 4. This value represents
an upper limit to k1∞ and is obtained when the fit to the data is ~ 3 times worse, see
Table 4.
The implication from the OH(v) + SO2 rate coefficient data is that a pre-reaction,
weakly bound complex is the main channel for OH(v) removal, hence the use of
equation, E4, in assigning the limit high-pressure rate coefficient, k1∞. To date, no ab
initio calculation has observed such a weakly bound complex, OH—OSO.43-44 This
suggestion links to the reaction between OH + NO2 where the weakly bound HOONO
complex was only identified in the last decade because of the inconsistencies in the rate
coefficients if OH + NO2 was just forming HONO2.45-50 The HOONO intermediate is
bound by ~100 kJ mol-149 and affects the OH + NO2 kinetics at room temperature. But
this OH—OSO complex is estimated – see above – to be bound by < 20 kJ mol-1, which
is too weakly bound to influence the kinetics at room temperature. The binding energy
of the adduct between OH and CH3OH is ~ 20 kJ mol-151 and in recent work at Leeds
it has been demonstrated that it is only below 170 K that the adduct significantly
influences the observed kinetics.52 Therefore it is mainly the OH(v) + SO2 kinetics that
points to the presence of OH—OSO but it does provide explanation of why k1∞ is so
small and exhibits little temperature dependence. If the reaction were on a barrierless
potential energy surface, k1∞ would be expected to be fast and if there was a significant
22
be observed; OH + SO2 exhibits neither of these properties. This contradiction is
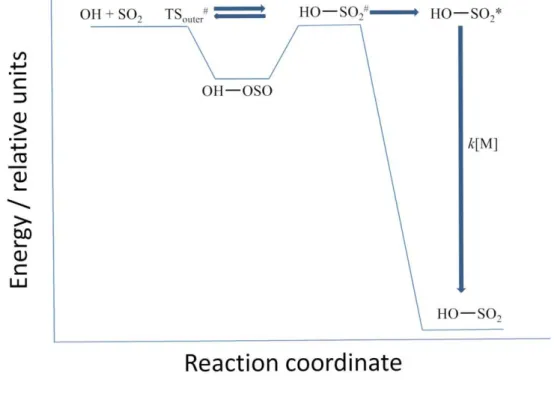
removed if the reaction occurs via a pre-reaction complex as depicted in Figure 5.
Figure 5. A qualitative potential energy surface for the reaction between OH + SO2
based on the findings from this study, where a weakly bound complex, OH-OSO, is initially formed before proceeding to product, HO-SO2.
This type of potential energy surface has been discussed in our recent paper on
OH + CH3OH 52 and it implies that the measured rate coefficient is a mixture of
complex formation and further reaction to products. The PES predicts a fast removal at
low temperatures, TSouter# controlled, and at high temperatures it is controlled by the
barrier associated with HO—SO2#. If at room temperature the rate coefficient was
controlled exclusively by HO—SO2# then it would be reasonable to expect that OH +
23
× 10-13 cm3 molecule-1 s-1) to be similar, and this appears to be the case. But it is noted
at room temperature, if TSouter# is still influencing the rate coefficient then the higher
density of states of OD—OSO compared to OH—OSO will increase k1∞. By analogy
to OH + CH3OH, at room temperature the inner TS is controlling the rate coefficient,
but not exclusively.
6. Conclusions and summary
(i) The rate coefficients for the removal OH/OD(v=1,2,3) by SO2 have been studied
as a function of temperature (295 – 810 K) using laser flash photolysis coupled
with laser induced fluorescence. The dependence of the rate coefficients on
temperature and on vibrational quantum number demonstrate that there is a
significant contribution from what has been termed non-reactive vibrational
relaxation, which is attributed to the van der Waals complex OH—OSO. This is
the first speculation on the existence of OH—OSO, which is too weakly bound to
allow significant energy redistribution, leading to incomplete IVR.
(ii) OH—OSO is mainly responsible for the observed temperature behaviour, which
is typical of cascade (v=-1) vibrational relaxation influenced by the attractive
van der Waals interaction and by the repulsive wall of the interaction potential.
(iii) Analysis of the data using a mechanism that includes both incomplete IVR, OH—
OSO, and complete IVR involving the formation of the chemically bound
HO-SO2 adduct allows k1∞, the high pressure limiting rate coefficient for formation of
the adduct, to be determined.
(iv) The data show systematically lower values for k1∞(k1,H∞ = (7.2 ± 3.3) × 10-13 and
24
both IUPAC and JPL, (2.012..00) and (1.6 ± 0.4) × 10-12 cm3 molecule-1 s-1, and in
even larger disagreement with the values for k1∞ reported by Fulle et al. using
high pressure techniques, which could be biased by not accounting for SO2
photolysis.
(v) In the companion paper, further evidence for a significantly smaller k1∞ is
explored by characterising SO2 photolysis, determining k1(p) and master equation
analysis.
Acknowledgements
We thank Mike Pilling for providing helpful discussions and proof reading this
manuscript. We are grateful to NERC (NE/K005820/1) and EPSRC (GR/T28560/01)
25
References
1. Thornton, D. C.; Bandy, A. R.; Blomquist, B. W.; Driedger, A. R.; Wade, T. P. Sulfur Dioxide Distribution over the Pacific Ocean 1991-1996. J. Geophys. Res., [Atmos.] 1999, 104, 5845-5854.
2. Bates, T. S.; Lamb, B. K.; Guenther, A.; Dignon, J.; Stoiber, R. E. Sulfur Emissions to the Atmosphere from Natural Sources. J. Atmos. Chem. 1992, 14, 315-337.
3. Leck, C.; Rodhe, H. Emissions of Marine Biogenic Sulfur to the Atmosphere of Northern Europe. J. Atmos. Chem. 1991, 12, 63-86.
4. Turner, S. M.; Liss, P. S. Measurements of Various Sulfur Gases in a Coastal Marine Environment. J. Atmos. Chem. 1985, 2, 223-232.
5. Benkovitz, C. M.; Berkowitz, C. M.; Easter, R. C.; Nemesure, S.; Wagener, R.; Schwartz, S. E. Sulfate Over the North Atlantic and Adjacent Continental Regions: Evaluation for October and November 1986 Using a Three-Dimensional Model Driven by Observation-Derived Meteorology. J. Geophys. Res., [Atmos.] 1994, 99, 20725-20756.
6. Benkovitz, C. M.; Scholtz, M. T.; Pacyna, J.; Tarrason, L.; Dignon, J.; Voldner, E. C.; Spiro, P. A.; Logan, J. A.; Graedel, T. E. Global Gridded Inventories of Anthropogenic Emissions of Sulfur and Nitrogen. J. Geophys. Res., [Atmos.] 1996, 101, 29239-29253.
7. Langner, J.; Rodhe, H. A Global Three-Dimensional Model of the Tropospheric Sulfur Cycle. J. Atmos. Chem. 1991, 13, 225-263.
8. Calvert, J. G.; Lazrus, A.; Kok, G. L.; Heikes, B. G.; Walega, J. G.; Lind, J.; Cantrell, C. A. Chemical Mechanisms of Acid Generation in the Troposphere. Nature (London) 1985, 317, 27-35.
9. Fowler, D.; Pilegaard, K.; Sutton, M. A.; Ambus, P.; Raivonen, M.; Duyzer, J.; Simpson, D.; Fagerli, H.; Fuzzi, S.; Schjoerring, J. K.; et al. Atmospheric composition change: Ecosystems-Atmosphere interactions. Atmos. Environ. 2009, 43, 5193-5267. 10. Wesely, M. L.; Cook, D. R.; Hart, R. L.; Speer, R. E. Measurements and Parameterization of Particulate Sulfur Dry Deposition over Grass. J. Geophys. Res., D: Atmos. 1985, 90, 2131-2143.
11. Stockwell, W. R.; Calvert, J. G. The Mechanism of the Hydroxyl-Sulfur Dioxide Reaction. Atmos. Environ. 1983, 17, 2231-2235.
12. Lovejoy, E. R.; Hanson, D. R.; Huey, L. G. Kinetics and Products of the Gas-Phase Reaction of SO3 with Water. J. Phys. Chem. 1996, 100, 19911-19916.
13. Reiner, T.; Arnold, F. Stratospheric SO3: Upper Limits Inferred from Ion
Composition Measurements - Implications for H2SO4 and Aerosol Formation.
Geophys. Res. Lett. 1997, 24, 1751-1754.
14. Carslaw, K. S.; Lee, L. A.; Reddington, C. L.; Mann, G. W.; Pringle, K. J. The Magnitude and Sources of Uncertainty in Global Aerosol. Faraday Disc. 2013, 165, 495-512.
26
16. Martin, D.; Jourdain, J. L.; G., L. B. Discharge Flow Measurements of the Rate Constants for the Reaction OH + SO2 + He and HOSO2 + O2 in Relation with the
Atmospheric Oxidation of Sulfur Dioxide. J. Phys. Chem. 1986, 90, 4143-4147. 17. Paraskevopoulos, G.; Singleton, D. L.; Irwin, R. S. Rates of Hydroxyl Radical Reactions. The Reaction Hydroxyl Radical + Sulfur Dioxide + Molecular Nitrogen. Chem. Phys. Lett. 1983, 100, 83-87.
18. Wine, P. H.; Thompson, R. J.; Ravishankara, A. R.; Semmes, D. H.; Gump, C. A.; Torabi, A.; Nicovich, J. M. Kinetics of the Reaction OH + SO2+ M HOSO2 +
M. Temperature and Pressure Dependence in the Fall-Off Region. J. Phys. Chem. 1984, 88, 2095-2104.
19. Cobos, C. J.; Troe, J. Theory of Thermal Unimolecular Reactions at High Pressures. II. Analysis of Experimental Results. J. Chem. Phys. 1985, 83, 1010-1015. 20. Fulle, D.; Hamann, H. F.; Hippler, H. The Pressure and Temperature Dependence of the Recombination Reaction HO + SO2 + M HOSO2 + M. Phys.
Chem. Chem. Phys. 1999, 1, 2695-2702.
21. Blitz, M. A.; Hughes, K. J.; Pilling, M. J. Determination of the High-Pressure Limiting Rate Coefficient and the Enthalpy of Reaction for OH + SO2. J. Phys. Chem.
A 2003, 107, 1971-1978.
22. Atkinson, R.; Baulch, D. L.; Cox, R. A.; Crowley, J. N.; Hampson, R. F.; Hynes, R. G.; Jenkin, M. E.; Rossi, M. J.; Troe, J. Evaluated Kinetic and Photochemical Data for Atmospheric Chemistry: Volume I - Gas Phase Reactions of Ox, HOx, NOx and SOx Species. Atmos. Chem. Phys. 2004, 4, 1461-1738.
23. Burkholder, J. B.; Sander, S. P.; Abbatt, J.; Barker, J. R.; Huie, R. E.; Kolb, C. E.; Kurylo, M. J.; Orkin, V. L.; Wilmouth, D. M.; Wine, P. H. "Chemical Kinetics and Photochemical Data for Use in Atmospheric Studies, Evaluation No. 18," JPL Publication 15-10, Jet Propulsion Laboratory, Pasadena. 2015
http://jpldataeval.jpl.nasa.gov.
24. Jaffer, D. H.; Smith, I. W. M. Time-Resolved Measurements on the Relaxation of OH(v = 1) by NO, NO2 AND O2. Faraday Disc. 1979, 67, 212-220.
25. D'Ottone, L.; Bauer, D.; Campuzano-Jost, P.; Fardy, M.; Hynes, A. J. Kinetic and Mechanistic Studies of the Recombination of OH with NO2: Vibrational Deactivation, Isotopic Scrambling and Product Isomer Branching Ratios. Faraday Disc. 2005, 130, 111-123.
26. Smith, I. W. M. The Collision Dynamics of Vibrationally Excited Molecules. Chem. Soc. Rev. 1985, 14, 141-60.
27. McKee, K. W.; Blitz, M. A.; Cleary, P. A.; Glowacki, D. R.; Pilling, M. J.; Seakins, P. W.; Wang, L. Experimental and Master Equation Study of the Kinetics of OH + C2H2: Temperature Dependence of the Limiting High Pressure and Pressure
Dependent Rate Coefficients. J. Phys. Chem. A 2007, 111, 4043-4055.
28. Aker, P. M.; Sloan, J. J. The Initial Product Vibrational-Energy Distribution in the Reaction between O(1D) and H2. J. Chem. Phys. 1986, 85, 1412-1417.
29. Alagia, M.; Balucani, N.; Cartechini, L.; Casavecchia, P.; van Kleef, E. H.; Volpi, G. G.; Kuntz, P. J.; Sloan, J. J. Crossed Molecular Beams and Quasiclassical Trajectory Studies of the Reaction O(1D)+H2(D2). J. Chem. Phys. 1998, 108,
6698-6708.
30. Dai, J. Q. Quantum state-resolved dynamics study for the reaction O(1D)+H2
->OH+H(J=0). J. Chem. Phys. 1997, 107, 4934-4942.
27
32. Blitz, M. A.; Hughes, K. J.; Pilling, M. J.; Robertson, S. H. Combined Experimental and Master Equation Investigation of the Multiwell Reaction H + SO2. J.
Phys. Chem. A 2006, 110, 2996-3009.
33. Luque, J.; Crosley, D. R. LIFBASE: Database and Spectral Simulation Program, 1.5; SRI International Report MP 99-009: 1999.
34. Lambert, J. D. Vibrational and Rotational Relaxation in Gases. Clarendon Press: Oxford, 1978.
35. Shin, H. K. Temperature Dependence of Intermolecular Energy Transfer in Polar Molecules. J. Am. Chem. Soc. 1968, 90, 3029-3039.
36. Shin, H. K. Vibrational-Rotational-Translational Energy Transfer in HF-HF and DF-DF. Chem. Phys. Letts. 1971, 10, 81-85.
37. Shin, H. K. Deexcitation of Molecular Vibrations on Collision: Vibration to Rotation Energy Transfer in Hydrogen Halides. J. Phys. Chem. 1971, 75, 1079-1090. 38. Shin, H. K. Temperature Dependence of V - R,T Energy Transfer Probabilities in CO2(0,0,1) + HF/DF. J. Chem. Phys. 1974, 60, 2167-2168.
39. Glowacki, D. R.; Reed, S. K.; Pilling, M. J.; Shalashilin, D. V.; Martinez-Nunez, E. Classical, Quantum and Statistical Simulations of Vibrationally Excited HOSO2:
IVR, Dissociation, and Implications for OH + SO2 Kinetics at High Pressures. Phys.
Chem. Chem. Phys. 2009, 11, 963-974.
40. Silvente, E.; Richter, R. C.; Hynes, A. J. Kinetics of the Vibrational Deactivation of OH X(2 )(v=3, 2, 1) with Hydrides and Reduced Sulfides. J. Chem.
Soc., Faraday Trans. 1997, 93, 2821-2830.
41. Davey, J. B.; Greenslade, M. E.; Marshall, M. D.; Lester, M. I.; Wheeler, M. D. Infrared Spectrum and Stability of a PI-type Hydrogen-Bonded Complex between the OH and C2H2 Reactants. J. Chem. Phys. 2004, 121, 3009-3018.
42. Senosiain, J. P.; Klippenstein, S. J.; Miller, J. A. The Reaction of Acetylene with Hydroxyl Radicals. J. Phys. Chem. A 2005, 109, 6045-6055.
43. Somnitz, H. Quantum Chemical and Dynamical Characterization of the Reaction OH + SO2 = HOSO2 over an Extended Range of Temperature and Pressure.
Phys. Chem. Chem. Phys. 2004, 6, 3844-3851.
44. Klopper, W.; Tew, D. P.; Gonzalez-Garcia, N.; Olzmann, M. Heat of Formation of the HOSO2 Radical from Accurate Quantum Chemical Calculations. J. Chem. Phys.
2008, 129, 114308/1-114308/7.
45. Bean, B. D.; Mollner, A. K.; Nizkorodov, S. A.; Nair, G.; Okumura, M.; Sander, S. P.; Peterson, K. A.; Francisco, J. S. Cavity Ringdown Spectroscopy of cis-cis HOONO and the HOONO/HONO2 Branching Ratio in the Reaction OH+NO2+M. J.
Phys. Chem. A 2003, 107, 6974-6985.
46. Fry, J. L.; Nizkorodov, S. A.; Okumura, M.; Roehl, C. M.; Francisco, J. S.; Wennberg, P. O. Cis-cis and trans-perp HOONO: Action Spectroscopy and Isomerization Kinetics. J. Chem. Phys. 2004, 121, 1432-1448.
47. Golden, D. M.; Barker, J. R.; Lohr, L. L. Master Equation Models for the Pressure- and Temperature-Dependant Reactions HO+NO2 HONO2 and HO+NO2
HOONO. J. Phys. Chem. A 2003, 107, 11057-11071.
48. Hippler, H.; Krasteva, N.; Nasterlack, S.; Striebel, F. Reaction of OH+NO2:
High Pressure Experiments and Falloff Analysis. J. Phys. Chem. A 2006, 110, 6781-6788.
49. Zhang, J. Y.; Donahue, N. M. Constraining the Mechanism and Kinetics of OH+NO2 and HO2+NO using the Multiple-Well Master Equation. J. Phys. Chem. A
28
50. Zhang, X.; Nimlos, M. R.; Ellison, G. B.; Varner, M. E.; Stanton, J. F. Infrared Absorption Spectra of Matrix-Isolated cis, cis-HOONO and its ab initio CCSD(T) Anharmonic Vibrational Bands. J. Chem. Phys. 2006, 124, 084305/1-084305/7. 51. Xu, S.; Lin, M. C. Theoretical Study on the Kinetics for OH Reactions with CH3OH and C2H5OH. Proc. Combust. Inst. 2007, 31, 159-166.
29
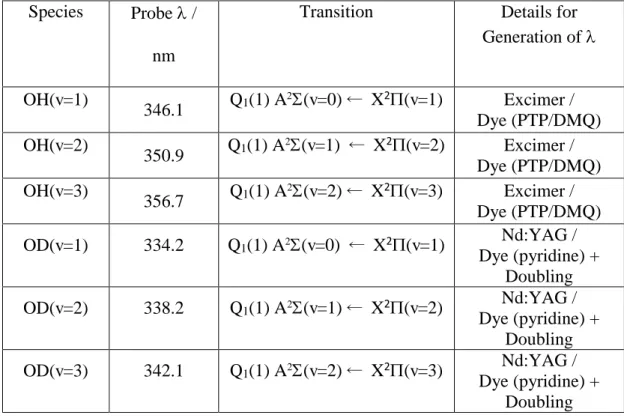
Table 1. Laser induced fluorescence excitation schemes for the detection of
OH(v=1-3) and OD(v=1-OH(v=1-3).
Species Probe /
nm
Transition Details for Generation of
OH(v=1)
346.1 Q1(1) A
(v=0) X2(v=1) Excimer / Dye (PTP/DMQ) OH(v=2)
350.9 Q1(1) A
2(v=1) X2(v=2) Excimer / Dye (PTP/DMQ) OH(v=3)
356.7 Q1(1) A
2(v=2) X2(v=3) Excimer / Dye (PTP/DMQ)
OD(v=1) 334.2 Q1(1) A2(v=0) X2(v=1) Nd:YAG /
Dye (pyridine) + Doubling
OD(v=2) 338.2 Q1(1) A2(v=1) X2(v=2) Nd:YAG /
Dye (pyridine) + Doubling
OD(v=3) 342.1 Q1(1) A2(v=2) X2(v=3) Nd:YAG /
30
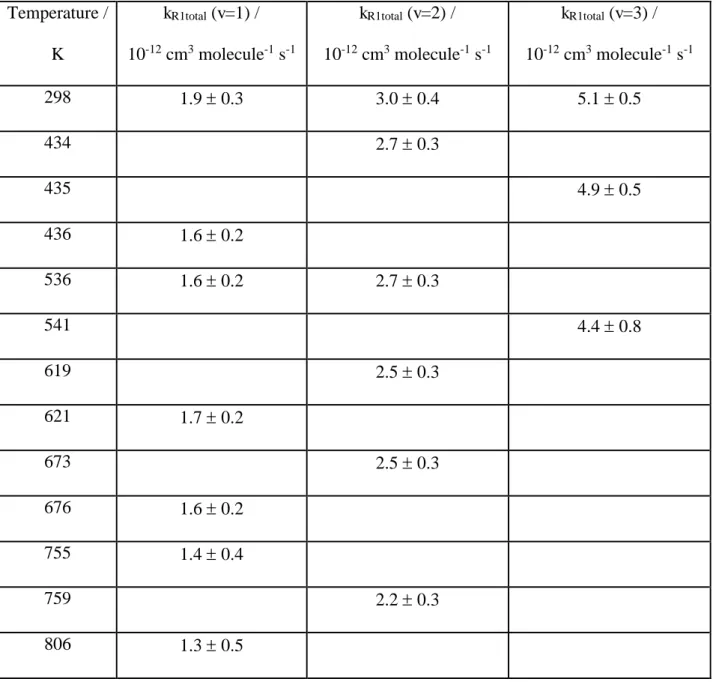
Table 2. Overall bimolecular rate coefficients (kR1total) for OH(v=1,2,3) + SO2 between
295 K and 806 K. The uncertainties are two standard deviations obtained from the linear fits of the bimolecular plots.
Temperature /
K
kR1total (v=1) /
10-12 cm3 molecule-1 s-1
kR1total (v=2) /
10-12 cm3 molecule-1 s-1
kR1total (v=3) /
10-12 cm3 molecule-1 s-1
298 1.9 0.3 3.0 0.4 5.1 0.5
434 2.7 0.3
435 4.9 0.5
436 1.6 0.2
536 1.6 0.2 2.7 0.3
541 4.4 0.8
619 2.5 0.3
621 1.7 0.2
673 2.5 0.3
676 1.6 0.2
755 1.4 0.4
759 2.2 0.3
31
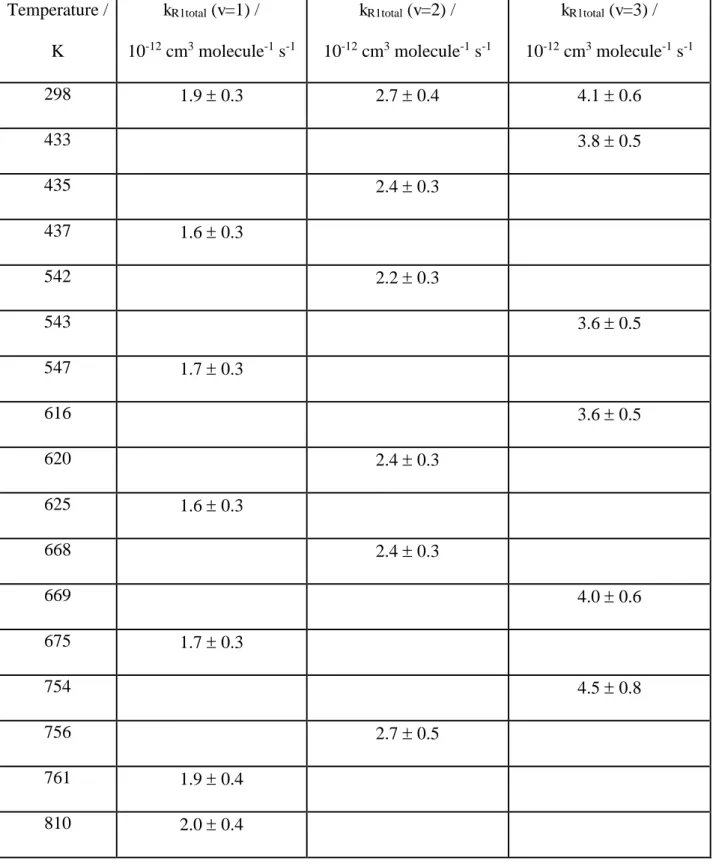
Table 3. Overall bimolecular rate coefficients (kR1total) for OD(v=1,2,3) + SO2 between
295 K and 810 K. The uncertainties are two standard deviations obtained from the linear fits of the bimolecular plots.
Temperature /
K
kR1total (v=1) /
10-12 cm3 molecule-1 s-1
kR1total (v=2) /
10-12 cm3 molecule-1 s-1
kR1total (v=3) /
10-12 cm3 molecule-1 s-1
298 1.9 0.3 2.7 0.4 4.1 0.6
433 3.8 0.5
435 2.4 0.3
437 1.6 0.3
542 2.2 0.3
543 3.6 0.5
547 1.7 0.3
616 3.6 0.5
620 2.4 0.3
625 1.6 0.3
668 2.4 0.3
669 4.0 0.6
675 1.7 0.3
754 4.5 0.8
756 2.7 0.5
761 1.9 0.4
32
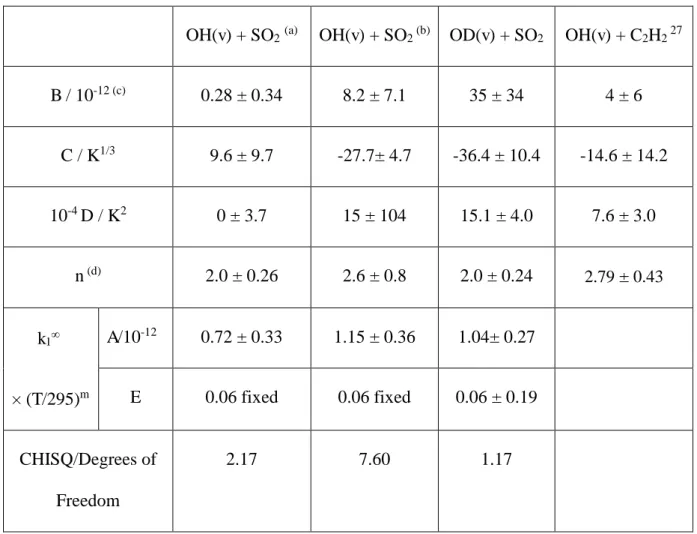
Table 4. Returned parameters from fitting the OH and OD + SO2 data to equation 4.
Errors quoted are 1
OH(v) + SO2(a) OH(v) + SO2 (b) OD(v) + SO2 OH(v) + C2H2 27
B / 10-12 (c) 0.28 ± 0.34 8.2 ± 7.1 35 ± 34 4 ± 6
C / K1/3 9.6 ± 9.7 -27.7± 4.7 -36.4 ± 10.4 -14.6 ± 14.2
10-4 D / K2 0 ± 3.7 15 ± 104 15.1 ± 4.0 7.6 ± 3.0
n (d) 2.0 ± 0.26 2.6 ± 0.8 2.0 ± 0.24 2.79 ±0.43
k1
× (T/295)m
A/10-12 0.72 ± 0.33 1.15 ± 0.36 1.04± 0.27
E 0.06 fixed 0.06 fixed 0.06 ± 0.19
CHISQ/Degrees of
Freedom
2.17 7.60 1.17
(a) In this analysis, boundary condition ensured that D did not go below 0. (b) In this analysis, boundary condition ensured that D did not go below 1.5×10⁵. (c) Units are cm3 molecule-1 s-1.
33
Figure Captions
Figures
Figure 1. Typical OH( =1) decay in the presence of SO2 (1.07 × 10¹⁶ molecule cm-3)
at 295 K, where filled squares are the measured fluorescence intensities. The total pressure is equal to 37.3 Torr and the added H2 (6.84 × 10¹⁶ molecule cm-3) ensures that
the O(1D) is titrated to OH(). The lines are a biexponential (red) and (from t=50 s) exponential (blue) fit to the data, where the decay rate coefficients are (2.69 ± 0.39) and (2.29 ± 0.02) ×104 s-1, respectively. Note that the red and blue lines converge and this is the point where the culled exponential analysis is carried out (see text for details).
Figure 2. Typical bimolecular plot for OH(v=1) at 295 K, ~ 40 Torr total pressure of
He, where the squares and circles are obtained from equations E1 (ki[SO2] = kobs) and
E2, respectively, and linear regression gives bimolecular rate coefficient of (2.24 ± 0.16) and (2.04 ± 0.01) × 10-12 cm3 molecule-1 s-1, respectively.
Figure 3. OH(v=1,2,3) + SO2 data fitted to composite function that accounts for
complex formation and non-reactive VET, SSH-type. The symbols are the data, which includes Blitz et al.,21 and the red crosses are the best fit (Equation 4, see Table 4 for
the fitting parameters). These fitting parameters predict k1= (7.1 ± 3.3)
××cm3 molecule-1 s-1, the blue line.
Figure 4. OD(v=1,2,3) + SO2 data fitted to composite function that accounts for
complex formation and non-reactive VET, SSH-type. The symbols are the data and the red crosses are the best fit (Equation 4, see Table 4 for the fitting parameters). These fitting parameters predict k1= (10.4 ± 2.5) ××cm3 molecule-1 s-1, the
blue line.
Figure 5. A qualitative potential energy surface for the reaction between OH + SO2