'Γ
eurostat
LABOUR FORCE SURVEY
eurostat
STATISTISCHES AMT DER EUROPAISCHEN GEMEINSCHAFTEN STATISTICAL OFFICE OF THE EUROPEAN COMMUNITIES OFFICE STATISTIQUE DES COMMUNAUTÉS EUROPÉENNES L-2920 Luxembourg — Tél. (352) 43 01 -1 — Telex COMEUR LU 3423 B-1049 Bruxelles, rue de la Loi 200 — Tél. (32-2) 299 11 11
Eurostat hat die Aufgabe, den Informa-tionsbedarf der Kommission und aller am Aufbau des Binnenmarktes Beteiligten mit Hilfe des europäischen statistischen Systems zu decken.
Um der Öffentlichkeit die große Menge an verfügbaren Daten zugänglich zu machen und Benutzem die Orientierung zu erleichtem, werden zwei Arten von Publi-kationen angeboten: Statistische Doku-mente und Veröffentlichungen.
Statistische Dokumente sind für den Fachmann konzipiert und enthalten das ausführliche Datenmaterial: Bezugs-daten, bei denen die Konzepte allgemein bekannt, standardisiert und wissenschaft-lich fundiert sind. Diese Daten werden in einer sehr tiefen Gliederung dargeboten. Die Statistischen Dokumente wenden sich an Fachleute, die in der Lage sind, selbständig die benötigten Daten aus der Fülle des dargebotenen Materials auszu-wählen. Diese Daten sind in gedruckter Form und/oder auf Diskette, Magnet-band, CD-ROM verfügbar. Statistische Dokumente unterscheiden sich auch optisch von anderen Veröffentlichungen durch den mit einer stilisierten Graphik versehenen weißen Einband.
Veröffentlichungen wenden sich an eine ganz bestimmte Zielgruppe, wie zum Beispiel an den Bildungsbereich oder an Entscheidungsträger in Politik und Ver-waltung. Sie enthalten ausgewählte und auf die Bedürfnisse einer Zielgruppe abgestellte und kommentierte Informa-tionen. Eurostat übernimmt hier also eine Art Beraterrolle.
Für einen breiteren Benutzerkreis gibt Eurostat Jahrbücher und periodische Veröffentlichungen heraus. Diese enthal-ten statistische Ergebnisse für eine erste Analyse sowie Hinweise auf weiteres Datenmaterial für vertiefende Unter-suchungen. Diese Veröffentlichungen werden in gedruckter Form und in Daten-banken angeboten, die in Menütechnik zugänglich sind.
Um Benutzem die Datensuche zu erleich-tern, hat Eurostat Themenkreise, d. h. eine Untergliederung nach Sachgebieten, eingeführt. Daneben sind sowohl die Statistischen Dokumente als auch die Veröffentlichungen in bestimmte Reihen, wie zum Beispiel „Jahrbücher", „Kon-junktur", „Methoden", untergliedert, um den Zugriff auf die statistischen Informa-tionen zu erleichtem.
Y. Franchet Generaldirektor
It is Eurostat's responsibility to use the European statistical system to meet the requirements of the Commission and all parties involved in the development of the single market.
To ensure that the vast quantity of ac-cessible data is made widely available, and to help each user make proper use of this information, Eurostat has set up two main categories of document: statistical documents and publications.
The statistical document is aimed at spe-cialists and provides the most complete sets of data: reference data where the methodology is well-established, stand-ardized, uniform and scientific. These data are presented in great detail. The statistical document is intended for ex-perts who are capable of using their own means to seek out what they require. The information is provided on paper and/or on diskette, magnetic tape, CD-ROM. The white cover sheet bears a stylized motif which distinguishes the statistical docu-ment from other publications.
The publications proper tend to be com-piled for a well-defined and targeted public, such as educational circles or political and administrative decision-makers. The information in these docu-ments is selected, sorted and annotated to suit the target public. In this instance, therefore, Eurostat works in an advisory capacity.
Where the readership is wider and less well-defined, Eurostat provides the infor-mation required for an initial analysis, such as yearbooks and periodicals which contain data permitting more in-depth studies. These publications are available on paper or in videotext databases. To help the user focus his research, Eurostat has created 'themes', i.e. subject classifications. The statistical documents and publications are listed by series: e.g. yearbooks, short-term trends or method-ology in order to facilitate access to the statistical data.
Y. Franchet Director-General
Pour établir, évaluer ou apprécier les dif-férentes politiques communautaires, la Comrñission européenne a besoin d'infor-mations.
Eurostat a pour mission, à travers le sys-tème statistique européen, de répondre aux besoins de la Commission et de l'en-semble des personnes impliquées dans le développement du marché unique. Pour mettre à la disposition de tous l'im-portante quantité de données accessibles et faire en sorte que chacun puisse s'orienter correctement dans cet ensem-ble, deux grandes catégories de docu-ments ont été créées: les docudocu-ments statistiques et les publications.
Le document statistique s'adresse aux spécialistes. Il fournit les données les plus complètes: données de référence où la méthodologie est bien connue, standar-disée, normalisée et scientifique. Ces données sont présentées à un niveau très détaillé. Le document statistique est des-tiné aux experts capables de rechercher, par leurs propres moyens, les données requises. Les informations sont alors disponibles sur papier et/ou sur disquette, bande magnétique, CD-ROM. La couver-ture blanche ornée d'un graphisme stylisé démarque le document statistique des autres publications.
Les publications proprement dites peu-vent, elles, être réalisées pour un public bien déterminé, ciblé, par exemple l'enseignement ou les décideurs politi-ques ou administratifs. Des informations sélectionnées, triées et commentées en fonction de ce public lui sont apportées. Eurostat joue, dès lors, le rôle de conseil-ler.
Dans le cas d'un public plus large, moins défini, Eurostat procure des éléments nécessaires à une première analyse, les annuaires et les périodiques, dans les-quels figurent les renseignements adé-quats pour approfondir l'étude. Ces publications sont présentées sur papier ou dans des banques de données de type vidéotex.
Pour aider l'utilisateur à s'orienter dans ses recherches, Eurostat a créé les thèmes, c'est-à-dire une classification par sujet. Les documents statistiques et les publications sont répertoriés par série — par exemple, annuaire, conjonc-ture, méthodologie — afin de faciliter l'accès aux informations statistiques.
LABOUR FORCE SURVEY
Results 1996
Theme
Population and social conditions
Series
Accounts and surveys
A great deal of additional information on the European Union is available on the Internet. It can be accessed through the Europa server (http://europa.eu.int).
Cataloguing data can be found at the end of this publication.
Luxembourg: Office for Official Publications of the European Communities, 1997 ISBN 92-828-1969-8
© European Communities, 1997
Reproduction is authorised provided the source is acknowledged.
Printed in Belgium
Preface
This publication presents the detailed results of the 1996 European Labour Force Survey
conducted in the Member States of the European Union in accordance with Council Regulation
(EEC) No. 3711/91 of 16 December 1991. This survey, like preceding surveys carried out
between 1983 and 1992, was based upon the International Labour Office guidelines on labour
force statistics as adopted by the 13th International Conference of Labour Statisticians in 1982
and subsequently confirmed at the 14th and 15th conferences in 1987 and 1993.
Information about the content and methodology of the survey as implemented from 1992
onwards may be found in the Eurostat publication The European Union Labour Force Survey :
Methods and Definitions -1996. Some clarification and updates to the definitions as given there
are provided below in the explanatory notes to this publication.
Eurostat wishes to thank all those involved at the national statistical offices for their contribution
to the success of the survey in preparing the questionnaires, selecting the samples,
conducting the interviews and transmitting the data to Eurostat. The preparation of this
publication was the responsibility of the unit Labour Market at Eurostat.
Signs
and abbreviations
Zero or not available
Not zero but extremely unreliable
() Unreliable data due to small size of the sample
EUR 15 All 15 member States of the European Union as in 1995
Bibliographical note
Main publications of 1996 national survey results
Belgique/België
Enquête par sondage sur les forces de travail, INS 1996
Steekproefenquête naarde beroepsbevolking, NIS 1996
Danmark
Arbejdsstyrkeundersøgelsen, Statistiske efterretninger,
Danmarks Statistik
B.R. Deutschland
Bevölkerung und Erwerbstätigkeit, Fachserie 1, Reihe 4.1,
Statistisches Bundesamt
Greece
Labour force survey, National Statistical Service of Greece
España
Encuesta de población activa
Principales resultados y resultados detallados (trimestral),
Tablas anuales, INE
France
Enquête sur l'emploi 1996, les collections de l'Insee
Ireland
Labour force survey 1996, Central Statistics Office
Italia
Rilevazione trimestrale sulle forze di lavoro, Istat
Annuario statistico italiano, Istat
Luxembourg
Bulletin du Statec
Nederland
Enquête beroepsbevolking 1996, CBS
Portugal
Inquérito ao emprego 1996, INE
United Kingdom
Table of contents
Page
Explanatory notes 9
Population and activity
Graphs
1 Activity by sex and age-groups, 1996 16
2 Population aged 25 to 59 years with a third-level education, EUR15 -1996 18
3 Population aged 25 to 59 years who have completed second-level education, EUR15 -1996 18
4 Population by sex, age and marital status - EUR15 -1996 19
5 Activity of young persons aged 15 to 24 years -1996 19
Tables
001 Principal characteristics of activity of the population (1,000 / %) 20
002 Principal characteristics of activity of young persons aged 15 to 24 years (1,000 / %) 22
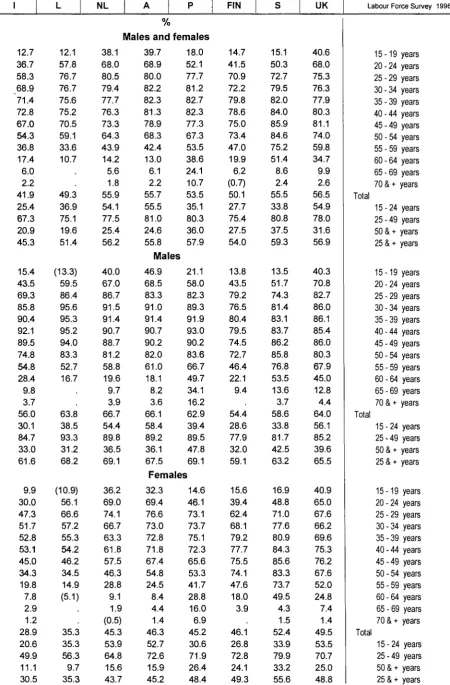
003 Activity rates by age groups (%) 24
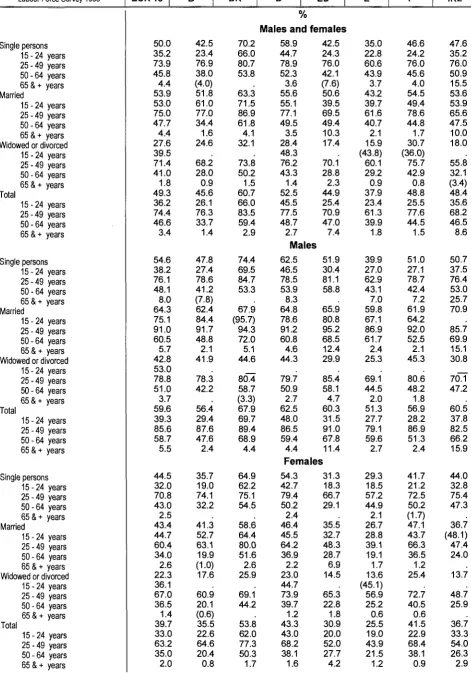
004 Activity rates by marital status and broad age groups (%) 26
005 Activity rates by nationality and broad age groups (%) 28
006 Employment/population ratios by age groups (%) 30
007 Employment/population ratios by marital status and broad age groups (%) 32
008 Unemployment rates by age groups (%) 34
009 Unemployment rates by marital status and broad age groups (%) 36
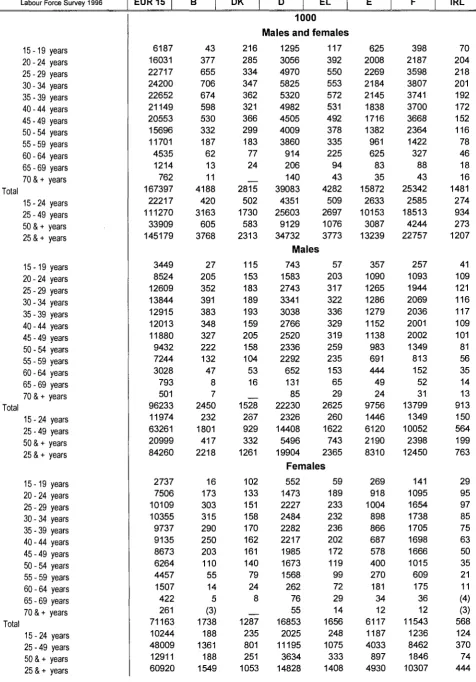
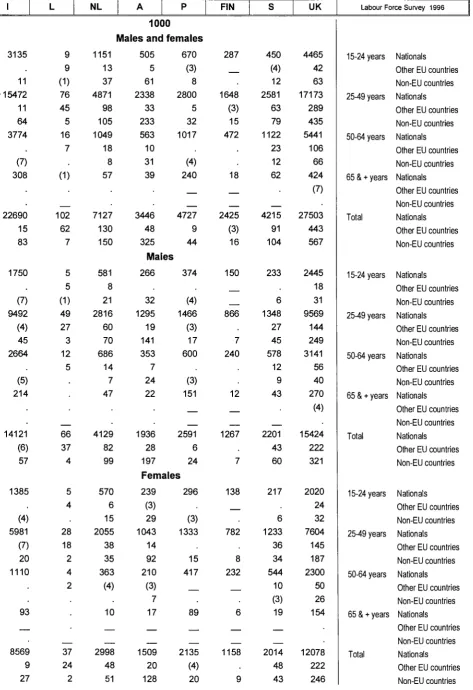
010 Total population by age groups (1,000) 38
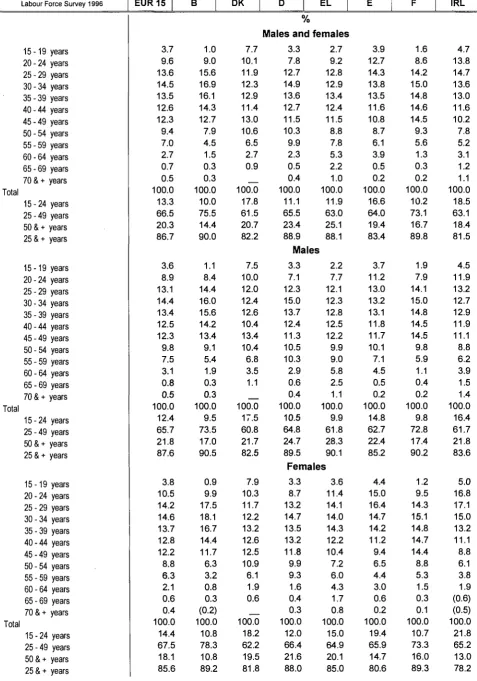
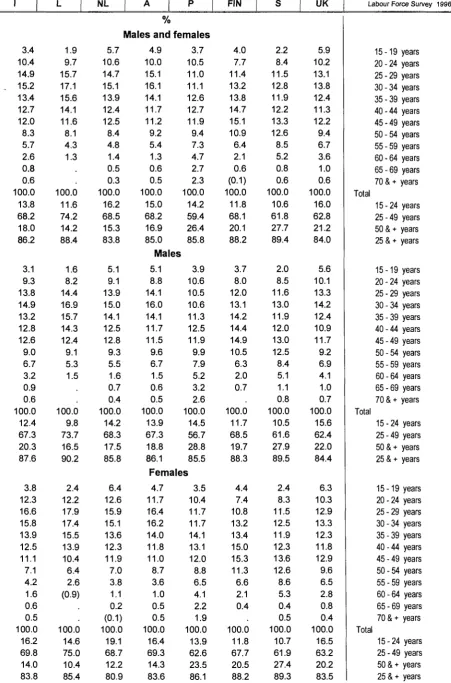
011 Total population by age groups (%) 40
012 Non-national population by broad age groups (1,000) 42
013 Non-national population by broad age groups (%) 44
014 Labour force by age groups (1,000) 46
015 Labour force by age groups (%) 48
016 Labour force by nationality and broad age groups (1,000) 50
017 Labour force by nationality and broad age groups (%) 52
018 Persons in employment by age groups (1,000) 54
019 Persons in employment by age groups (%) 56
020 Unemployed persons by age groups (1,000) 58
021 Unemployed persons by age groups (%) 60
022 Inactive persons by age groups (1,000) 62
023 Inactive persons by age groups (%) 64
024 Young persons aged 15 to 24 years in education - rate of participation in education (1,000) 66
025 Unemployment rates of persons aged 25 to 59 years by educational attainment level (%) 68
026 Population aged 15 and over by degree of urbanisation (1,000) 70
027 Population aged 15 and overby degree of urbanisation (%) 72
028 Unemployment rates, employment/population ratios, and activity rates by degree of
urbanisation (%) 74
029 Employment status by educational attainment level of persons aged 25 to 59 years (1,000) 76
030 Employment status by educational attainment level of persons aged 25 to 59 years (%) 78
031 Educational attainment level by employment status of persons aged 25 to 59 years (%) 80
Employment
Graphs
6 Employment by sex, age and professional status - EUR15 -1996 84
7 Employment by sex, age and sector of activity - EUR15-1996 84
8 Persons in employment by occupation, EUR15 -1996 85
9 Persons in employment by sector of economic activity - EUR15 -1996 85
10 Share of involuntary part-time in the part-time employment -1996 86
12 Percentage of employees with temporary job -1996 87
13 Total duration of work contract of limited duration - EUR15 -1996 87
Tables
032 Persons in employment by professional status (1,000) 88
033 Persons in employment by sector of activity (1,000) 88
034 Persons in employment by professional status (%) 90
035 Persons in employment by sector of activity (%) 90
036 Persons in employment by professional status and sector of activity (1,000) 92
037 Persons in employment by professional status and sector of activity (%) 94
038 Persons in employment by sector of activity and professional status (1,000) 96
039 Persons in employment by sector of activity and professional status (%) 98
040 Persons in employment by economic activity (NACE Rev.1) (1,000) 100
041 Persons in employment by economic activity (NACE Rev.1) (%) 102
042 Employees by economic activity (NACE Rev.1) (1,000) 104
043 Employees by economic activity (NACE Rev.1) (%) 106
044 Persons in employment by occupation (ISCO-88(COM)) (1,000) 108
045 Persons in employment by occupation (ISCO-88(COM)) (%) 110
046 Employees by occupation (ISCO-88(COM)) (1,000) 112
047 Employees by occupation (ISCO-88(COM)) (%) 114
048 Persons working full-time/part-time by broad age groups (1,000) 116
049 Persons working full-time/part-time by broad age groups (%) 118
050 Persons in employment by professional status and full-time/part-time breakdown (1,000) 120
051 Persons in employment by professional status and full-time/part-time breakdown (%) 122
052 Persons in employment by sector of activity and full-time/part-time breakdown (1,000) 124
053 Persons in employment by sector of activity and full-time/part-time breakdown (%) 126
054 Employees by sector of activity and full-time/part-time breakdown (1,000) 128
055 Employees by sector of activity and full-time/part-time breakdown (%) 130
056 Non-employees by sector of activity and full-time/part-time breakdown (1,000) 132
057 Non-employees by sector of activity and full-time/part-time breakdown (%) 134
058 Married women - sector of activity by full-time/part/time breakdown (1,000/ %) 136
059 Persons working part-time by reason (1,000 / %) 138
060 Persons working shiftwork, in the evening or at night (1,000) 140
061 Persons working shiftwork, in the evening orat night (%) 142
062 Persons working on Saturday, Sunday orfrom home (1,000) 144
063 Persons working on Saturday, Sunday orfrom home (%) 146
064 Employees with a temporary job by reason (1,000 / %) 148
065 Reasons for total absence from work during the reference week (1,000/ %) 150
066 Percentage of employees aged 25 to 59 receiving training during the
previous four weeks by sector of activity (NACE Rev.1) (1,000/%) 152
067 Persons in employment with more than one job by professional status of the second job (1,000).. 154
068 Persons in employment with more than one job by sector of activity of the second job (1,000) 154
069 Persons in employment with more than one job by professional status of the second job (%) 156
070 Persons in employment with more than one job by sector of activity of the second job (%) 156
Working time
Graphs
14 Average hours usually worked per week - Males -1996 160
15 Average hours usually worked per week - Females -1996 160
16 Shift work-1996 161
17 Night work-1996 161
18 Saturday work-1996 161
19 Sunday work-1996 161
20 Usual hours worked per week - employees working full-time -1996 162
21 Usual hours worked per week - employees working part-time-1996 162
22 Average number of hours usually worked per week by sector of activity
(employees) - EUR15 -1996 163
Tables
071 Persons in employment - comparison of average usual and average
actual number of hours worked by sector of activity (hrs) 164
072 Employees - average hours usually worked per week by economic
activity (NACE Rev.1) (hrs) 166
073 Employees working full-time - average hours usually worked per week by
economic activity (NACE Rev.1) (hrs) 168
074 Employees working part-time - average hours usually worked per week by
economic activity (hrs) 170
075 Employees-average hours usually worked per week by occupation (ISCO-88(COM)) (hrs) 172
076 Persons in full-time employment - groups of hours usually worked per week (%) 174
077 Persons in full-time employment - groups of hours actually worked during
the reference week (%) 176
078 Persons in part-time employment-groups of hours usually worked per week (%) 178
079 Persons in part-time employment - groups of hours actually worked during
the reference week (%) 180
080 Employees in industry working full-time - groups of hours usually worked per week
by economic activity (NACE Rev.1) (%) 182
081 Employees in services working full-time - groups of hours usually worked per week
by economic activity (NACE Rev.1) (%) 186
082 Employees in industry and services working part-time - groups of hours usually
worked per week (%) 190
083 Persons in full-time employment - detailed groups of hours actually worked during the
reference week (%) 192
084 Persons in full-time employment - detailed groups of hours usually worked per week
(%) 194
085 Persons in full/part-time employment - differences between usual and actual hours
(1,000) 196
086 Persons in full/part-time employment - differences between usual and actual hours (%) 198
087 Persons in employment having worked during the reference week - reasons for
differences between usual and actual hours (1,000) 200
088 Persons in employment having worked during the reference week reasons for
differences between usual and actual hours (%) 202
089 Persons in employment having worked during the reference week - average difference
in hours between usual and actual hours (hrs) 204
090 Persons in employment with a second job - number of persons and average hours
actually worked in second job during the reference week (1,000 / hours) 206
091 Persons in employment with a second job - type of second job by hours
actually worked during the<R>reference week (%) 208
Unemployment and search for work
Graphs
24 Population aged 25 to 59 years with third level education -1996 213
25 Population aged 25 to 59 years who have completed second-level education -1996 213
26 Population aged 25 to 59 years who have completed a level equal to
or lower than the first stage of secondary education -1996 213
22 Unemployment rate and percentage of long term unemployed in total of unemployed 214
Tables
092 Principal characteristics of the unemployed (1,000) 216
093 Principal characteristics of the unemployed (%) 218
094 Principal characteristics of the young unemployed aged 15 to 24 years (1,000) 220
095 Principal characteristics of the young unemployed aged 15 to 24 years (%) 222
098 Duration of unemployment for the main groups of unemployed (1,000) 228
099 Duration of unemployment for the main groups of unemployed (%) 230
100 Duration of unemployment by broad age groups (1,000) 234
101 Duration of unemployment by broad age groups (%) 234
102 Unemployed having lost/left job as employee due to economic reasons by
previous economic activity (NACE Rev.1) (1,000) 236
103 Unemployed having lost/left job as employee due to economic reasons by
previous economic activity (NACE Rev.1) (%) 238
104 Unemployed having lost/left job as employee due to economic reasons by
occupation of last job (ISCO-88(COM)) (1,000) 240
105 Unemployed having lost/left job as employee due to economic reasons by
occupation of last job (ISCO-88(COM)) (%) 242
106 Unemployed seeking employment by broad age group and type of
employment sought (1,000) 244
107 Unemployed seeking employment by broad age group and type of
employment sought (%) 246
108 Unemployed seeking employment by method of job search (1,000) 248
109 Unemployed seeking employment by method of job search (%) 250
110 Inactive persons- reasons for not seeking employment (1,000) 252
111 Inactive persons - reasons for not seeking employment (%) 254
112 Persons having a job and seeking another by broad age groups and reasons (1,000) 256
113 Persons having a job and seeking another by broad age groups and reasons (%) 258
Households
Graphs
26 Composition of private households-EUR15-1996 263
27 Households of one person by sex and age - EUR15 -1996 263
Tables
114 Number of private households by household type (children under 15) (1,000/ %) 264
115 Activity rates and unemployment rates by household type (children under 15) (%) 266
116 Number of private households by age of youngest person in the household (1,000) 268
117 Number of private households by age of youngest person in the household (%) 268
118 Unemployed by relationship to head of household (1,000) 270
119 Unemployed by relationship to head of household (%) 270
120 Duration of unemployment by relationship to head of household (1,000) 274
Explanatory notes
Organization of the survey
The content of the European Labour Force Survey is
determined by the Statistical Office of the European
Union (Eurostat), together with the national experts of
the Member States. An agreed coding scheme is then
used by the Member States in transmitting the data.
A summary presentation of the type of information
covered by the survey was included in Article 4 of
Council Regulation (EEC) N° 3711/91 which formed
the legal basis for surveys from 1992 onwards.
The national statistical institutes are responsible for
selecting the sample, preparing the questionnaires,
conducting the direct interviews among households,
and forwarding the results to Eurostat in accordance
with the standard coding scheme.
Eurostat devises the programme for analysing the
results and is responsible for processing and
disseminating the information forwarded by the
national institutes.
A detailed description of the sampling methods, the
adjustment procedures, the definitions and the
common Community coding currently used in the
labour force survey is presented in the publication
The European Union Labour Force Survey - Methods
and definitions, 1996.
Reference period
The labour force characteristics of each person
interviewed refer to his situation in a particular
reference week.
As a general rule the reference week should be a
normal week in spring excluding bank holidays. For
countries using a fixed week such as Italy, this
requirement is easy to fulfil. In some countries,
however, the reference week is the one preceding the
week of the interview and, as the survey extends over
a period of time, the mobile reference week method is
used. In this case it cannot be guaranteed that the
reference week represents a normal week.
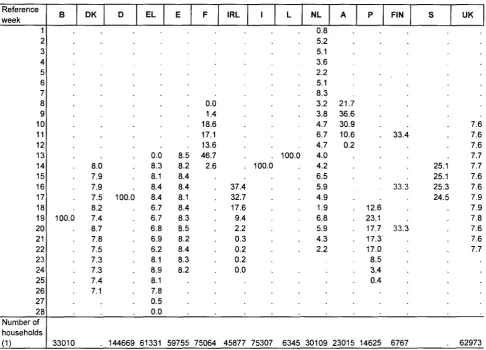
For the 1996 survey, the distribution of the reference
weeks is presented in table 1.
Field of survey
The survey is intended to cover the whole of the
resident population, i.e. all persons whose usual
place of residence is in the territory of the 15 Member
States of the EU.
For technical and methodological reasons, however,
it is not possible in all the countries to include the
population living in collective households, i.e. persons
living in homes, boarding schools, hospitals, religious
institutions, workers' hostels, etc.
Consequently, for the purposes of harmonizing the
field of survey, the Community results are compiled
on the basis of the population of private households
only. This comprises all persons living in the
households surveyed during the reference week. This
definition also includes persons absent from the
household for short periods due to studies, holidays,
illness, business trips, etc.
The sampling method was designed separately by
each national statistical office in the light of the
experience and practices of the individual Member
States. The design adopted in each case was
required by the Regulation to ensure a certain
minimum reliability at regional level, expressed as
follows :
the sampling plan shall guarantee that for
characteristics relating to 5% of the population of
working age the relative standard error at NUTS II
level (or equivalent) does not exceed 8%, assuming
the design effect for the variable 'unemployment.'
(Council Regulation (EEC) No. 3711/91, Article 3.2)
The number of private households for which data was
finally available from each Member State is presented
in table 1.
Reliability of the results
Sampling error
As with any sample survey, the results of the labour
force survey are subject to sampling error. It is almost
certain that somewhat different figures would have
been obtained if a complete census had been carried
out using the same questionnaires, interviewers,
supervisors, data-processing techniques, etc. as
those used in the labour force survey. This difference
is known as the sampling error of the estimate.
In a given sample, there are basically two factors
which account for the relative magnitude of the
sampling error of a characteristic: the frequency with
which it occurs, and the evenness with which it is
distributed among the population. Of two estimates,
the larger is likely to have a smaller per cent sampling
error, while of two estimates of comparable size the
one which refers to a characteristic more evenly
spread throughout the population would, in general,
be subject to smaller relative sampling variability.
In this publication results likely to have very wide
margins of relative sampling variability have been
replaced by a dot, while other relatively imprecise
estimates are shown within brackets.
Survey response
A significant source of non-sampling error in the
labour force survey is the effect of non-response on
the results. Non-response rate is normally less than
10% in the countries where the survey is compulsory,
but can reach 40% in countries where the survey is
voluntary. Adjustment for non-response in the
majority of countries was made by re- weighting the
results while in some cases the method used was
'duplication' or 'substitution' of units. Quality checks
carried out in various countries suggest that
one-person households may be under-represented in the
sample as they tend to be more difficult to contact
than households containing several persons.
Weighting
The 1996 survey results were weighted up to
independently derived population estimates for
various categories of age, sex, region, nationality,
etc. categories. More information about weighting and
adjustment procedures can be found in The
European Union Labour Force Survey - Methods and
definitions, 1996.
Basic concepts and definitions
(b) the length of the period since the last job was held
(if this period is shorter than the duration of search for
a job).
The labour force is defined as the sum of persons in
employment and unemployed persons.
Inactive persons are those who are not classified as
persons in employment nor as unemployed persons.
Activity rates represent the labour force as a
percentage of the population of working age.
Employment/population ratios represent persons in
employment as a percentage of the population of
working age.
Unemployment rates represent unemployed persons
as a percentage of the labour force.
The above rates are usually calculated for sex/age
groups and sometimes further cross-classified by
other demographic variables. A flowchart with the
labour force classification in the European Labour
Force Survey is provided on page 13.
Comparability with previous surveys
The concepts and definitions used in the survey are
those contained in the Recommendation of the 13th
International Conference of Labour Statisticians,
convened in 1982 by the International Labour
Organisation (and therefore referred to throughout
these notes as the 'ILO guidelines'). In accordance
with the ILO guidelines, the definitions given below
are applied. All these definitions apply to persons
aged 15 years and over, living in private households.
Persons in employment are those who during the
reference week did any work for pay or profit, or were
not working but had jobs from which they were
temporarily absent. Family workers are also included.
Unemployed persons are those who, during the
reference week :
The concepts and definitions used in the European
Labour Force Survey have been derived from the ILO
guidelines since 1983. This has guaranteed the
comparability of the results between all the surveys
held since that year. The results of surveys held
before 1983 are not comparable since they were not
based upon these guidelines.
The integration into the 1992 series of a more exact
implementation of the guidelines implies that the
degree of comparability between the 1983-91 series
and the new series from 1992 is slightly less than the
comparability within each series. However, the fact
that both sets of definitions continue to rest upon the
ILO guidelines ensures that the differences are
minimal. These differences are explained in detail in
the publication The European Union Labour Force
Survey - Methods and definitions, 1996.
(a) had no employment, and
(b) were available to start work within the next two
weeks, and
(c) had actively sought employment at some time
during the previous four weeks.
In addition, unemployed persons include those who
had no employment and had already found a job to
start later.
Duration of unemployment is defined as:
(a) the duration of search for a job, or
Implementation of the survey at national level
Some difficulties persist in the codification of the
national classifications on occupations into the
ISCO-88 (COM) classification. These are due not only to
the differences in the systems themselves, but also to
varying perceptions of particular jobs, even between
countries with similar systems of production.
Furthermore, Germany and two new Member States,
Finland and Sweden, were unable to provide data for
ISCO-88(COM).
The very high rate of non-response for Germany in
tables 29, 30 and 31 is due to the fact that the
corresponding questions are not compulsory.
In Denmark and Sweden the sample unit is the
individual instead of the household. In 1996, no data
on the composition of the household were provided
by these two countries.
In the Danish survey, only persons aged between 15
and 66 are interviewed. A number of persons aged
less than 15 years or more than 66 years is added to
this main sample, but for these individuals the only
information available is demographic data; people
aged over 66 are automatically coded as being
retired.
In Sweden, the main survey covers persons aged
between 15 and 74 years; a sample of other persons
is added using the same method as in Denmark.
In the United Kingdom persons shown as 'registered
unemployed' are, in fact, claimants to unemployment
benefit. Data on recipients of unemployment benefit
are not available.
The German questionnaire underwent considerable
changes in 1996, as a result of which it is possible to
detect some breaks in series by comparison with the
data published for earlier years.
Contents of this publication
Certain tables showing absolute figures do not show
the category 'not stated' in the breakdown, thus it is
possible that the aggregate of the breakdown does
not correspond to the total.
Table 1 : Distribution of the interviews by reference week (in % of the total of the interviews done in each country in 1996 )
Reference week
1 2 3 4 5 6 7 8 9 10 11 12 13 14 15 16 17 18 19 20 21 22 23 24 25 26 27 28 Number of households (1)
Β DK D EL
100.C
8.0 7.9 7.9
7.5 100.C
8.2 7.4 8.7 7.8 7.5 7.3 7.3 7.4 7.1
O.C 8.3 8.1 8.4 8.4 6.7 6.7 6.8 6.S 6.2 8.1 8.9 8.1 7.8 0.5 O.C
33010 . 144669 61331
E
8.5 8.2 8.4 8.4 8.1 8.4 8.3 8.5 8.2 8.4 8.3 8.2
59755
F
O.C 1.4 i8.e 17.1 i3.e
46.7 2.e
75064
IRL I L NL
0.8
100.C 37.4 32.7 17.6
9.4 2.2 0.3 0.2 0.2 0.0
5.2 5.1 3.6 2.2 5.1 8.3 3.2 3.8 4.7 6.7 4.7
100.0 4.0
4.2 6.5 5.9 4.9 1.9 6.8 5.9 4.3 2.2
45877 75307 6345 30109
A
21.7 36.6 30.9 10.6
0.2
23015
Ρ
12.6 23.1 17.7 17.2 17.C
8.5 3.4 0.4
14625
FIN
33.4
33.3
33.3
.
6767
S
25.1 25.1 25.2 24.5
UK
7.6 7.6 7.6 7.7 7.7 7.6 7.6 7.9 7.9 7.8 7.6 7.6 7.7
Labour force classification in the European Union Labour Force Survey
Person of 15 years or more living in a private household
Person did any work for pay or profit during the reference week
Person was not working but had a job or business from which absent in the
reference week
>
_Nk_
Employed
person
"/ΤΓ
Unpaid family worker
Person was not seeking employment because a job which would start later had already been found
Person was seeking em ployment
_SZ
Labour
force
7rs"
Person had during last 4 weeks taken active steps to find a job
Person could have
started to work immediately (within 2 weeks)
Yes
_i>l¿_
J ^ Unemployed
' I person
Graph 1: Activity by sex and age-groups, 1996
M-tt BO ( i e i - · * eo-n TS-TB 70-74 β!-M
i
ι:
ι
t
JAFemales "■·* Ί
H 4 4 7»-Τ· 70-74 Μ-Μ
| i
... .... Ι
Females
In % or total population in % of total population in % of total population in % of total population
In % of total population In % of total population in % of total population in % of total population
EL
Un Males
! ! Γ
ímpoyeo i ¡ \ J „...[...Inactiva..
M
¡m
;
" < U H
I .
;
; ~
,
4.5 3 1.5in % ottotal population
i Β*·ββ
B O - M
B O M 7 V 7 » 70-74
li
10-14 ) Cage
ι
~1~l_ Females i
■ ' I
I 1 .
m v
mm
B L
■ i
M
P ^
¿
. .
.:!«~—*~' —y--"
1.5 3 4.5
Ín % of total population in % of total population ín % of total population
E
Males UnemployedJ
SC .0 4 Β*-β» Κ - β 4 7S-7B 70-74 es-aaΗ·β 4
III
J
¡
_ J
Females IRL Males Unemployed
»»
«A-»a • 0 - « 4 7S-7I
H-i
Females
in % of total population In % of total population in % ol total population in % of lotal population
Hi-BO es- n • 0 4 4 7S-70 70-74 0 5 - 0 0
i
I I
1 1
Females
in % of total population in % of total population In % of total population in % of lotal population
in % of total population in % of total population
FIN
Une
4
Males j r '
nployed Γ
1 !
as. M
BO-04 a s - i a 0 0 - 0 4 7S-70 70-74
\ ! Inactive"! «·»
\
_■
J T ^ H H
iL- ,
5 3 1.5 in % of total population
1
FemalesI !
1 ί
..._ 1 1 !
I
= ;
Cage
... J
Bfr
■*-' 1 ; „]
1.5 3 4
in % of total population
5
Graph 2: Population aged 25 to 59 years with
a third-level education, EUR 15 -1996
in % of the population of each sex and each age group
50
40
30
20
10
25-29 30-34 35-39 40-44 45-49
■ Males H Females
5054 5559 Age group
Graph 3: Population aged 25 to 59 years who have
completed second-level education, EUR 15 -1996
in % of the population of each sex and each age group
2529 3034 35-39 4044 45-49 50-54
Males Ü Females
Graph 4: Population by sex, age and marital status - EUR 15 - 1 9 9 6
Widowed
or
divorced
4.5 3 1.5
in % of total population
1.5 3
in % of total population
Graph 5 : Activity of young persons aged 15 to 24 years - 1 9 9 6
100
80
60
40
20
¡¡κ
s«« paasj f™q psas
MM
¡g™ ^
p.«« ««< y ^ .
ΕΕΕΪι I Ι ι I Ι ι ι Ι ι I Ι ι I Ι ι I Ι ι I Ι ι I t ι I Ι ι
ι I Ι ι I Ι ι I Ι ι
B DK D EL E F IRL I L ML A Ρ FIN S UK
□ Inactive students ^ Inactive
■ Unemployed
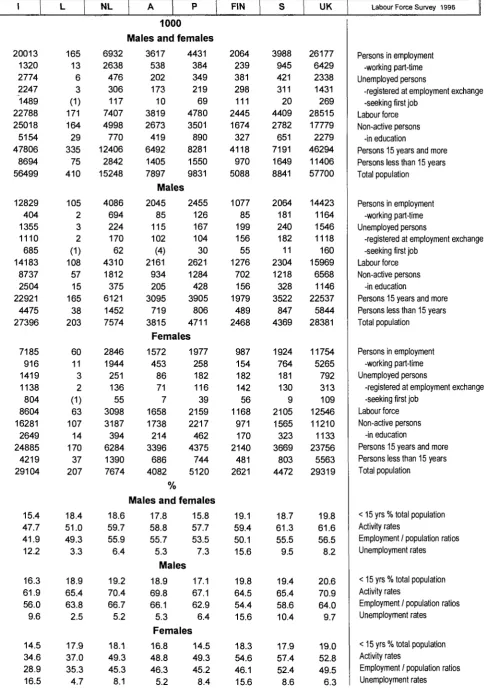
Table 001
eurostat
Principal characteristics of activity of the population
Labour Force Survey 1996 EUR 15 DK EL IRL
Persons in employment -working part-time Unemployed persons
-registered at employment exchange -seeking first job
Labour force Non-active persons
-in education
Persons 15 years and more Persons less than 15 years Total population
Persons in employment -working part-time Unemployed persons
-registered at employment exchange -seeking first job
Labour force Non-active persons
-in education
Persons 15 years and more Persons less than 15 years Total population
Persons in employment -working part-time Unemployed persons
-registered at employment exchange -seeking first job
Labour force Non-active persons
-in education
Persons 15 years and more Persons less than 15 years Total population
< 15 yrs % total population Activity rates
Employment / population ratios Unemployment rates
< 15 yrs % total population Activity rates
Employment / population ratios Unemployment rates
< 15 yrs % total population Activity rates
Employment / population ratios Unemployment rates
149147 24381 18250 14680 3742 167397 135306 25979 302703 64146 366848 86824 4754 9410 7854 1671 96233 49534 12719 145767 32954 178721 62323 19627 8840 6827 2071 71163 85772 13260 156936 31191 188127
17.5 55.3 49.3 10.9 18.4 66.0 59.6 9.8 16.6 45.3 39.7 12.4
3791 532 397 370 78 4188 4120 860 8307 1817 10124 2268 67 181 172 33 2450 1573 427 4023 931 4953 1522 465 216 198 44 1738 2547 433 4285 886 5171
17.9 50.4 45.6 9.5 18.8 60.9 56.4 7.4 17.1 40.6 35.5 12.4
2623 563 193 123 8 2815 1503 206 4318 895 5213 1444 156 85 55 1528 598 85 2126 457 2584 1179 407 108 69 5 1287 905 122 2192 438 2630
17.2 65.2 60.7 6.8 17.7 71.9 67.9 5.5 16.7 58.7 53.8 8.4
1000
Males and females
35634 5885 3449 3211 209 39083 28754 4716 67837 12923 80760
Males
20397 772 1832 1730 112 22230 10383 2420 32612 6679 39291
3868 206 413 45 206 4282 4340 790 8622 1633 10254 2467 81 158 21 64 2625 1466 379 4091 842 4933
Females
15236 5113 1617 1481 97 16853 18371 2296 35224 6244 41468
%
Males and f
16.0 57.6
1401 125 255 24 142 1656 2874 411 4531 790 5321
smales
15.9 49.7 52.5 44.9
8.8 9.7
Males
17.0 68.2
17.1 64.2 62.5 60.3
8.2 6.0
Females
15.1 47.8 43.3 9.6
14.9 36.6 30.9 15.4
12342 987 3530 3062 773 15872 16679 3891 32552 6296 38848 8027 252 1729 1533 292 9756 5904 1854 15659 3241 18900 4315 735 1802 1529 481 6117 10776 2037 16892 3055 19948
16.2 48.8 37.9 22.2 17.1 62.3 51.3 17.7 15.3 36.2 25.5 29.5
22195 3554 3148 2756 351 25342 20102 4654 45445 11129 56574 12330 646 1469 1310 142 13799 7878 2229 21678 5692 27369 9865 2907 1679 1446 209 11543 12224 2425 23767 5437 29204
19.7 55.8 48.8 12.4 20.8 63.7 56.9 10.6 18.6 48.6 41.5 14.5
1308 151 174 124 31 1481 1218 344 2700 861 3561 807 40 107 90 17 913 419 168 1333 442 1775 501 111 67 34 14 568 799 176 1367 419 1786
\=M
eurostat1
20013 1320 2774 2247 1489 22788 25018 5154 47806 8694 56499
12829 404 1355 1110 685 14183 8737 2504 22921 4475 27396
7185 916 1419 1138 804 8604 16281 2649 24885 4219 29104
L
165 13 6 3 (1) 171 164 29 335 75 410
105 2 3 2 (1) 108 57 15 165 38 203
60 11 3 2 (1) 63 107 14 170 37 207
NL
6932 2638 476 306 117 7407 4998 770 12406 2842 15248
4086 694 224 170 62 4310 1812 375 6121 1452 7574
2846 1944 251 136 55 3098 3187 394 6284 1390 7674
A
Table 001
Principal characteristics of activity of the population
P
1000
viales and females
3617 538 202 173 10 3819 2673 419 6492 1405 7897
4431 384 349 219 69 4780 3501 890 8281 1550 9831
Males
2045 85 115 102 (4) 2161 934 205 3095 719 3815
2455 126 167 104 30 2621 1284 428 3905 806 4711
Females
1572 453 86 71 7 1658 1738 214 3396 686 4082
1977 258 182 116 39 2159 2217 462 4375 744 5120
FIN
2064 239 381 298 111 2445 1674 327 4118 970 5088
1077 85 199 156 55 1276 702 156 1979 489 2468
987 154 182 142 56 1168 971 170 2140 481 2621
S
3988 945 421 311 20 4409 2782 651 7191 1649 8841
2064 181 240 182 11 2304 1218 328 3522 847 4369
1924 764 181 130 9 2105 1565 323 3669 803 4472
UK
26177 6429 2338 1431 269 28515 17779 2279 46294 11406 57700
14423 1164 1546 1118 160 15969 6568 1146 22537 5844 28381
11754 5265 792 313 109 12546 11210 1133 23756 5563 29319
Labour Force Survey 1996
Persons in employment -working part-time Unemployed persons
-registered at employment exchange -seeking first job
Labour force Non-active persons
-in education
Persons 15 years and more Persons less than 15 years Total population
Persons in employment -working part-time Unemployed persons
-registered at employment exchange -seeking first job
Labour force Non-active persons
-in education
Persons 15 years and more Persons less than 15 years Total population
Persons in employment -working part-time Unemployed persons
-registered at employment exchange -seeking first job
Labour force Non-active persons
-in education
Persons 15 years and more Persons less than 15 years Total population
%
Males and females
15.4 47.7 41.9 12.2
16.3 61.9 56.0 9.6
14.5 34.6 28.9 16.5
18.4 51.0 49.3 3.3
18.9 65.4 63.8 2.5
17.9 37.0 35.3 4.7
18.6 59.7 55.9 6.4
19.2 70.4 66.7 5.2
18.1 49.3 45.3 8.1
17.8 58.8 55.7 5.3
Males
18.9 69.8 66.1 5.3
15.8 57.7 53.5 7.3
17.1 67.1 62.9 6.4
Females
16.8 48.8 46.3 5.2
14.5 49.3 45.2 8.4
19.1 59.4 50.1 15.6
19.8 64.5 54.4 15.6
18.3 54.6 46.1 15.6
18.7 61.3 55.5 9.5
19.4 65.4 58.6 10.4
17.9 57.4 52.4 8.6
19.8 61.6 56.5 8.2
20.6 70.9 64.0 9.7
19.0 52.8 49.5 6.3
< 15 yrs % total population Activity rates
Employment / population ratios Unemployment rates
< 15 yrs % total population Activity rates
Employment / population ratios Unemployment rates
< 15 yrs % total population Activity rates
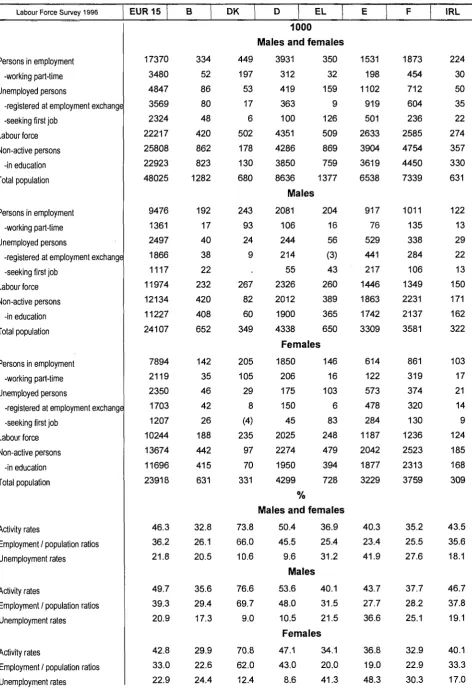
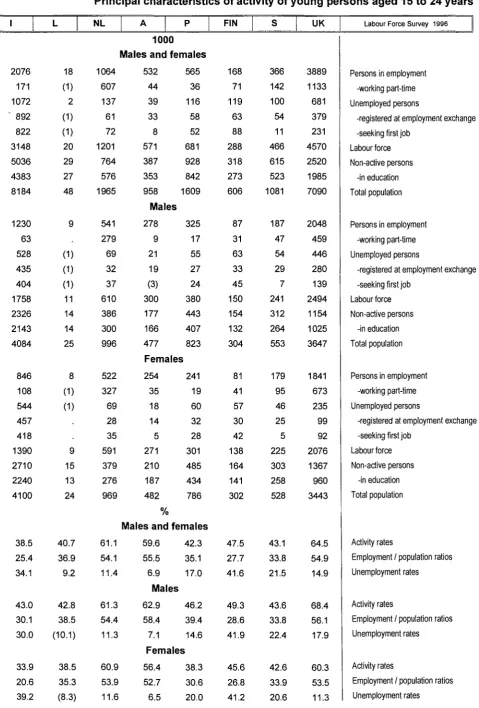
Table 002
Principal characteristics of activity of young persons aged 15 to 24 years
'm
eurostat
Labour Force Survey 1996 EUR 15 Β DK D EL E F IRL
Persons in employment -working part-time Unemployed persons
-registered at employment exchange -seeking first job
Labour force Non-active persons
-in education Total population
Persons in employment -working part-time Unemployed persons
-registered at employment exchange -seeking first job
Labour force Non-active persons
-in education Total population
Persons in employment -working part-time Unemployed persons
-registered at employment exchange -seeking first job
Labour force Non-active persons
-in education Total population
Activity rates
Employment / population ratios Unemployment rates
Activity rates
Employment / population ratios Unemployment rates
Activity rates
Employment / population ratios Unemployment rates
1000
Males and females
17370
3480
4847
3569
2324
22217
25808
22923
48025
9476
1361
2497
1866
1117
11974
12134
11227
24107
7894
2119
2350
1703
1207
10244
13674
11696
23918
334
52
86
80
48
420
862
823
1282
192
17
40
38
22
232
420
408
652
142
35
46
42
26
188
442
415
631
449
197
53
17
6
502
178
130
680
243
93
24
9
267
82
60
349
205
105
29
8
(4) 23597
70
331
3931
312
419
363
100
4351
4286
3850
8636
Males
2081 106 244 214 55 2326 2012 1900 4338
Females
1850 206
175
150
45
2025
2274
1950
4299
%
350
32
159
9
126
509
869
759
1377
204
16
56
(3)
43
260
389
365
650
146
16
103
6
83
248
479
394
728
1531
198
1102
919
501
2633
3904
3619
6538
917
76
529
441
217
1446
1863
1742
3309
614
122
573
478
284
1187
2042
1877
3229
Males and females
1873
454
712
604
236
2585
4754
4450
7339
1011
135
338
284
106
1349
2231
2137
3581
861
319
374
320
130
1236
2523
2313
3759
224
30
50
35
22
274
357
330
631
122
13
29
22
13
150
171
162
322
103
17
21
14
9
124
185
168
309
46.3 36.2 21.8
49.7 39.3 20.9
42.8 33.0 22.9
32.8 26.1 20.5
35.6 29.4 17.3
29.9 22.6 24.4
73.8 66.0 10.6
76.6 69.7 9.0
70.8 62.0 12.4
50.4 36.9 45.5 25.4 9.6 31.2
Males
53.6 40.1 48.0 31.5 10.5 21.5
Females
47.1 34.1 43.0 20.0 8.6 41.3
40.3 23.4 41.9
43.7 27.7 36.6
36.8 19.0 48.3
35.2 25.5 27.6
37.7 28.2 25.1
32.9 22.9 30.3
43.5 35.6 18.1
46.7 37.8 19.1
40.1 33.3 17.0
[image:24.595.68.541.90.785.2]= * eurostal
I
2076 171 1072 ' 892
822 3148 5036 4383 8184
1230 63 528 435 404 1758 2326 2143 4084
846 108 544 457 418 1390 2710 2240 4100
L
18
(D
2
(D
(D
20 29 27 48
9
d)
(D
(D
11 14 14 25
8
(D
(D
9 15 13 24
Table 002
Principal characteristics of activity of young persons aged 15 to 24 years
NL
1064 607 137 61 72 1201 764 576 1965
541 279 69 32 37 610 386 300 996
522 327 69 28 35 591 379 276 969
A Ρ
1000
viales and females
532 44 39 33
8
571 387 353 958
565 36 116 58 52 681 928 842 1609
Males
278 9 21 19 (3) 300 177 166 477
325 17 55 27 24 380 443 407 823
Females
254 35 18 14 5 271 210 187 482
241 19 60 32 28 301 485 434 786
FIN
168 71 119 63 88 288 318 273 606
87 31 63 33 45 150 154 132 304
81 41 57 30 42 138 164 141 302
S
366 142 100 54 11 466 615 523 1081
187 47 54 29 7 241 312 264 553
179 95 46 25 5 225 303 258 528
UK
3889 1133 681 379 231 4570 2520 1985 7090
2048 459 446 280 139 2494 1154 1025 3647
1841 673 235 99 92 2076 1367 960 3443
Labour Force Survey 1996
Persons in employment -working part-time Unemployed persons
-registered at employment exchange -seeking first job
Labour force Non-active persons
-in education Total population
Persons in employment -working part-time Unemployed persons
-registered at employment exchange -seeking first job
Labour force Non-active persons
-in education Total population
Persons in employment -working part-time Unemployed persons
-registered at employment exchange -seeking first job
Labour force Non-active persons
-in education Total population
%
Males and females
38.5 25.4 34.1
43.0 30.1 30.0
33.9 20.6 39.2
40.7 36.9 9.2
42.8 38.5 (10.1)
38.5 35.3
(8.3)
61.1 54.1 11.4
61.3 54.4 11.3
60.9 53.9 11.6
59.6 42.3
55.5 35.1 6.9 17.0
Males
62.9 46.2 58.4 39.4 7.1 14.6
Females
56.4 38.3 52.7 30.6 6.5 20.0
47.5 27.7 41.6
49.3 28.6 41.9
45.6 26.8 41.2
43.1 33.8 21.5
43.6 33.8 22.4
42.6 33.9 20.6
64.5 54.9 14.9
68.4 56.1 17.9
60.3 53.5 11.3
Activity rates
Employment / population ratios Unemployment rates
Activity rates
Employment / population ratios Unemployment rates
Activity rates
[image:25.595.68.548.77.786.2]Table 003
Activity rates by age groups
m
eurostat
Labour Force Survey 1996 EUR 15 Β DK D EL E F IRL
15-19 years 20-24 years 25 - 29 years 30-34 years 35 - 39 years 40-44 years 45-49 years 50-54 years 55-59 years 60-64 years 65 - 69 years 70 &+ years Total
15-24 years 25-49 years 50 &+ years 25 &+ years
15-19 years 20-24 years 25 - 29 years 30 - 34 years 35-39 years 40-44 years 45-49 years 50-54 years 55-59 years 60-64 years 65 - 69 years 70 &+ years Total
15-24 years 25-49 years 50 &+ years 25 &+ years
15-19 years 20 - 24 years 25-29 years 30-34 years 35-39 years 40-44 years 45-49 years 50-54 years 55-59 years 60 - 64 years 65-69 years 70 &+ years Total
15-24 years 25-49 years 50 &+ years 25 &+ years
Males and females
26.5
65.0
81.0
83.4
83.7
83.5
80.3
72.4
54.4
23.0
6.6
2.0
55.3
46.3
82.4
28.3
57.0
29.0 69.8 88.8 94.7 95.5 95.0 93.2 87.0 68.6 32.1 9.5 3.4 66.0 49.7 93.4 38.9 69.3
23.8 60.3 73.1 71.8 71.8 72.1 67.6 57.8 40.8 14.7 4.3 1.1 45.3 42.8 71.3 19.6 45.8
6.9 56.8 88.3 86.9 85.4 81.8 75.2 61.0 34.5 11.3 2.6 1.0 50.4 32.8 83.7 18.6 53.6
8.6 60.8 93.2 94.7 95.8 94.1 91.6 81.4 49.4 17.9 3.5 1.8 60.9 35.6 93.9 28.7 65.8
5.3 52.7 83.2 78.9 74.7 69.2 58.3 40.4 20.1 5.1 1.8 (0.5) 40.6 29.9 73.1 10.5 42.4
66.4 80.6 84.8 89.5 90.8 90.3 89.3 80.2 66.9 32.1 10.1
652 73.8 88.9 34.5 63.6
68.1 84.5 90.1 96.6 95.2 93.2 93.8 87.7 79.0 43.8 13.2
71.9 76.6 93.8 42.2 70.9
64.5 76.4 79.0 82.2 86.4 87.6 84.3 73.2 55.6 20.2 6.9
58.7 70.8 83.9 27.8 56.6
30.1 70.6 79.9 84.6 85.6 86.5 84.6 79.1 61.9 19.5 4.8 1.6 57.6 50.4 84.2 31.7 58.7
Males
33.6 74.4 85.7 94.8 96.0 95.8 94.3 90.7 73.7 28.4 6.7 2.9 68.2 53.6 93.3 42.8 70.4
16.0 60.6 78.5 79.4 79.7 77.2 71.3 63.9 51.6 32.8 14.0 3.7 49.7 36.9 77.3 28.7 52.1
16.1 69.0 93.5 96.7 97.6 96.8 94.5 89.2 74.9 47.6 21.0 5.7 64.2 40.1 95.8 42.5 68.7
Females
26.4 66.9 73.7 73.8 74.8 77.2 74.8 67.1 50.1 10.9 3.3 1.0 47.8 47.1 74.8 22.8 47.9
15.8 53.6 64.5 63.6 63.2 58.1 49.0 39.5 29.8 19.7 7.9 2.2 36.6 34.1 59.8 16.6 37.0
19.5 60.2 81.5 79.5 78.3 74.6 69.0 61.6 48.2 27.7 4.0 0.8 48.8 40.3 76.8 24.1 50.9
21.9 64.8 89.0 95.0 95.7 94.8 93.4 88.8 72.5 41.7 5.0 1.4 62.3 43.7 93.5 37.7 67.3
17.1
55.5 73.6 64.5 61.7 55.0 45.5 35.2 26.0 15.2 3.0 0.5 36.2 36.8 60.4 12.8 36.1
11.0 58.6 87.0 88.0 87.8 88.4 86.3 80.2 52.8 11.5 3.3 0.7 55.8 35.2 87.5 25.0 59.7
14.1 62.0 94.3 96.9 97.0 96.5 95.0 90.9 61.5
11.4
4.3 1.4 63.7 37.7 95.9 31.5 68.8
7.9 55.6 79.7 79.4 78.9 80.4 77.7 69.4 44.5 11.7 2.4 0.3 48.6 32.9 79.2 19.8 51.5
20.4 70.7 84.9 79.9 76.1 72.7 67.9 61.8 51.4 34.4 14.8 6.2 54.9 43.5 76.6 32.2 58.3
23.5 74.3 92.1 94.8 93.9 93.0 90.2 85.0 73.2 52.8 24.6 11.9 68.5 46.7 92.8 49.3 75.5
eurostat
Table 003
Activity rates by age groups
1
19.9 55.0 71.2
111 111
76.9 70.4 56.7 38.6 18.0 6.1 2.2 47.7 38.5 74.7 21.8 49.6
22.6 61.6 81.9 93.6 95.7 95.7 92.9 77.8 57.6 29.3 10.0 3.7 61.9 43.0 91.6 34.3 66.0
17.2 48.4 60.4 61.4 60.0 57.7 48.3 36.2 20.8 8.C 3.C 1.3 34.6 33.S 57.E 11.6 34.7
L
14.5 62.7 80.3 79.2 77.0 77.2 71.8 60.0 33.6 10.7
51.0 40.7 77.3 19.8 52.7
15.4 65.7 91.2 97.1 96.3 96.2 94.8 83.8 52.7 16.7
65.4 42.8 95.2 31.3 69.4
13.6 59.7 69.0 60.6 57.1 57.3 48.1 35.6 14.9 (5.1)
.
37.0 38.5 58.8 9.9 36.8
NL
45.9 74.3 86.2 83.4 82.5 80.8 77.7 67.8 45.9 14.7 5.6 1.8 59.7 61.1 82.2 26.5 59.4
47.3 73.6 92.5 95.1 95.2 94.1 92.3 84.9 61.0 20.2 9.7 3.9 70.4 61.3 93.9 37.9 72.2
44.5 75.0 79.5 71.2 69.2 67.3 62.8 49.5 30.5 9.4 1.9 (0.5) 49.3 60.9 70.1 16.6 47.2
A Ρ
%
Viales and females
42.8 73.8 84.7 86.3 86.3 85.1 83.0 73.1 44.7 13.3 6.1 2.2 58.8 59.6 85.2 26.0 58.7
22.1 62.3 85.9 87.1 87.9 86.6 81.6 70.8 57.1 39.8 24.2 10.7 57.7 42.3 85.8 37.5 61.4
Males
49.5 74.6 88.6 95.1 96.3 95.3 94.9 87.1 64.6 18.5 8.2 3.6 69.8 62.9 93.9 38.0 71.1
24.6 68.0 90.2 94.4 96.2 96.4 94.0 88.4 72.0 51.6 34.4 16.2 67.1 46.2 94.3 50.1 72.7
Females
36.0 73.1 80.8 77.2 75.9 74.8 70.8 59.5 25.5 8.6 4.4 1.4 48.8 56.4 76.2 16.9 47.6
19.5 56.4 81.6 80.2 81.0 77.5 70.3 55.7 43.8 29.3 16.0 6.9 49.3 38.3 78.0 27.3 51.8
FIN
31.6 64.2 82.1 84.7 88.4 88.8 85.2 81.8 57.3 20.9 6.2 (0.7) 59.4 47.5 85.9 31.2 61.4
31.3 67.2 88.8 89.6 89.9 89.4 84.7 82.1 58.1 23.3 9.4
64.5 49.3 88.4 36.8 67.3
31.9 60.9 75.2 80.0 86.6 88.2 85.7 81.6 56.4 18.9 3.9
54.6 45.6 83.4 26.9 56.1
S
19.1 64.3 82.5 88.7 89.7 91.2 91.0 89.4 81.5 56.8 8.9 2.4 61.3 43.1 88.6 40.2 64.5
17.7 66.5 84.9 91.8 91.7 92.7 91.8 91.5 84.1 59.4 14.0 3.7 65.4 43.6 90.6 45.9 69.5
20.5 62.0 80.0 85.4 87.6 89.5 90.2 87.3 78.9 54.3 4.3 1.5 57.4 42.6 86.5 35.3 59.8
UK
49.3 78.3 83.0 82.8 83.8 85.6 85.3 78.6 64.7 37.0 10.4 2.6 61.6 64.5 84.0 33.8 61.1
50.7 84.7 92.5 93.9 93.7 92.4 91.2 86.6 75.4 49.4 13.6 4.5 70.9 68.4 92.8 43.1 71.3
47.8 71.7 73.2 71.4 73.8 78.8 79.3 70.8 54.2 25.1 7.6 1.4 52.8 60.3 75.1 26.0 51.5
Labour Force Survey 1996
15-19 years 20-24 years 25-29 years 30-34 years 35-39 years 40-44 years 45-49 years 50-54 years 55-59 years 60-64 years 65-69 years 70 &+ years Total
15-24 years 25-49 years 50 &+ years 25 &+ years
15-19 years 20-24 years 25-29 years 30-34 years 35-39 years 40-44 years 45-49 years 50-54 years 55-59 years 60-64 years 65-69 years 70 & + years Total
15-24 years 25-49 years 50 & + years 25 &+ years
15-19 years 20-24 years 25-29 years 30-34 years 35-39 years 40-44 years 45-49 years 50-54 years 55-59 years 60-64 years 65-69 years 70 &+ years Total
Table 004
Activity rates by marital status and broad age groups
m
eurostat
Labour Force Survey 1996 EUR 15 Β DK D EL E F IRL
Single persons 15-24 years 25-49 years 50-64 years 65 &+ years Married
15-24 years 25-49 years 50-64 years 65 &+ years Widowed or divorced
15-24 years 25-49 years 50-64 years 65 &+ years Total
15-24 years 25-49 years 50-64 years 65 &+ years
Single persons 15-24 years 25-49 years 50-64 years 65 &+ years Married
15-24 years 25-49 years 50-64 years 65 &+ years Widowed or divorced
15-24 years 25-49 years 50-64 years 65 &+ years Total
15-24 years 25-49 years 50-64 years 65 & + years
Single persons 15-24 years 25-49 years 50-64 years 65 & + years Married
15-24 years 25-49 years 50-64 years 65 &+ years Widowed or divorced
15-24 years 25-49 years 50-64 years 65 &+ years Total
15-24 years 25-49 years 50-64 years 65 &+ years
%
Males and females
\m
eurostatTable 004
Activity rates by marital status and broad age groups
NL FIN UK Labour Force Survey 1996
%
Males and females
51.4 37.9 77.9 39.3 . 4.9 50.5 49.6 73.2 39.0 4.3 19.6 49.4 78.1 27.8 1.9 47.7 38.5 74.7 37.9 3.5 58.5 42.3 82.4 48.3 8.7 65.7 80.8 96.2 56.6 6.2 36.8 (58.5) 93.4 48.5 3.5 61.9 43.0 91.6 55.5 6.0 57.6 36.3 88.5 48.0 52.7 78.0 73.0 35.5
31.2
81.8
31.6
51.0
40.7
77.3
35.8
(1.6)
61.7
39.0 90.0 (49.9) 69.3 97.1 97.6 53.8 50.2 93.2 (47.9) 65.4 42.8 95.2 52.9 (2.5) 72.3 61.0 90.1 48.5 58.7 64.6 79.4 46.3 4.2 31.8 75.0 38.9 1.5 59.7 61.1 82.2 45.3 3.174.8
60.7
91.5
52.8
70.3 83.7 95.7 60.8 6.6 49.9 88.2 50.0 4.6 70.4 61.3 93.9 59.06.1
68.7 58.0 87.6 52.2 (4.2) 60.7 80.1 83.9 47.6 4.5 32.0 (63.8) 87.4 39.22.0
58.8
59.6
85.2
46.5
3.4
50.1 39.0 82.0 54.4 14.9 65.3 80.9 86.4 57.2 19.6 32.5 (80.9) 89.3 51.2 7.8 57.7 42.3 85.8 56.5 15.4Males
73.7 61.9 88.0 59.1 69.6 91.1 97.2 61.4 5.5 53.9 91.3 55.5 (3-6) 69.8 62.9 93.9 60.6 5.3 55.3 43.8 83.6 58.4 24.5 74.3 94.9 97.4 71.9 24.7 42.3 93.5 66.9 13.1 67.1 46.2 94.3 71.3 22.9 62.3 46.7 85.2 52.0 (4.0) 63.4 55.8 86.7 57.1 2.9 39.9 851} 56.5 1.7 59.4 47.5 85.9 56.4 2.5 66.3 47.7 86.2 53.7 64.2 80.0 90.3 58.6 3.9 56.888~4
60.1
(5.4)
64.5
49.3
88.4
58.2
4.4
Females
63.7 42.8 86.7 72.4 (2.1) 66.9 61.4 90.4 80.2 5.4 40.2 874 73.6 2.6 61.3 43.1 88.6 78.1 4.0 65.6 43.2 87.4 68.8 (4.3) 68.1 93.3 94.0 83.1 8.2 52.7 89Æ 78.9 3.0 65.4 43.6 90.6 80.6 6.6 69.0 63.9 84.8 52.0 4.0 64.8 74.8 85.4 64.0 6.3 38.7 49.1 75.7 53.7 3.3 61.6 64.5 84.0 61.5 4.9 74.2 67.4 89.5 55.8 7.4 72.0 92.4 95.1 74.5 8.1 54.7 (78.5) 87.5 64.2 5.9 70.9 68.4 92.8 71.9 7.6 43.2 33.2 71.0 30.1 3.0 35.7 41.7 52.9 20.6 1.8 15.0 45.1 70.5 21.8 1.5 34.6 33.9 57.8 21.5 1.8 52.2 33.2 86.0 (45.0) 35.7 69.1 49.7 15.7 24.0 74.5 24.5 37.0 38.5 58.8 19.0 69.3 61.3 88.0 42.2 47.0 58.0 64.4 30.5 1.2 24.1 66.8 32.0 (0.8) 49.3 60.9 70.1 31.3 0.9 62.7 53.8 87.1 44.1 51.7 76.9 71.5 32.4 3.1 25.1 85.0 32.3 1.7 48.8 56.4 76.2 33.1 2.3 44.5 33.7 80.0 52.5 11.8 56.5 74.8 76.7 41.8 13.1 30.0 87.7 47.9 6.4 49.3 38.3 78.0 43.4 9.9 57.6 45.6 83.6 49.2 62.6 45.1 83.4 55.5 (1.7) 33.38 Í 3 54.5 54.6 45.6 83.4 54.6 1.4 61.3 42.3 85.6 79.5
6 5 7 52.6 87.3 77.1 2.1 34.3
8 5 7 70.4 2.5 57.4 42.6 86.5 75.5 2.1 62.6 60.0 78.0 46.0 (1.6) 57.3 66.2 75.8 52.9 4.1 31.5 43.9 68.2 47.8 2.5 52.8 60.3 75.1 51.5 3.1 Single persons 15-24 years 25-49 years 50-64 years 65 & + years Married
15-24 years 25-49 years 50-64 years 65 &+ years Widowed or divorced
15-24 years 25-49 years 50-64 years 65 &+ years Total
15-24 years 25-49 years 50-64 years 65 & + years Single persons
15-24 years 25-49 years 50-64 years 65 &+ years Married
15-24 years 25-49 years 50-64 years 65 &+ years Widowed or divorced
15-24 years 25-49 years 50-64 years 65 &+ years Total
15-24 years 25-49 years 50-64 years 65 &+ years Single persons
15-24 years 25-49 years 50-64 years 65 &+ years Married
15-24 years 25-49 years 50-64 years 65 &+ years Widowed or divorced
15-24 years 25-49 years 50-64 years 65 &+ years Total