Determination of Safety Exclusion Zone for LNG
Bunkering at Fuel-Supplying Point
Byongug Jeong a,*, Byung Suk Lee a, Peilin Zhou a, Seung-man Hab
a Department of Naval Architecture, Ocean and Marine Engineering, University of Strathclyde, 100 Montrose Street, Glasgow, G4 0LZ, UK
bKorean Resister of Shipping, 36 Myeongji Ocean city 9-ro, Gangseo-gu, Busan, Republic of Korea
*corresponding author e-mail: [email protected], phone: +44(0)7425694809
ABSTRACT
With strong environmental and economic driving forces for using LNG as a marine fuel over the last decade, an increasing number of local/international ports, mainly in Europe, have initiated LNG fuel providing service to LNG-fuelled ships. This trend is now spreading throughout the world.
The LNG bunkering methods currently in use are truck-to-ship (TTS), ship-to-ship (STS) and pipeline-to-ship (PTS). This paper describes a study conducted to identify potential risks associated with LNG bunkering with particular emphasis on the fuel-supplying side. A series of parametric analyses were also carried out to identify the sensitivity to some parameters with the aid of a purpose-built computer program, Integrated Quantitative Risk Assessment (IQRA). Through the parametric analyses, general relationships between the risk and various parameters could be established from which the importance of the selected parameters might be evaluated.
This paper also proposes a new approach of establishing realistic safety exclusion zones in LNG bunkering process. Research findings demonstrate that the implied hypothesis that the current practice of the probabilistic risk assessment focused on the population-independent analysis only is somewhat inadequate when applied to determining the safety exclusion zones as showing that the extent of safety exclusion zones tends to be set up unpractically wide. Instead, the proposed approach designed with the combination of population-dependant and independent analyses is proven to be useful in determining the zones more realistically. It may form a basis on which more useful safety-related standards and regulations on LNG bunkering can be built.
List of symbols
AC Area concerned (m2)
AL Cross-sectional area of leak (m2)
CL Discharge coefficient used for liquid (= 0.61)
FREX Frequency of explosion
FRFF Frequency of flash fire
FRIL Frequency of initial leak
FRPF Frequency of pool fire
NFEX Number of fatalities by explosion (persons)
NFFF Number of fatalities by flash fire (persons)
NFPF Number of fatalities by pool fire (persons)
NFTT Number of fatalities in total (persons)
PA Atmospheric pressure (Pa)
PBW Overpressure of blast wave (Pa)
Ps Absolute pressure inside pipe (Pa)
PBPF Probit corresponding to probability of fatalities
POD Population distribution (persons)
PRCG Probability of congested space (occupancy ratio)
PRDI Probability of delayed ignition
PRF_PF Probability of fatalities by pool fire
PRF_EX Probability of fatalities by explosion
PRII Probability of immediate ignition
PRLI Probability of late isolated leak
PRNC Probability of no congested space (un-occupancy ratio)
PRSV Probability of successful ventilation
rC Radius of concerned area (m)
QLR Leak rate (kg/s)
qTR Thermal radiation (W/m2)
t Exposed time (= 60 seconds) ρLNG LNG density (kg/m3)
1.
Introduction
Along with the expectation that using LNG as a marine fuel will reduce the overreliance on conventional liquid and solid fossil fuels, thereby reducing the emission level of air pollutants, and diversify ship-owners’ choice of fuel types with possible economic benefits, the number of LNG fuelled ships has steadily increased in recent years. This trend has brought about the development of LNG bunkering infrastructure at ports throughout the world, although it is still at an early stage.
The most widely accepted LNG bunkering method is to use pipelines to transfer the fuel from an LNG depot to a receiving point on ships, known as pipeline-to-ship (PTS). This is very similar to the method used for loading LNG cargo. However, lack of terminal infrastructure has given rise to several alternative methods: especially, truck-to-ship (TTS) and ship-to-ship (STS) (ABS, 2014; ISO, 2015). So far a total of 48 ships have been bunkered by some of these alternative methods(DNV, 2012a; DNV, 2014).Compared to conventional oil bunkering, LNG bunkering requires much more care and attention to detail, because a release of LNG during the process is difficult to contain and may lead to uncontrolled fire or explosion. To minimise such risks, it is required to establish a safety exclusion zone around the LNG bunkering area both onboard the fuel-receiving ship and the fuel-supplying point within which no ignition source is allowed (ISO, 2015). Several site-specific risk assessment studies have been carried out to determine the extent of the safety exclusion zone on a case by case basis (DNV, 2012a; Norway, 2012; ADN, 2014) (Lee, S et al., 2015; DNV GL, 2014).
These studies have used population-independent analysis in general accordance with ISO/TS 18683 (ISO, 2015). This approach, however, does not deal with the evaluation of the societal risk. Since there will be a distribution of humans around fuel supply point (e.g., bunkering terminal ashore), such as port personnel and residents nearby, a population-dependent approach was used. Hence, it is important to point out that the potential loss of life due to LNG bunkering accident will depend much on the number of people present near the bunkering station and their distribution which will be different from port to port. In this context, this paper is to introduce an enhanced approach for establishing the safety exclusion zone more realistically, thereby examining the adequacy and inadequacy of the direct application of the current practices of the population-independent analysis. In this way, both population-independent and population-dependent approaches were integrated to determine the most appropriate safety exclusion zones for the conditions represented by the sets of parameters.
They were also carried out with fixed values of other specific parameters appropriate for the specific cases investigated so that it will be difficult to apply the results from these studies to different circumstances.
2.
Approaches Adopted
2.1 Identification of ParametersQRA results of LNG bunkering are sensitive to several parameters, and some of them may be more influential than others. To investigate the degree of the parametric sensitivity on the risk of LNG bunkering, in the present study four essential parameters have been selected, which were initially identified by a DNV GL report (DNV, 2014) as follows:
Transfer flow rate (bunkering method): when flow velocity is fixed, transfer flow rate relies on piping system size which is determined by the type of bunkering method. A higher transfer flow rate shortens the time required for bunkering and, consequently, the frequency of initial leak, but it does increase the probability of ignition.
Bunkering capacity: given transfer flow rate and operating pressure (system size) are constant, higher bunkering capacity requires longer bunkering duration, resulting in higher probability of occurrence of LNG leak from the bunkering system.
Port population: the port population is an essential parameter in societal risk because exposing a larger population to risk increases the potential loss of life.
Tolerable risk criterion: since there is no international consensus on the level of risk which is acceptable, the sensitivity of the extent of safety exclusion zones to this criterion needs to be investigated.
2.2 Methodology
A comprehensive risk assessment methodology for LNG bunkering and LNG fuel preparation has been developed and was coded into a computer program, named IQRA. It contains a built-in accident frequency calculator and a consequence estimator and was thoroughly checked against manual analysis results. This program was used to carry out a quantitative risk assessment and parametric analysis for LNG bunkering. A flowchart of the methodology is shown in Fig. 1.
Once the initial parameters are set up, the software follows a standard quantitative risk assessment process which consists of scenario analysis, frequency analysis, consequence analysis and risk assessment (Jin, 2015). Then, the results are collected and stored for comparison with the results obtained using different sets of parameters.
2.2.1 Bunkering case design
To begin with, the bunkering cases were designed by selecting a set of parameters. These parameters are bunkering method (and bunkering system), bunkering capacity and port population as shown in Fig. 2.
transferring capacity up to 10,000 gallons/hour (about 39 m3/h), and STS is capable of
supplying 40,000 gallons/hour (about 151 m3/h), while there is no specific limit for PTS
(DNV, 2014). Based on this, this study assumed the equipment size of 25 mm for TTS, 100 mm for STS and 250 mm for PTS while the size of pressure indicators was uniformly 12.5 mm.
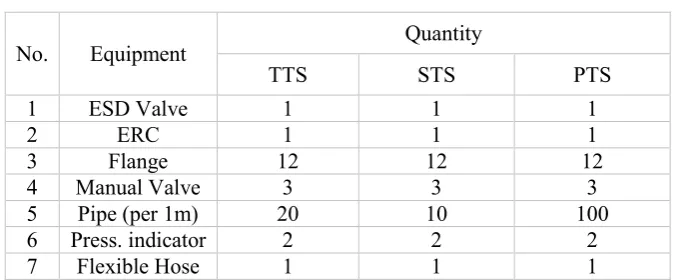
[image:5.595.157.495.235.375.2]Table 1 shows the list of LNG bunkering equipment, and the present study assumed that all methods use the same equipment with only the length of pipeline being different. On the other hand, the vapour return line is not included in this case study as the consequence of the vapour leak from the return line is relatively minor compared to that of the main line.
Table 1 List of LNG bunkering equipment.
No. Equipment Quantity
TTS STS PTS
1 ESD Valve 1 1 1
2 ERC 1 1 1
3 Flange 12 12 12
4 Manual Valve 3 3 3
5 Pipe (per 1m) 20 10 100
6 Press. indicator 2 2 2
7 Flexible Hose 1 1 1
Four different cases of annual LNG bunkering volumes were studied: 5,000 m3 (Case 1),
10,000 m3 (Case 2), 50,000 m3 (Case 3) and 100,000 m3 (Case 4). Three cases of the port
population were also studied, and the details are given later in this section.
2.2.2 Scenario analysis
Spilled LNG during bunkering will be subject to several physical processes, such as pool formation, spread, and boil-off. However, outcomes can vary, depending on ignition and the effectiveness of safety measures.
The scenario analysis is designed to identify all possible routes to the undesirable events based on an event tree analysis (ETA), and the programmed ETA is illustrated in Fig. 3. The escalating events were determined based on current standards (ISO, 2015) and common practices for LNG cargo transfer and bunkering.
Given the fact that LNG bunkering is usually carried out in an open space, regulations do not require gas detection devices to be installed, and therefore leakage detection is likely to be achieved by a watch-keeper. Consequently, a delayed isolation scenario will be caused by human error. Also, natural ventilation normally occurs in open spaces, and therefore the scenario of mechanical ventilation system being unsuccessful does not exist in this case. Regarding bunkering procedures and safety measures required, there is no fundamental difference in bunkering methods, and consequently, the proposed ET can be applied to all cases (TTS, STS, and PTS) (DNV GL, 2014).
liquid leak (leak from the LNG bunkering main line), jet fire scenario does not need to be considered.
2.2.3 Frequency analysis
Frequency analysis is a process of quantifying the probability of occurrence of unwanted events identified though the scenario analysis. Estimation of the frequency of initial leak from failure of bunkering equipment was based on DNV Leak Frequency Datasheets which are commonly used for investigating hydrocarbon release as they contain the leak frequency of 17 types of process equipment commonly encountered in offshore and chemical industries with respect to various leak hole sizes: 3mm, 10mm, 50mm, 150mm and full (over 150 mm) (DNV, 2012b).
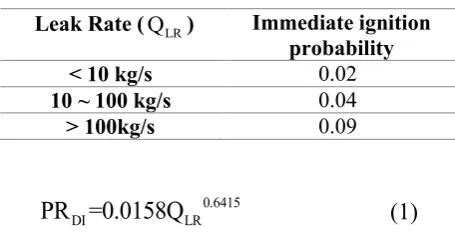
[image:6.595.212.440.369.495.2]For the probability of delayed leak isolation, the software adopts generic failure data associated with human errors from Kletz (Kletz, 1991). Several models of ignition probability have so far been developed by various parties, but the present study adopted the Dutch model (DNV, 2012a) for immediate ignition and the Cox model (Cox et al., 1990) for delayed ignition as they give relatively higher ignition probabilities than other models. The Dutch model is shown in Table 2, while the Cox model is given in Eq. (1).
Table 2 Probability of Immediate Ignition.
Leak Rate (QLR) Immediate ignition probability
< 10 kg/s 0.02
10 ~ 100 kg/s 0.04
> 100kg/s 0.09
0.6415
DI LR
PR =0.0158Q
(1)
Based on the event tree illustrated in Fig. 3, the frequency of each hazard in open spaces is calculated as follows:
FRPF = FRIL· PRII
FRFF = FRIL· PLI· PSV· PDI· PNC FREX = FRIL· PLI· PSV· PDI· PCG
2.2.4 Consequence analysis
The consequence analysis consists of several steps: estimating liquid release rate; modelling LNG pool spread and evaporation; and evaluating the impact of fires and explosion with respect to particular leak sizes. Since the risk of asphyxiation is negligible in open spaces and cryogenic harm is limited to the spread area, this study is focused on the risk associated with fire and explosion.
For the liquid leak model, the initial leak rate of LNG is calculated based on the classical work of Bernoulli’s equation taking into account leak hole size as well as system conditions. The leak rate from an effective cross-sectional area of the leak outlet is calculated as shown in Eq. (2) with the discharge coefficient, CL set to 0.61 (Crowl, 1990; DNV, 2012b; John,
LR L L LNG S A
Q =C A 2ρ
(P -P )
(2)
For liquid spread and evaporation, the program adopts the film boiling model of Klimenko (Klimenko, 1981) based on Newton’s law of cooling. The pool fire model is based on the flame model developed by Thomas (Thomas, 1965; Nedelka et al., 1979) where the average visible plume length is a function of the diameter of the fire. The radiation effect on personnel for a tilted flame by wind effect is estimated together with the view factors for vertical and horizontal receiving surfaces given by Hoftijzer (Hoftijzer, 1979) and Ramiro and Aisa (Ramiro, 1998).
To estimate flash fire ranges, the program adopts Gaussian gas dispersion models by predicting dispersion effect and the gas concentration (Perkins, 1974). For explosion model, the program works with the TNO multi-energy model (TNO 7) which is virtually an industry-standard for investigating the LNG explosion (John, 2010; Frank, 1980). It can be argued that these analytical/empirical models are not the state-of-the-art for the consequence analysis, but they are excellent for use in preliminary investigation and general observation of the potential risk of LNG systems.
2.2.5 Risk assessment
A risk level is obtained through combining frequency and consequence of accidents. The consequence of some accident scenarios resulting in fire or explosion is due to the significant amount of thermal radiation or overpressure which can adversely affect humans. The probability of fatality (Pf ) from fire/explosion is estimated by probit models described in Eqs (3)-(5) (Jafari, 2012; Zarei, 2013; Mohammadfam, 2015).
PF PF
F
PF
PB -5
PB -5
PR =0.5 1+
erf
PB -5
2
(3)For pool fire,
PB =-14.9+2.56×ln(q
PF TR4 3×t)
(4)For explosion,
PB =-77+6.91×ln(P )
PF BW (5)The consequence is usually expressed in terms of lives lost and injuries caused by accidents, which will obviously depend on the population at and near the site. The present study initially evaluated the risks for conditions independent of a number of people present. However, it became obvious that an accident will result in different societal risk levels regarding harm to human life for the different number of people present. Consequently, the port population and its distribution were taken into account in the later analysis to devise a method of estimating the probability of fatality. In this way, it was possible to explore the sensitivity of the risks regarding the port population. Finally, the results of both approaches were combined to determine the most appropriate safety exclusion zones for the conditions represented by the sets of parameters.
(a) Population-independent analysis
The present study regards the critical distance is where there is 50 % probability of fatality. This translates into a distance where thermal radiation reaches down to 16.0 kW/m2 and
overpressure is reduced to 0.4 bar (g). In addition, the LFL of methane (5 % by volume) is considered to be the criterion to determine the critical distance for the flash fire.
Each consequence can then be classed into all the discrete zones up to and including the zone where its critical distance falls. The frequencies of all the consequences belonging to each zone are then summed to produce the total frequency of accidents reaching that zone. The safe exclusion zone is then determined to be the nearest zone from the accident point with less than the tolerable risk criterion.
(b) Population-dependent analysis
The societal risk depends on the density of population at site. Since the present study is focused on general observation rather than site-specific analysis, three different cases of the port population (where P_Case 1 – access is severely restricted, P_Case 2 – access is moderately restricted, and P_Case 3 – access is not restricted) were used for the population-dependent analysis as shown in Fig. 4; the demographical data aggregated into seven zones was used, and the population was assumed evenly distributed in the discrete zones.
Using the probit model, Eqs (3) to (5), the probability of fatalities caused by pool fire and explosion are calculated. Then, the number of fatalities is evaluated by multiplying the probability of fatalities with population distribution for each incident outcome and then summing these for all outcomes as shown in Eqs (6) and (7) (Zarei, 2013; Mohammadfam, 2015).
C C
A r
PF D F_PF D F_PF
0 0
NF = PO ×PR
dA=2π PO ×PR
dr (6)A1 r1
EX D F_EX D F_EX
0 0
NF = PO ×PR
dA=2π PO ×PR
dr (7)Flash fires are directional due to wind (evenly distributed in, say, East, West, North, and South) and, therefore, a quarter of the population within the critical zone can be regarded as fatalities as shown in Eq. (8).
C C
A r
FF D D
0 0
1 1
NF = PO × dA=2π PO × dr
4 4
(8)The frequency of each accident is combined with its consequence (number of fatalities). Finally, the results are shown in F-N curves drawn as cumulative frequency against the number of fatalities.
3.
Case Study
bunkering time needed for various volumes of LNG transfer for the fluid velocity of 5 m/s is determined based on the bunkering rates of each method: 0.1132 h/m3 for TTS, 0.0071
h/m3 for STS and 0.0011 h/m3 for PTS. TTS with a small pipe has much higher annual
bunkering time required than the other methods. Where bunkering time is too high, especially for the TTS method, multiple bunkering connections may be needed.
3.1 Result of Frequency Analysis
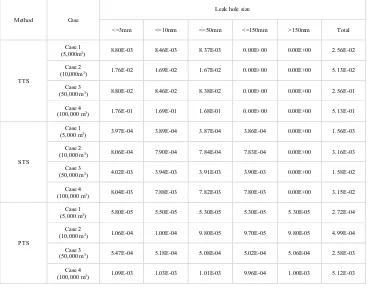
Based on the scenario analysis described in Section 2.2, the likelihood of the identified unwanted events was estimated for various leak hole sizes. Fig. 5 illustrates the calculated results of leak frequencies with respect to different leak hole sizes in the case of 5,000 m3
annual transferring volume for each bunkering method, and the results of all cases (Cases 1- 4) are tabulated in Table 3: this was calculated with the list of equipment involved in the LNG bunkering in Table 1 based on the DNV guidelines as mentioned in 2.2.3 Frequency analysis.
[image:9.595.143.512.419.707.2]Although the leak frequency is affected by the equipment used and system size, the analysis shows that the leak frequencies are directly proportional to the annual bunkering time required. As a result, TTS has very high leak frequencies, significantly higher than the other methods.
Table 3 Leak frequency of LNG bunkering systems with respect to capacity (unit:/year).
Method Case
Leak hole size
<=3mm <=10mm <=50mm <=150mm >150mm Total
TTS
Case 1
(5,000m3) 8.80E-03 8.46E-03 8.37E-03 0.00E+00 0.00E+00 2.56E-02
Case 2
(10,000m3) 1.76E-02 1.69E-02 1.67E-02 0.00E+00 0.00E+00 5.13E-02
Case 3
(50,000 m3) 8.80E-02 8.46E-02 8.38E-02 0.00E+00 0.00E+00 2.56E-01
Case 4
(100,000 m3) 1.76E-01 1.69E-01 1.68E-01 0.00E+00 0.00E+00 5.13E-01
STS
Case 1
(5,000 m3) 3.97E-04 3.89E-04 3.87E-04 3.86E-04 0.00E+00 1.56E-03
Case 2
(10,000 m3) 8.06E-04 7.90E-04 7.84E-04 7.83E-04 0.00E+00 3.16E-03
Case 3
(50,000 m3) 4.02E-03 3.94E-03 3.91E-03 3.90E-03 0.00E+00 1.58E-02
Case 4
(100,000 m3) 8.04E-03 7.88E-03 7.82E-03 7.80E-03 0.00E+00 3.15E-02
PTS
Case 1
(5,000 m3) 5.80E-05 5.50E-05 5.30E-05 5.30E-05 5.30E-05 2.72E-04
Case 2
(10,000 m3) 1.06E-04 1.00E-04 9.80E-05 9.70E-05 9.80E-05 4.99E-04
Case 3
(50,000 m3) 5.47E-04 5.18E-04 5.08E-04 5.02E-04 5.06E-04 2.58E-03
Case 4
(100,000 m3) 1.09E-03 1.03E-03 1.01E-03 9.96E-04 1.00E-03 5.12E-03
measure that can be provided (since gas detectors will be ineffectual in such circumstances) and the scenario of ‘limited fuel leak’ represents the situation in which the watch-keeper takes an appropriate action immediately to stop the leak. This means that it was assumed that 90 % of initial liquid fuel leak does not lead to an ‘accident’ as the leak can be contained to a ‘limited leak’ which was supposed to pose no danger.
The characteristics of the space around the leak site, i.e. if congested or open, is another important factor as it determines the type of final outcome (i.e. fire or explosion) of the accident. It is difficult to generalise the degree of congestion in the space, but it should be reasonable to consider that the condition is closer to ‘open’ than ‘congested’. Consequently a somewhat arbitrary, albeit on the high side, number of 20 % was assumed for the degree of congestion.
Fig. 6 shows an event tree analysis (ETA) for a 3 mm initial leak for TTS with the frequencies of the final outcomes when the annual transferring capacity is 5,000 m3.
3.2 Result of Consequence Analysis
[image:10.595.124.528.387.457.2]The leak rates estimated using Eq. (2) for various typical hole sizes are presented in Table 4.
Table 4 Leak rates for various leak hole sizes (unit: kg/s).
Case Leak hole size
3mm 10mm =<50mm =<150mm >150mm
TTS 0.0688 0.7647 4.7791 - -
STS 0.0688 0.7647 19.1166 76.4662 -
PTS 0.0688 0.7647 19.1166 172.049 477.913
Using the analytical and empirical models described in Section 2.2, the impact of each accident was evaluated. For flash fire, a natural weather condition with a wind speed of 5 m/s was assumed for general observation (DNV, 2012a). The results reveal that the impact of consequence has a direct correlation with the leak rate: that is, the critical distances of accidents associated with a large-scale LNG bunkering are much more extensive than those of a small one. This is illustrated in Fig. 7.
3.3 Result of Risk Assessment
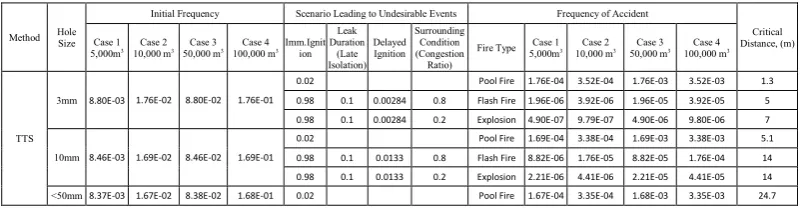
[image:10.595.126.527.674.779.2]The numerical results of frequency and consequence analyses for various parameters are brought together in Table 5.
Table 5 Numerical result of frequency and consequence analysis.
Method Hole Size
Initial Frequency Scenario Leading to Undesirable Events Frequency of Accident
Critical Distance, (m) Case 1
5,000m3
Case 2 10,000 m3
Case 3 50,000 m3
Case 4 100,000 m3
Imm.Ignit ion Leak Duration (Late Isolation) Delayed Ignition Surrounding Condition (Congestion Ratio)
Fire Type 5,000mCase 1 3
Case 2 10,000 m3
Case 3 50,000 m3
Case 4 100,000 m3
TTS
3mm 8.80E-03 1.76E-02 8.80E-02 1.76E-01
0.02 Pool Fire 1.76E-04 3.52E-04 1.76E-03 3.52E-03 1.3 0.98 0.1 0.00284 0.8 Flash Fire 1.96E-06 3.92E-06 1.96E-05 3.92E-05 5 0.98 0.1 0.00284 0.2 Explosion 4.90E-07 9.79E-07 4.90E-06 9.80E-06 7 10mm 8.46E-03 1.69E-02 8.46E-02 1.69E-01
0.98 0.1 0.0431 0.8 Flash Fire 2.83E-05 5.66E-05 2.83E-04 5.66E-04 36 0.98 0.1 0.0431 0.2 Explosion 7.07E-06 1.41E-05 7.08E-05 1.42E-04 25
STS
3mm 3.97E-04 8.06E-04 4.02E-03 8.02E-03
0.02 Pool Fire 7.94E-06 1.61E-05 8.03E-05 1.60E-04 1.3 0.98 0.1 0.00284 0.8 Flash Fire 8.84E-08 1.79E-07 8.94E-07 1.79E-06 5 0.98 0.1 0.00284 0.2 Explosion 2.21E-08 4.49E-08 2.24E-07 4.47E-07 7 10mm 3.89E-04 7.90E-04 3.94E-03 7.86E-03
0.02 Pool Fire 7.78E-06 1.58E-05 7.88E-05 1.57E-04 5.1 0.98 0.1 0.0133 0.8 Flash Fire 4.06E-07 8.24E-07 4.11E-06 8.20E-06 14 0.98 0.1 0.0133 0.2 Explosion 1.01E-07 2.06E-07 1.03E-06 2.05E-06 7 50mm 3.87E-04 7.84E-04 3.91E-03 7.81E-03
0.04 Pool Fire 1.55E-05 3.14E-05 1.56E-04 3.12E-04 48.3 0.96 0.1 0.105 0.8 Flash Fire 3.12E-06 6.32E-06 3.15E-05 6.30E-05 71 0.96 0.1 0.105 0.2 Explosion 7.80E-07 1.58E-06 7.88E-06 1.57E-05 39 <150mm 3.86E-04 7.83E-04 3.90E-03 7.79E-03
0.04 Pool Fire 1.54E-05 3.13E-05 1.56E-04 3.12E-04 88.9 0.96 0.1 0.255 0.8 Flash Fire 7.56E-06 1.53E-05 7.64E-05 1.53E-04 134 0.96 0.1 0.255 0.2 Explosion 1.89E-06 3.83E-06 1.91E-05 3.82E-05 59
PTS
3mm 5.80E-05 1.06E-04 5.47E-04 1.09E-03
0.02 Pool Fire 1.16E-06 2.12E-06 1.09E-05 2.17E-05 1.3 0.98 0.1 0.00284 0.8 Flash Fire 1.29E-08 2.36E-08 1.22E-07 2.42E-07 5 0.98 0.1 0.00284 0.2 Explosion 3.23E-09 5.90E-09 3.04E-08 6.04E-08 7 10mm 5.50E-05 1.00E-04 5.18E-04 1.03E-03
0.02 Pool Fire 1.10E-06 2.00E-06 1.04E-05 2.05E-05 5.1 0.98 0.1 0.0133 0.8 Flash Fire 5.73E-08 1.04E-07 5.40E-07 1.07E-06 14 0.98 0.1 0.0133 0.2 Explosion 1.43E-08 2.61E-08 1.35E-07 2.68E-07 14 50mm 5.30E-05 9.80E-05 5.08E-04 1.01E-03
0.04 Pool Fire 2.12E-06 3.92E-06 2.03E-05 4.03E-05 48.3 0.96 0.1 0.105 0.8 Flash Fire 4.27E-07 7.90E-07 4.10E-06 8.12E-06 71 0.96 0.1 0.105 0.2 Explosion 1.07E-07 1.98E-07 1.02E-06 2.03E-06 39 150mm 5.30E-05 9.70E-05 5.02E-04 9.96E-04
0.09 Pool Fire 4.77E-06 8.73E-06 4.52E-05 8.96E-05 127.0 0.91 0.1 0.429 0.8 Flash Fire 1.66E-06 3.03E-06 1.57E-05 3.11E-05 194 0.91 0.1 0.429 0.2 Explosion 4.14E-07 7.57E-07 3.92E-06 7.78E-06 75 >150mm 5.30E-05 9.80E-05 5.06E-04 1.00E-03
0.09 Pool Fire 4.77E-06 8.82E-06 4.55E-05 9.04E-05 195.7 0.91 0.1 0.827 0.8 Flash Fire 3.19E-06 5.90E-06 3.05E-05 6.04E-05 311 0.91 0.1 0.827 0.2 Explosion 7.98E-07 1.48E-06 7.62E-06 1.51E-05 100
3.3.1 Population-independent analysis
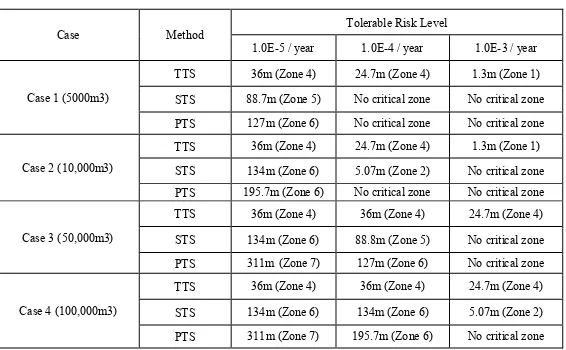
Based on the critical distance assessed by the consequence models discussed above, each accident is put into representative zones, and the frequency of the relevant distance to lie within the critical distance and the consequences belonging to each zone is summed up. For example, if an explosion has an impact up to 14m, the accident is included in Zones 1 and 2. The graphs in Fig. 8 show the frequency of the relevant distance to lie within the critical distance. By this means the frequency to lie within each safety zone can be evaluated as shown in Table 6.
[image:11.595.186.469.593.768.2]As different flag states and terminal authorities may have the different level of risk criteria associated with LNG bunkering, it is clear that there is no consensus on the risk level as yet. In this context, the present study adopted several tolerable risk levels (1.0E-3, 1.0E-4, and 1.0E-5/year) to investigate how this would affect the extent of safety exclusion zone (DNV GL, 2014). The results are summarised in Table 6.
Table 6 Zones with less than tolerable risks.
Case Method Tolerable Risk Level
1.0E-5 / year 1.0E-4 / year 1.0E-3 / year
Case 1 (5000m3)
TTS 36m (Zone 4) 24.7m (Zone 4) 1.3m (Zone 1) STS 88.7m (Zone 5) No critical zone No critical zone PTS 127m (Zone 6) No critical zone No critical zone
Case 2 (10,000m3)
TTS 36m (Zone 4) 24.7m (Zone 4) 1.3m (Zone 1) STS 134m (Zone 6) 5.07m (Zone 2) No critical zone PTS 195.7m (Zone 6) No critical zone No critical zone
Case 3 (50,000m3)
TTS 36m (Zone 4) 36m (Zone 4) 24.7m (Zone 4) STS 134m (Zone 6) 88.8m (Zone 5) No critical zone PTS 311m(Zone 7) 127m (Zone 6) No critical zone
Case 4 (100,000m3)
It appears that the PTS requires generally more extensive exclusion zones than other bunkering methods in nearly all cases. It is also clearly shown that the tolerable risk level influences the extent of safety exclusion zone to a great extent. As expected, the more stringent criterion is seen to extend the zones. For example, Zone 4 is the minimum for 1.0E-5 /year while all zones are tolerable when applying 1.0E-3 /year.
The transferring volume also influences the extent of the safety zone, primarily because higher volume requires longer time duration of bunkering operation, thereby increasing the probability of leakage occurring. As expected, higher volume requires the more extensive safety exclusion zone.
3.3.2 Population-dependent analysis
The probability of fatalities occurring can be presented in an F-N curve as shown in Fig. 9. It is a common practice to show the upper and lower limits of tolerable risk on the same graph (Norway, 2000; Vanem, 2008; Wang, 2001) so that it is possible to see whether the risk of the system being examined is tolerable or not. IMO MSC circular 72/16 gives the upper tolerable level as a straight line connecting 1.0E-2 /year for a single loss and with 1.0E-5 /year for 1,000 losses, while the lower tolerable level is defined as a straight line connecting 1.0E-4 /year for a single loss and 1.0E-7 /year for 1,000 losses. Results obtained from the population-dependent risk assessment for three different port population cases described in Fig. 4 are shown in Figs 9-11.
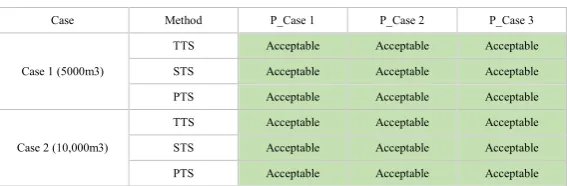
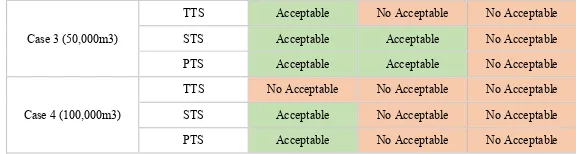
The results consistently show that higher bunkering volumes lead to higher overall risk levels. In the population condition 1 shown in Fig. 9, the risk level of TTS method dealing with 100,000 m3 exceeds tolerable limits while STS and PTS remain within the tolerable
level for all cases.
For the population condition 2 shown in Fig. 10, the risk tends to be higher than the first condition with the risk level of TTS method for 50,000 m3 exceeding tolerable limits; and
all methods exceed the tolerable level for 100,000 m3.
Population condition 3 shown in Fig. 11 is the worst case where all three methods exceed tolerable risk for both 50,000 and 100,000 m3.
This is as expected as can be clearly seen that exposing a larger population to an accident obviously increases the number of potential fatalities. The result confirms that the density of port population is an important parameter in determining the extent of safety exclusion zone.
[image:12.595.185.469.686.779.2]The overall result of population-dependent analysis is summarized in Table 7. All bunkering methods are acceptable in Cases 1 and 2 for all port population conditions, whereas no bunkering method is tolerable for Cases 3 and 4 for population condition 3. This would suggest that additional safety measures are needed to improve the safety of LNG bunkering for high volume in high-density population cases. The simplest way of achieving this appears to be restricting people’s access to the area.
Table 7 Summary of risk levels for various cases.
Case Method P_Case 1 P_Case 2 P_Case 3
Case 1 (5000m3)
TTS Acceptable Acceptable Acceptable STS Acceptable Acceptable Acceptable PTS Acceptable Acceptable Acceptable
Case 2 (10,000m3)
Case 3 (50,000m3)
TTS Acceptable No Acceptable No Acceptable STS Acceptable Acceptable No Acceptable PTS Acceptable Acceptable No Acceptable
Case 4 (100,000m3)
TTS No Acceptable No Acceptable No Acceptable STS Acceptable No Acceptable No Acceptable PTS Acceptable No Acceptable No Acceptable
3.3.3 Combination of the two approaches
The results from the population-independent and population-dependent analyses are considered in determining the exclusion zone. It was considered that any case with the risks from the population-dependent analysis lower than the upper tolerable limit has no critical zone. For the cases where critical zones do exist, the critical distance evaluated from population-independent analysis can be used as the safety exclusion zone within which the access of human is strictly limited so that within this zone, the population is minimized to the same level of P_Case 1.
[image:13.595.180.468.71.148.2]This idea is presented in Table 8 for different tolerable risk criteria while modified populations are shown in Table 9 for each case. The risk criterion of 1.0E-3 /year zone was not considered because it is far too lenient.
Table 8 Combination of population-dependent and independent analysis.
Case Method Risk criterion (1.0E-4/year) Risk criterion (1.0E-5/year)
P_Case 1 P_Case 2 P_Case 3 P_Case 1 P_Case 2 P_Case 3
Case 1 (5000m3)
TTS No critical zone No critical zone No critical zone No critical zone No critical zone No critical zone STS No critical zone No critical zone No critical zone No critical zone No critical zone No critical zone PTS No critical zone No critical zone No critical zone No critical zone No critical zone No critical zone
Case 2 (10,000m3)
TTS No critical zone No critical zone No critical zone No critical zone No critical zone No critical zone STS No critical zone No critical zone No critical zone No critical zone No critical zone No critical zone PTS No critical zone No critical zone No critical zone No critical zone No critical zone No critical zone
Case 3 (50,000m3)
TTS No critical zone 36m (Zone 4) (b) 36m (Zone 4) (f) No critical zone 36m (Zone 4) (b) 36m (Zone 4) (f) STS No critical zone No critical zone 88.8m (Zone 5) (g) No critical zone No critical zone 134m (Zone 6) (g) PTS No critical zone No critical zone 127m (Zone 6) (h) No critical zone No critical zone 311m(Zone 7) (h)
Case 4 (100,000m3)
[image:13.595.111.540.370.551.2]TTS 36m (Zone 4) (a) 36m (Zone 4) (c) 36m (Zone 4) (i) 36m (Zone 4) (a) 36m (Zone 4) (c) 36m (Zone 4) (i) STS No critical zone 134m (Zone 6) (d) 134m (Zone 6) (j) No critical zone 134m (Zone 6) (d) 134m (Zone 6) (j) PTS No critical zone 195.7m (Zone 6) (e) 195.7m (Zone 6) (k) No critical zone 311m (Zone 7) (e) 311m (Zone 7) (k)
Table 9 Modified population (unit: persons).
Case Risk criterion (1.0E-4/year) Risk criterion (1.0E-5/year)
Zone 1 Zone 2 Zone 3 Zone 4 Zone 5 Zone 6 Zone 7 Zone 1 Zone 2 Zone 3 Zone 4 Zone 5 Zone 6 Zone 7
(a) 1 3 5 10 30 40 50 1 3 5 10 30 40 50
(b) 1 3 5 10 60 80 100 1 3 5 10 60 80 100
(c) 1 3 5 10 60 80 100 1 3 5 10 60 80 100
(d) 1 3 5 10 30 40 100 1 3 5 10 30 40 100
(e) 1 3 5 10 30 40 100 1 3 5 10 30 40 50
(f) 1 3 5 10 100 150 300 1 3 5 10 100 150 300
(g) 1 3 5 10 30 150 300 1 3 5 10 30 40 300
(h) 1 3 5 10 30 40 300 1 3 5 10 30 40 50
(i) 1 3 5 10 100 150 300 1 3 5 10 100 150 300
(j) 1 3 5 10 30 40 300 1 3 5 10 30 40 300
From this study, it seems entirely reasonable to state that a safety exclusion zone is not necessary for the cases where the risk level is below the upper tolerable limit, provided all the safety procedures strictly adhere. It is also reasonably clear that the TTS is not appropriate for high volume transferring cases (Cases 3 and 4).
4
Discussion
At present, using LNG as a marine fuel is one of the top issues in the global shipping industry. Needless to say, the safety of people and ships in using and/or processing LNG is paramount. On the other hand, the existing regulations, class rules, guidelines, and standards appear to have some limitations and gaps. In particular, the guidelines for determining the extent of the safety exclusion zones are not able to specifically provide concrete procedures, thereby current practices of setting up the zones are unrealistic to some extent. Given that enhancing the guidelines is an urgent task, this paper can be represented as a record of the first research which investigated the pitfalls of current guidelines for safety exclusion zone systematically.
It is important to point out here is that this paper is the record of a general study, primarily to discover if the current practice of safety or risk assessment is adequate and can be relied upon to identify high risks. As such, the investigation concentrated on typical situations to improve our understanding of where the risk is in LNG fuelled ships and how to minimise it so that the information generated can be used as a basis for future improvement of rules and standards.
The history of LNG bunkering is too short for any meaningful statistics to be compiled. Consequently, this study relies upon generic data associated with LNG process equipment in offshore and chemical industries. It is inevitable, therefore, that the quantitative results obtained from this study may not be entirely trustworthy. Nevertheless, it is believed that some valuable insights into the risk of some aspects in LNG bunkering are acquired through it.
Although this paper is concentrated on the potential accidents associated with equipment failure, it is true that there are some risks from other causes as well, including collision, excessive ship motions, harsh weather conditions and human-induced accidents (caused by high-stress level, fatigue, and loss of concentration). Some of these factors may require careful examination in the future.
It is important to note that the present study was conducted to investigate the extent of safety exclusion zone required in general cases and the influence of some parameters on the exclusion zone. With this in mind, the study was conducted in a site-independent manner as much as was possible. However, it is true that the impact of fire and explosion will be affected by geometry or metrological conditions of the sites. For more site-specific assessment, therefore, it is recommended that the micro-scale meteorological/geometrical models of the LNG bunkering area be used for CFD (Computational Fluid Dynamics) or other numerical tools.
5
Concluding Remarks
This paper was proposed to conduct the quantitative risk assessment of LNG bunkering in relation to several parametric variables; bunkering method (transfer flow rate), bunkering capacities, port population and tolerable risk criteria. The population-independent analysis was performed to arrive at critical distances, while the societal risks of LNG bunkering were investigated through population-dependent analysis.
As shown through parametric analysis, the overall results of risk assessment for LNG bunkering are influenced by some degree by parameters used in the analysis.
It was found that the total annual time required for bunkering is one of the most critical factors in determining the probability of occurrence of leaks. This is the most critical reason why the TTS method is unsuitable for high volume LNG bunkering form the safety point of view. Associated with this main parameter are other parameters, including pipe size, bunkering method, flow rate, bunkering capacity and population distribution. It was also found that the human presence should be strictly limited within safety exclusion zone so that the population condition 1 is achieved.
Meanwhile, this paper does have an implied hypothesis that also addressed the shortcoming of current guidelines for population-independent analysis for establishing the safety exclusion zone for LNG bunkering. Instead, this study show the excellence of the combined approaches of population dependent/independent analyses.
The population-independent analysis as recommended by ISO standards, class rules and other common practice guidelines can result in safety exclusion zones too extensive for practical application. It was found that through population-dependent analysis produces much more realistic safety exclusion zones by controlling the number of personnel near the bunkering area. A method of combining the two approaches in establishing acceptable safety exclusion zones has been demonstrated through this study.
Therefore, it is believed that the enhanced approach developed in this paper provides structured guidelines to conduct quantitative risk assessment associated with establishing the safety exclusion zone. The proposed approaches for sensitivity/parametric analyses were proven to improve the reliability of risk analysis and is expected to complement the lack of a quantified guideline to investigate the safety of LNG fuelled vessels.
It is thought that there may be a case for making the relevant rules and regulations more explicit and providing clear procedural guidance to assess the extent of the safety exclusion zone for LNG bunkering. However, it may require more extensive studies and discussion to draw a consensus on the standard database and scenarios to be used.
Acknowledgement
The authors would like to express their gratitude to Dr. Junho Kwak (MAN Diesel & Turbo) for his invaluable support, comments, and suggestions. He has contributed considerably to this study.
ABS, 2014. Bunkering of Liquefied Natural Gas-fueled Marine Vessels in North America. ABS, Houston Texas USA.
ADN Administrative Committee, 2014. Proposed text of a derogation regarding the use of LNG, Geneva Swithland.
Cox, A., et al., 1990. Classification of Hazardous Locations, Rugby UK.
Crowl, D.A., J. F. Louvar, 1990. Chemical Process Safety: Fundamentals with Applications. Prentice Hall, New Jersey USA.
Dan, S. et al., 2014. Quantitative risk analysis of fire and explosion on the top-side LNG-liquefaction process of LNG-FPSO. Process Safety and Environmental Protection 92, 430-441.
DNV, 2012a. Port toolkit risk profile LNG bunkering - Port of Rotterdam, Ministry of Infrastructure & Environment - Port of Antwerp, Port of Amsterdam and Zeeland Seaport, Oslo Norway.
DNV, 2012b. failure frequency guidance: Process Equipment Leak Frequency Data for use in QRA, Oslo Norway.
DNV, 2014. LNG-fuelled fleet as of March 2014. DNV, Oslo Norway.
DNV GL, 2014. PP087423-4, Rev 3: Liquefied Natural Gas (LNG) Bunkering Study. DNV GL, Oslo Norway.
Frank, T., 1980. Industrial explosion prevention and protection. Mc Graw-Hill, New York USA.
Germany and Norway, 2012. HAZID report, London, IMO BLG
Hoftijzer, G.W., 1979. Heat radiation, in Methods for the Calculation of the Physical Effects of the Escape of Dangerous Material (Liquid and Gases). Directorate General of Labour, KH Vooburg, the Netherlands.
ISO, TS 18683, 2015. Guidelines for systems and installations for supply of LNG as fuel to ships. ISO, Geneva Switzerland.
Jafari MJ, et al., 2012. The quantitative risk assessment of a hydrogen generation unit. Hydrogen Energy 37 (24), 19241-19249.
Jeong, B., Lee, B. S., Zhou, P., & Ha, S. M. (2017). Evaluation of safety exclusion zone for LNG bunkering station on LNG-fuelled ships. Journal of Marine Engineering & Technology, 1-24.
Jin, Y., Jang, B., 2015. Probabilistic fire risk analysis and structural safety assessment of FPSO topside module. Ocean Engineering 104, 725-737.
John L. W., R.M. Pitblado., 2010. LNG RISK BASED SAFETY Modeling and Consequence Analysis. A John Wiley & Sons, INC, New Jersey USA.
Kletz, T., 1991. An engineer's view of human error. IChemE, Rugby UK.
Lee, S., et al., 2015. Fire risk comparison of fuel gas supply systems for LNG fuelled ships. Journal of Natural Gas Science and Engineering 27, 1788-1795.
Nedelka, D., et al., 1989. The Montoir 35 m Diameter LNG Pool Fire Experiments, Nice France.
Norway, 2000. Decision parameters including risk acceptance criteria. IMO MSC 72/16, IMO.
Mohammadfam, I., Zarei, E., 2015. Safety risk modeling and major accidents analysis of hydrogen and natural gas releases: A comprehensive risk analysis framework. International Journal of Hydrogen Energy 40 (39), 13653-13663.
Perkins, H.C., 1974. Air Pollution: Arizona. McGRAW-HILL BOOK COMPANY, Arizona, USA.
Ramiro, J.M.S., P. A. B. Aisa, 1998. Risk Analysis and Reduction in the Chemical Process Industry. Blackie Academic & Professional, London, UK.
Thomas, P., 1965. Fire Spread in wooden cribs: Part III The effect of wind, fire research Note Nr. 600, in Fire Research Station. Boreham Wods, England UK.
Vanem, E., et al., 2008. Analysing the risk of LNG carrier operations. Reliability Engineering & System Safety 93 (9), 1328-1344.
Wang, J., 2001. The current status and future aspects in formal ship safety assessment. Safety Science 38 (1), 19-30.