City, University of London Institutional Repository
Citation
:
Wang, Y., Wei, Y., Chang, J., Zhang, T., Liu, T., Sun, T. and Grattan, K. T. V.
(2017). Tunable diode laser absorption spectroscopy based detection of propane for
explosion early warning by using a vertical cavity surface enhanced laser source and
principle component analysis approach. IEEE Sensors Journal, 17(15), pp. 4975-4982. doi:
10.1109/JSEN.2017.2713769
This is the accepted version of the paper.
This version of the publication may differ from the final published
version.
Permanent repository link:
http://openaccess.city.ac.uk/18530/
Link to published version
:
http://dx.doi.org/10.1109/JSEN.2017.2713769
Copyright and reuse:
City Research Online aims to make research
outputs of City, University of London available to a wider audience.
Copyright and Moral Rights remain with the author(s) and/or copyright
holders. URLs from City Research Online may be freely distributed and
linked to.
Tunable Diode Laser Absorption
Spectroscopy-Based Detection of Propane for Explosion Early
Warning by Using a Vertical Cavity Surface
Enhanced Laser Source and Principle
Component Analysis Approach
Yin Wang, Yubin Wei, Jun Chang, Tingting Zhang, Tongyu Liu, Tong Sun, and Kenneth T. V. Grattan
Abstract— It is important in the petrochemical industry that there are high sensitivity, high accuracy, low-power consumption, and intrinsically safe methods for the detection of propane gas, to provide early warning of potential explosion hazards in oil–gas storage and transportation. Tunable diode laser absorption spec-troscopy (TDLAS) technology has the potential to provide an excellent basis both for early warning of explosion hazards and additionally to achieve precise, quantitative detection. In this paper, an approach to TDLAS detection of propane by using vertical cavity surface enhanced laser (VCSEL) technology, cou-pled with principle component analysis (PCA) is reported. In the evaluation carried out, the minimum detectable concentration could reach as low as 300 ppm and relative errors of the gas concentrations measured in this way were all below 5%. The experimental results obtained demonstrate that the use of VCSEL sources and PCA together solves difficulties often seen in the quantitative detection of propane by TDLAS at wavelengths close to 1684 nm. The approach also provides a strong experimental basis for the development of sensor systems based on TDLAS for propane and other combustible gas early warning of explosions, which makes it have real applicability in the petrochemical industry and oil–gas storage and transportation.
I. INTRODUCTION
P
ROPANE is an important constituent of both petroleum and liquefied petroleum gas, and it is also widely usedThis work was supported in part by theNatural Science Foundationof Shandong Province, China, under Grant ZR2016QZ006, in part by the Special ProjectofIndependentInnovation, AchievementsTransformationof Shandong Province, China, under Grant 2014ZZCX03405, in part by the RoyalAcademyofEngineering,andinpartbytheGeorgeDanielsEducational Trust.
Y. Wang, Y. Wei, T. Zhang, and T. Liu are with the Laser Institute of Shandong Academy of Sciences, Jinan 250103, China (e-mail: [email protected]; [email protected]; [email protected]; [email protected]).
J. Chang is with the School of Information Science and Engineering, Shandong University, Jinan 250100, China (e-mail: [email protected]).
T. Sun and K. T. V. Grattan are with the City Graduate School, City, University of London, London EC1V 0HB, U.K., and also with the School of Mathematics Computer Science and Engineering, City, University of London, London EC1V 0HB, U.K. (e-mail: [email protected]; [email protected]).
in the petrochemical industry as feedstock [1]–[4]. How-ever, propane is combustible and indeed explosive, where explosions can be easily caused when open flames or sparks are allowed to come near the propane source. Furthermore, propane evaporates easily at normal temperatures and pres-sures, compared with other hydrocarbon constituents of petro-leum and petrochemical materials, emphasizing the hazard that it provides. Additionally, propane is heavier than air and can accumulate at ground level and thus is hard to eliminate when a leak occurs. These characteristics of the propane gas mean that any leakage potentially can cause a major risk, especially in the petrochemical and oil-gas storage and transportation industries, emphasizing the importance of good
in-situ monitoring [5]. Currently, combustible gases such as
propane are usually monitored by using either electrochemical sensors, catalytic combustion-type sensors or semiconductor sensors [6]–[12] – however these sensors are not intrinsically safe if they are mains electricity-powered (due to potential spark hazards).
Infrared absorption spectroscopy has wide potential for the detection of combustible gases, including propane [13]–[16]. However, in field monitoring situations, the actual gas com-position is often complex and interfering species are regularly present. The bulk of traditional infrared sources typically have very wide (usually up to tens of nanometers) spectral ranges and this may be critical when interfering species are present in the measurement volume. Furthermore, the instability and short lifetime of the bulk of traditional infrared sources (such as lamps and thermal sources) makes it more difficult for sensors based on such sources to achieve long term, stable and accurate monitoring to avoid propane explosions where it matters ‘in-the-field’ and thus to give the early hazard warning needed.
in-the-field use [18]–[20]. In addition, combined with fiber optic components, TDLAS can provide an ideal solution for combustible gas sensing in the industries mentioned because of the simplicity of transmitting the infrared laser light for monitoring when in used in practical situations and obviating the need for mains power in the area being monitored – making such a sensor intrinsically safe. In this way, sensors based on TDLAS have significant potential for compact, in-situ propane monitoring which is well suited to industrial applications.
[image:3.612.317.559.60.250.2]Currently, there are few reports on the quantitative detec-tion of propane using this technique. Kluczynski et al. have reported the use of TDLAS to detect propane in the propylene production process at 3.37μm using a GaInAsSb/AlGaInAsSb DFB laser [21] taking advantage of the very strong absorption of the gas at this wavelength range. However, the optical fiber used (to suit such a wavelength range) is expensive and not readily available, limiting the applicability of the technique in this mid-infrared wavelength range and thus the practicability of such a system for in-situ propane monitoring. This is espe-cially so in practical applications where such sensor systems are to be used over the large physical areas where petroleum storage tanks are located, making the cost of the expensive 3.37μm-transmitting optical fiber needed to be prohibitive for practical applications. However, a scheme using near-infrared for the detection of propane would be much more practical, given the considerably lower cost of the optical fiber needed for that spectral region. Propane has an absorption feature in the wavelength region near 1684nm (Chan et al. [22] and Yoo et al. [23]) and therefore such a scheme could be practical given a suitable source. However, unlike methane, ethylene and acetylene, for example, there is no simple absorption peak in the wavelength region near 1684nm – the spectrum mainly consists of a spectral band with a peak superimposed upon it. Thus finding the spectral baseline with no obvious ‘standalone’ absorption peak is difficult because the band is also a part of the overall absorption spectrum. It is important to note that the scanning range of a traditional DFB laser typically is narrow, which usually only allows for the coverage of one absorption peak – for propane, the peak will be submerged in the overall spectrum when the concentration of propane is low and thus it will be more difficult to obtain quantitative data on propane concentration from the analysis that would then be carried out. The aim of this work was to exploit the favorable char-acteristics mentioned to develop a system operating at this important wavelength of 1684 nm (to suit low cost fiber optics) using TDLAS to obtain quantitative data on propane. To do so, in this work the traditional DFB laser was replaced by a vertical cavity surface emitting laser (VCSEL) operating with an output wavelength from 1682.7nm to 1685.7nm, then Principle Component Analysis (PCA) was used to analyze the spectral data obtained and thus determine the concentration of propane present in the sample. Due to its highly suitable spectral range and in light of practical industrial applications, a VCSEL can be used to eliminate the spectral interference brought about by other species when monitoring is being done, as much as possible when compared with using traditional sources, and additionally a broader spectrum containing more information can be obtained, when compared with using a
Fig. 1. Propane absorption spectrum over the spectral region from 1600nm to 1740nm.
DFB. Furthermore, a VCSEL has the advantages of relatively low cost and low power consumption. For use in-the-field, the low cost and low power consumption are particularly impor-tant. The use of the PCA approach allows the full spectral data to be used, and thus a higher accuracy in the obtained results– further, this approach potentially could be extended to the monitoring of other species which are important for this industry.
II. SPECTROSCOPICPRINCIPLE AND
EXPERIMENTALSET-UP
Figure 1 shows an absorption spectrum of a sample of ∼9% propane, obtained over the wavelength range from 1600nm to 1740nm, at a temperature of 25°C and at a total 1 atmosphere (atm) gas pressure, obtained by using a supercontinuum source and a high resolution spectrometer. A broad absorption feature can be observed in the region from 1680nm to 1740nm, with an absorption peak superimposed on the spectral band at a wavelength near 1684nm. These results show good agreement with the work of Chan et al. [22] and Yoo et al. [23].
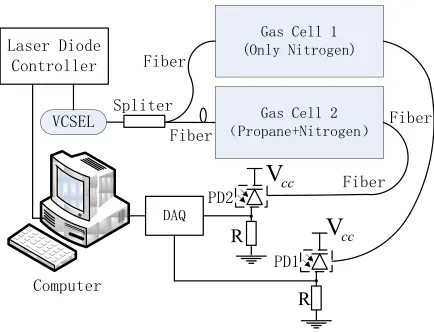
Supported by the results in Figure 1, the focus was then placed on the narrow wavelength range around 1684 nm and using a VCSEL whose output covered that spectral feature. Such a device was utilized as the tunable diode laser source in the experimental set-up created (shown in Figure 2) for the detection of propane and using the TDLAS approach.
Fig. 2. Schematic of the experimental setup using the VCSEL laser source.
large (up to more than 1km), which makes the approach suitable for propane monitoring over the large areas seen ‘in-the-field’. As the absorption spectrum of propane consists primarily of broadband features, two Gas Cells were included in the experimental set-up (as can be seen from Figure 2). Gas Cell 1 contains pure nitrogen gas only, while Gas Cell 2 is filled with nitrogen and propane gas. In the experimental set-up, the laser output beam was first split into two beams of equal intensity (I0), using a beam splitter. The first beam
was transmitted through a single-mode fiber, passed into Gas Cell 1, and at the photodetector, PD1, its residual intensity, I1 was measured. In addition a second beam was transmitted
through a further single-mode fiber, passed into Gas Cell 2 and at the second photodetector, PD2, its intensity, I2 was
monitored. It should be noted that in Gas Cell 1 there was no absorption over the wavelength range of interest by the nitrogen while, in contrast, the presence of propane in Gas Cell 2 caused a strong absorption. Due to multiple reflections in the Gas Cell itself, there is also an intensity loss (even in the absence of any absorbing gas features) and thus I1can be
given as:
I1=I0e−β1 (1)
where β1 represents the intensity loss due only to the light
passing through the Cell itself, which from the Lambert-Beer law means that I2 can be given as:
I2=I0e−PcSφL−β2 (2)
where P is the total pressure of the absorbing gas in Gas Cell; c is the concentration of the propane species; S is the spectral feature line strength; φ is the line shape function; L is the overall absorption path length (in this experiment it was 9 meters); and β2is the intensity loss caused only by the
passage of light through Gas Cell 2 itself. Two photocurrent signals were generated at PD1 and PD2 representing these signals and the measured intensity Ic1 of the photocurrent
generated by PD1 is given by:
Ic1=K1I1 (3)
where K1 is the photoelectric conversion coefficient of PD1.
The intensity Ic2 of the photocurrent generated by PD2 is
given by:
Ic2=K2I2 (4)
where K2 is the photoelectric conversion coefficient of PD2.
The two photocurrent signals generated were both acquired by using a data acquisition (DAQ) card and then sent to a computer (after preprocessing). The two Gas Cells used were both Herriot optical structures of 9m optical path length and were identical to each other [24], [25]. As a result, the intensity loss due to the passage of light only through the cells, β1 andβ2 can be considered identical for the two beams and
thus:
β1=β2 (5)
In this way, based on equations (1) - (5), the absorbance of the propane sample in the cell can be represented by a log(Ic1/Ic2)
function, and this can be given by:
log
Ic1
Ic2
=PcSφL+logK1 K2
(6)
where PcφSL is proportional to the propane concentration c and log(K1/K2) is a constant. By using two Gas Cells with
identical structures, any signal noise caused by the intensity ‘jitter’ due to the VCSEL and noise caused by any difference of intensity due to Gas Cell losses at different wavelengths can be compensated through the ratio, Ic1/Ic2, thus enhancing
the signal to noise ratio in the final measurement.
Fig. 3. Spectra due to the1100ppm and 2200ppm propane gas samples obtained by using the TDLAS approach.
III. ANALYSIS
A. Spectral Analysis
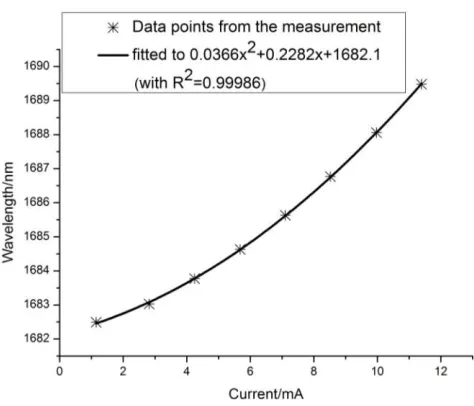
Compared with the use of a DFB laser, the wider wavelength scanning range of the VCSEL used is an important advantage. However, the relationship between the output wavelengths and the input currents is a quadratic function rather than a linear function. The quadratic function can readily be determined by fitting the output wavelength values and the input cur-rent values, and the correlation coefficient R2 is 0.99986. The tuning characteristic of the VCSEL used, at 25°C, is shown in Figure 4. Thus for a constant current change, the wavelength difference at longer wavelengths is slightly larger than at shorter wavelengths. In the analysis, more spectral sampling points are used at these longer wavelengths (Figure 3 shows the larger absorbance at longer wavelengths). Here, the wavelength interval of two spectral sampling points around 1682.7nm was considered as the reference, and over the region from 1682.7nm to 1685.7nm, when the wavelength interval of two points was greater than twice the reference, a wavelength value would be interpolated at the center of these two wavelengths. Following that, a cubic spline interpolation method was utilized to calculate the corresponding absorptions at these interpolated wavelengths.
A cubic function was used as the spline function, which is given below, as Equation (7):
S(x)=Mi(
xi+1−x)3
6hi +
Mi+1(
x−xi)3
6hj
+
yi−
Mih2i
6
xi+1−x
hi +
yi+1−
Mi+1h2i
6
x−xi
hi
(7)
where i is the index of the wavelength point, i=0,1,2, . . . ,n; xi and yi are the original wavelength and the absorptive
intensity at wavelength I respectively; Mi is the undetermined
[image:5.612.52.294.59.244.2]coefficient of the interval i; hi is the wavelength difference
Fig. 4. The tuning characteristic of the VCSEL used in the experiment, showing the wavelength change with current, when operated at 25°C.
value of point i and i+1, which is given as:
hi=xi+1−xi (8)
Further, the vector Mi can be given by:
⎛ ⎜ ⎜ ⎜ ⎝
M0
M1
... Mn
⎞ ⎟ ⎟ ⎟ ⎠
=
⎛ ⎜ ⎜ ⎜ ⎜ ⎜ ⎝
2 λ0 0 · · · 0
μ1 2 λ1 0 · · · 0
... ... ... · · · ·
0 · · · 0 μn−1 2 λn−1
0 · · · μn 2
⎞ ⎟ ⎟ ⎟ ⎟ ⎟ ⎠
−1⎛
⎜ ⎜ ⎜ ⎝
d0
d1
... dn
⎞ ⎟ ⎟ ⎟ ⎠
(9)
whereλi is given as:
λi=
hi
hi−1+hi
(10)
μi is given as:
μi=
hi−1
hi−1+hi
(11)
di is given as:
di=6
hi−1(yi+1−yi)−hi(yi−yi−1)
hi−1hi(hi−1+hi)
(12)
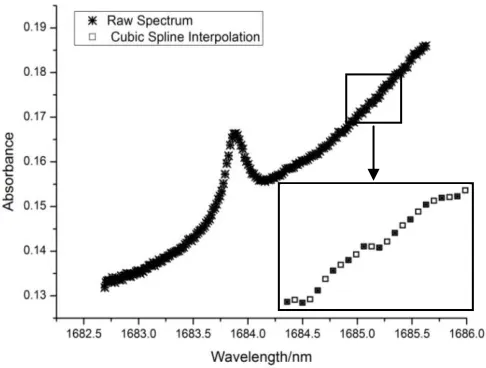
Fig. 5. Comparison between original spectrum and the spectrum after cubic spline interpolation processing is applied.
In the experiment carried out, new spectral points are interpolated in the spectral region from 1685.15nm, which can be seen from the bottom right-hand corner of Figure 5. At some wavelengths the points are the superpositions of asterisks and rectangles, while at some wavelengths the points are only shown by rectangles which means these points are interpolated by using the cubic spline interpolation method. Compared with the original spectral data, the new spectral data includes more absorption features, which then provides the basis for quantitative analysis of the propane spectrum by using the PCA method.
B. Quantitative Analysis of Propane
Due to the complexity of the molecular geometry and the substantial number of vibrational modes, there is no ‘standalone’ absorption peak for propane in the spectral region from 1682.7nm to 1685.7nm, as shown in Figures 1 and 3, (and this is different from the absorption features of gases such as methane, ethylene and acetylene, for example). There is a clear peak near 1684nm, but it is superimposed on a much broader absorption band. If the spectral information from only the peak wavelength is used for the analysis of the propane signals, then much spectral information at other wavelengths will be lost. When using only one intensity value, the consequent final calculated concentration may then fluctuate significantly due to noise, especially during in-situ detection where signals may be weak. The Multiple Linear Regression (MLR) method can use intensity values at more than one wavelength to calculate the concentrations of the propane species, but it is hard to avoid multi-collinearity of the spectral data which may bring larger errors during the calculation of the concentration of propane, using this MLR approach. Thus, in order to achieve high-accuracy measure-ments of low concentrations of propane, the PCA method was used as it can make good use of intensity values at different wavelengths, and reduce the spectral data dimensions, thus avoiding multi-collinearity issues.
Fig. 6. Results for the calculation of different concentrations of propane when the known concentration of propane was stepped (with 10 tests for each concentration) in 200ppm increments from a starting concentration of 300ppm (samples 1 - 10) to 2200 ppm (samples 91 - 100).
In the experiment carried out to validate this approach, the spectra obtained using the cubic spline interpolation process-ing approach were used for the PCA analysis. Here there are, in total, 203 points at different wavelengths for each sample absorption spectrum. The absorption spectra matrix, X, consists of absorption spectra of different concentrations and is given by:
X=
⎛ ⎜ ⎜ ⎜ ⎝
I11 I12 · · · I1m
[image:6.612.54.297.59.243.2]I21 I22 · · · I2m
... ... · · · ...
In1 In2 · · · Inm
⎞ ⎟ ⎟ ⎟
⎠ (13)
where m is the number of spectral points of each concentration (and here this is 203); n is the number of sample concentrations (and here this is 20); I11,I12, . . . ,I1m, are the intensities
recorded for a concentration of 300ppm propane at the first wavelength, at the second wavelength,. . ., and up to the 203th wavelength; similarly I21,I22, . . . ,I2m, are the intensities for
400ppm propane,. . ., and In1,In2, . . . ,Inm, are the intensities
for 2200ppm propane. The loading matrix P can be determined by calculating the eigenvalues and eigenvectors of the covari-ance matrix of X. In the experiment, there are in total 26 nonzero eigenvalues and the corresponding eigenvectors are chosen to constitute the loading matrix P. The score matrix, T, can be obtained from:
T=XP (14)
T can be seen as the projections of the absorption spectra data onto the loading matrix. There is little multicollinearity in the score matrix T, and as much spectral information as possible is utilized to calculate the concentrations of propane species. So, the MLR method can be used for quantitative analysis of the propane concentrations by taking the score matrix T as the source of the new spectral data. The relationship between the concentration vector, C, and the score matrix, T, is given as:
where C is given by:
C=
⎛ ⎜ ⎝
c1
... cn
⎞ ⎟
⎠ (16)
and where c1 is 300ppm, c2 is 400ppm,. . ., cn is 2200ppm;
B is the regression coefficients vector, which is given by:
B=
⎛ ⎜ ⎝
b1
... bn
⎞ ⎟
⎠ (17)
So, B can be given as:
B=
TTT
−1
TTC (18)
According to Equations (15) - (18), the concentration, cdetect,
of the gas sample to be detected can be given as:
cdetect =tdetectB=tdetect
TTT
−1
TTC (19)
where tdetect is the score vector of the absorption spectrum of
a gas sample to be investigated.
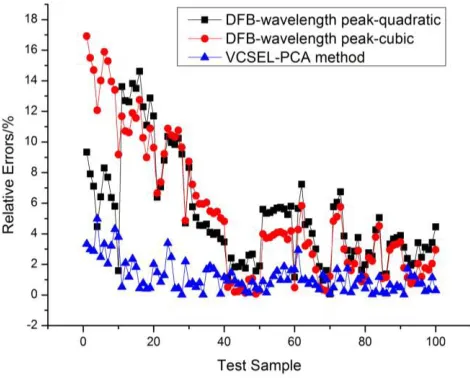
Usually in traditional TDLAS detection, a DFB laser source is used, where the spectral intensities arising from the different gas samples (representing different concentrations at a peak wavelength) were used and fitted for these gas concentrations samples using a polynomial curve (such as a quadratic or a cubic function). The concentrations of these gas samples being measured can be then obtained by reference to the fitted curve. In order to verify the greater accuracy achievable for propane detection obtained when using the VCSEL source coupled to the PCA method (and thus to compare it with the traditional TDLAS detection method), firstly the spectra of the 20 gas samples discussed above were obtained by the VCSEL source and the ‘score matrix’ and the ‘loading matrix’ were obtained by the PCA method. Secondly the spectra of the 20 gas samples were obtained by using the DFB laser source and a fitted quadratic curve and a cubic curve were obtained. Then Gas Cell 2 was successively filled with 100 test gas samples of known values from 300ppm, 500ppm, 700ppm, . . ., up to 2100ppm (in increments of 200 ppm) as mentioned above. The results obtained by traditional TDLAS detection and using the VCSEL source coupled to the PCA method for the determination of these gas concentrations are shown in Figure 6 and the relative errors in the concentration results obtained are shown in Figure 7.
[image:7.612.318.553.60.249.2]When making up the gas samples at 300ppm, a low flow rate meter was used and thus the flow error was kept small, but when making up gas samples of high concentrations such as 1900ppm and 2100ppm, the flow error was larger. Thus it can be seen from Figure 6 that the concentration results determined fluctuate slightly around the corresponding true values and the results obtained for high concentrations fluctuate more widely than those at low concentrations. However, from Figure 7 it can be seen that the relative errors when measuring high concentrations are smaller than those at the low concentrations, since the corresponding true concentration values are much higher than those at the low concentrations. The maximum
Fig. 7. Relative errors in the results obtained from the tests carried out and shown in Figure 6 (the known concentration of propane was stepped (with 10 tests for each concentration) in 200ppm increments from a starting concentration of 300ppm (samples 1 - 10) to 2200 ppm (samples 91 - 100)).
value of the errors obtained by using the VCSEL source, cou-pled to the PCA method, relative to the true value, is∼4.9%, while the minimum error relative to the true value is close to zero – an important conclusion is that all relative errors are below 5%, which is important as it meets the requirements from industry for the detection of propane [27], [28].
IV. CONCLUSIONS ANDDISCUSSION
Work done to date has been laboratory-based but designed with applications in-the-field in mind. For example, the DFB laser source was replaced by a VCSEL rather than a SC laser source in order to make the whole system portable, the applicable scanning range from 1682.7nm-1685.7nm was used in order to eliminate spectral interference brought about by interfering species likely present when in-the-field moni-toring is done and the moving average method was used to eliminate the spectral noise before the spectroscopic analysis was undertaken. Currently the authors are designing and manufacturing a small-size electrical system to replace the laser diode controller so that the techniques can easily be transferred from the laboratory to successful field applica-tions, to create equipment which meets industry’s need for portability. Indeed, in the petrochemical industry and for oil-gas storage and transportation, the main interfering species is butane and the spectral interference cannot totally be elim-inated. However, future work will focus on how to extract the propane spectrum and butane spectrum individually from the spectra of the mixed gases. Additionally, work will need to be done to reject interference signals, the effects of pres-sure and temperature fluctuations and vibration susceptibility arising from the conditions in the industrial environment in field use. Thus the work of this paper provides an excel-lent ‘proof of principle’ as an experimental basis for the design of better portable sensor systems based on TDLAS for propane and other relevant combustible gas explosion-hazard early warning in these and similar industries where such problems can occur. This represents an important start in transferring the TDLAS-based technology discussed from the laboratory to practical industrial applications to solve problems of major importance and which will enhance safety and security.
REFERENCES
[1] B. Liang et al., “LPG characterization and production quantification for oil and gas reservoirs,” J. Natural Gas Sci. Eng., vol. 2, pp. 244–252, Nov. 2010.
[2] M. J. Kotarba, J. B. Curtis, and M. D. Lewan, “Comparison of natural gases accumulated in Oligocene strata with hydrous pyrolysis gases from Menilite Shales of the Polish Outer Carpathians,” Org. Geochem., vol. 40, no. 7, pp. 769–783, 2009.
[3] D. Canziani, P. M. Ndiaye, E. Franceschi, M. L. Corazza, and J. V. Oliveira, “Phase behaviour of heavy petroleum fractions in pure propane and n-butane and with methanol as co-solvent,” J. Chem.
Thermodyn., vol. 41, no. 8, pp. 966–972, 2009.
[4] R. A. Meyers, Handbook of Petrochemicals Production Processes. New York, NY, USA: McGraw-Hill, 2005.
[5] J. Liang’an, B. Xuelian, and X. Yuming, “The countermeasure study on the harm from the oil-gas going into air,” Techn. Equip. Environ.
Pollution Control, vol. 2, no. 3, pp. 59–61, 2001.
[6] S. Xiao-Jian, “Research progress in combustible gas sensor,” Gas HEAT, vol. 30, no. 5, pp. 40–42, 2010.
[7] U. Guth and J. Zosel, “Electrochemical solid electrolyte gas sensors— Hydrocarbon and NOx analysis in exhaust gases,” Ionics, vol. 10,
pp. 366–377, Sep. 2004.
[8] F. Liu, Y. Zhang, Y. Yu, J. Xu, J. Sun, and G. Lu, “Enhanced sensing performance of catalytic combustion methane sensor by using Pd nanorod/γ-Al2O3,” Sens. Actuators B, Chem., vol. 160, no. 1,
pp. 1091–1097, 2011.
[9] A. Z. Sadek, S. Choopun, W. Wlodarski, S. J. Ippolito, and K. Kalantar-zadeh, “Characterization of ZnO nanobelt-based gas sensor for H2, NO2,
and hydrocarbon sensing,” IEEE Sensors J., vol. 7, no. 6, pp. 919–924, Jun. 2007.
[10] L. Satyanarayana, C. V. G. Reddy, S. V. Manorama, and V. J. Rao, “Liquid-petroleum-gas sensor based on a spinel semiconductor, ZnGa2O4,” Sens. Actuators B, Chem., vol. 46, no. 1, pp. 1–7, 1998.
[11] A. Helwig, G. Müller, G. Sberveglieri, and M. Eickhoff, “On the low-temperature response of semiconductor gas sensors,” J. Sens., vol. 2009, Jul. 2009, Art. no. 620720. [Online]. Available: http://dx.doi.org/10.1155/2009/620720/
[12] N. Yamazoe, “Toward innovations of gas sensor technology,” Sens.
Actuators B, Chem., vol. 108, no. 1, pp. 2–14, 2005.
[13] Z.-H. Du, R.-B. Qi, H.-M. Zhang, X. Yin, and K.-X. Xu, “Quantita-tive detection of propane and isobutene based on NIR spectroscopy,”
J. Tianjin Univ., vol. 41, no. 5, pp. 589–592, 2008.
[14] X. Liu, S. Cheng, H. Liu, S. Hu, D. Zhang, and H. Ning, “A survey on gas sensing technology,” Sensors, vol. 12, no. 7, pp. 9635–9665, 2012. [15] J. J. R. Rohwedder, C. Pasquini, P. R. Fortes, I. M. Raimundo, Jr., A. Wilk, and B. Mizaikoff, “iHWG-μNIR: A miniaturised near-infrared gas sensor based on substrate-integrated hollow waveguides coupled to a micro-NIR-spectrophotometer,” Analyst, vol. 139, no. 14, pp. 3572–3576, 2014.
[16] J. J. Harrison and P. F. Bernath, “Infrared absorption cross sections for propane (C3H8) in the 3μm region,” J. Quant. Spectrosc. Radiat. Transf., vol. 111, no. 9, pp. 1282–1288, 2010.
[17] E. D. Hinkley, “High-resolution infrared spectroscopy with a tunable diode laser,” Appl. Phys. Lett., vol. 16, no. 9, pp. 351–354, 1970. [18] G. Shanhu et al., “Methane detection research with tunable diode laser
absorption spectroscopy,” Chin. J. Quant. Electron., vol. 23, no. 3, pp. 388–392, 2006.
[19] J. Zhang and K. Song, “Tunable diode laser absorption spectroscopy system for trace ethylene detection,” Spectrosc. Spectral Anal., vol. 32, no. 10, pp. 2875–2878, 2012.
[20] A. Lucchesini, M. De Rosa, D. Pelliccia, A. Ciucci, C. Gabbanini, and S. Gozzini, “Diode laser spectroscopy of overtone bands of acetylene,”
Appl. Phys. B, Lasers Opt., vol. 63, no. 3, pp. 277–282, 1996.
[21] P. Kluczynski et al., “Detection of propane using tunable diode laser spectroscopy at 3.37μm,” Appl. Phys. B, Lasers Opt., vol. 108, no. 1, pp. 183–188, 2012.
[22] K. Chan, H. Ito, and H. Inaba, “All-optical remote monitoring of propane gas using a 5-km-long, low-loss optical fiber link and an InGaP light-emitting diode in the 1.68-μm region,” Appl. Phys. Lett., vol. 45, no. 3, pp. 220–222, 1984.
[23] J. Yoo, N. Traina, M. Halloran, and T. Lee, “Minute concentra-tion measurements of simple hydrocarbon species using supercontin-uum laser absorption spectroscopy,” Appl. Spectrosc., vol. 70, no. 6, pp. 1063–1071, 2016.
[24] J. Altmann, R. Baumgart, and C. Weitkamp, “Two-mirror multipass absorption cell,” Appl. Opt., vol. 20, no. 6, pp. 995–999, 1981. [25] J. B. McManus, M. S. Zahniser, and D. D. Nelson, “Dual quantum
cascade laser trace gas instrument with astigmatic Herriott cell at high pass number,” Appl. Opt., vol. 50, no. 4, pp. A74–A85, 2011. [26] F. Su, J. Wang, and A. Yang, “The layout, lectotype, installation
and maintenance of the combustible gas detector used in the offshore platform,” Shipbuilding China, vol. 48, pp. 43–47, Nov. 2017. [27] L. Qiu-Fang, Y. Chang-Ming, L. Xue-Min, and L. Zhi-Ming, “Study on
combustible gas detector and detection method,” Chem. Defence Ships, vol. 2, pp. 29–33, Feb. 2012.
[28] L. Zhu-Qin and B. Ze-Sheng, “Design of a high precision instrument for combustible gas detection and alar,” Trans. Microsyst. Technol., vol. 32, no. 7, pp. 71–73, 2013.
Yin Wang received the B.S. degree in physics
from Qufu Normal University, China, in 2010 and Ph.D. degree in optics from University of Chinese Academy of Sciences, China, in 2015.
Yubin Wei received the B.S. degree, the M.S. degree
in automation from Liaoning Shihua University, China, in 2002, 2005, and the Ph.D. degree in opti-cal engineering from Shandong University in 2016, respectively.
He joined Laser Institute of Shandong Academy of Sciences in 2005, undertaking research in novel opti-cal fiber sensor development for coal mine, petro-chemical and power industries. He has authored and co-authored more than 30 journal and conference papers and more than 10 patents.
Jun Chang received the B.S., M.S., and Ph.D.
degrees from Shandong University, in 1988, 1991, and 2006, respectively. He was Visiting Fellow at the School of Electrical Engineering and Telecom-munications, University of New South Wales during 2004 and 2005. He is currently a Professor with the School of Information Science and Engineering, Shandong University. His research interests include optical fiber sensors and fiber lasers.
Tingting Zhang received the B.S. degree in
elec-tronic information from Ludong University, Yantai, China, in 2006, and the master’s degree in pattern recognition and intelligent system from Xidian Uni-versity, Xi’an, China, in 2009.
She joined Laser Institute of Shandong Academy of Sciences in 2009, undertaking research in optical fiber multi-gas sensors for safety monitoring in coal mine. She has authored and co-authored more than 20 journal and conference papers and more than 5 patents.
Tongyu Liu received the B.Eng. degree in radio
electronics from Shandong University, Jinan, China, in 1983, and the Ph.D. degree in materials science from Brunel University London, U.K., in 1999. After 14 years of study and work in U.K., he joined Laser Institute of Shandong Academy of Sciences in 2004, undertaking research in novel optical fiber sensor development for physical and gas sensing. His recent research interests have been focused on fiber-optic sensors for safety monitoring in coal mine, petrochemical, and power industries. He has authored and co-authored more than 150 journal and conference papers and more than 20 patents.
Tong Sun received the B.Eng., M.Eng., and D.Eng.
degrees in mechanical engineering from the Depart-ment of Precision InstruDepart-mentation, Harbin Institute of Technology, Harbin, China in 1990, 1993, and 1996 respectively, and the D.Phil. degree in applied physics from City University, London, U.K., in 1999. She joined City University as an Academic Visitor and, latterly, as a Research Fellow to work in the field of fiber-optic temperature measurement using luminescent techniques. She was an Assis-tant Professor at Nanyang Technological University, Singapore, from 2000 to 2001, and is currently a Senior Lecturer at City University, which rejoined again in 2001. She has authored or coauthored more than 80 scientific and technical papers. Her research interests are in optical fiber sensors, optical communications, and laser engineering.
Kenneth T. V. Grattan received the B.S degree in
physics and the Ph.D. degree from Queen’s Uni-versity, Belfast, U.K., in 1974 and 1978, respec-tively.