Progress towards a methodology for high throughput 3D
reconstruction of soot nanoparticles via electron tomography
E . H A F F N E R - S T A T O N∗, A . L A R O C C A∗ & M . W . F A Y∗,†
∗Department of Mechanical Materials and Manufacturing Engineering, The University of Nottingham, University Park, Nottingham, NG7 2RD, U.K.
†Nanoscale and Microscale Research Centre, The University of Nottingham, University Park, Nottingham, NG7 2RD, U.K.
Key words. 2D-TEM, 3D-TEM, electron tomography, fractal dimension, soot characterization.
Summary
The aim of this work is to make progress towards the devel-opment of 3D reconstruction as a legitimate alternative to traditional 2D characterization of soot. Time constraints are the greatest opposition to its implementation, as currently reconstruction of a single soot particle takes around 5–6 h to complete. As such, the accuracy and detail gains are currently insufficient to challenge 2D characterization of a representa-tive sample (e.g. 200 particles). This work is a consideration of the optimization of the steps included within the computa-tional reconstruction and manual segmentation of soot par-ticles. Our optimal process reduced the time required by over 70% in comparison to a typical procedure, whilst producing models with no appreciable decrease in quality.
Introduction
Three-dimensional (3D) electron tomography is a well-established technique for the analysis of complex nanoscale 3D structures. However, much of the optimization to date has concentrated on analysis of materials where one structure is fully characteristic of the whole, and of materials with dis-crete grey scales in transmission electron microscopy (TEM) images. Neither of these conditions apply to the analysis of soot. The complex and varying 3D nature of soot particles produced in combustion makes 3D analysis both highly desir-able, and excessively time consuming with a currently typi-cal tomographic procedure, due to the need to analyse mul-tiple structures to obtain an accurate understanding of the sample.
The production of soot is an undesirable yet unavoidable consequence of burning hydrocarbon fuel in internal combus-tion (IC) engines. The carbonaceous nanoparticles produced can have a profoundly complex and damaging effect on the environments into which they are released, and as such the
Correspondence to: Dr Antonino La Rocca, Engine Research Group, Depart-ment of Mechanical, Materials and Manufacturing Engineering University Park,
The University of Nottingham NG7 2RD,U.K. Tel:+44 (0)1159513815; e-mail: [email protected]
amount produced by internal combustion engines is limited by European regulation. The complex fractal-like morphol-ogy of soot nanoparticles plays an important role in deter-mining their exact behaviour, and thus the myriad problems that they cause. This includes their effect on human health when inhaled (Broday & Rosenzweig, 2011), contribution to the greenhouse effect via absorption of visible light (Khalizov et al., 2009), degradation of marine habitats (Mariet al., 2014) and damage to the lubricating properties of engine oil formu-lations (Georgeet al., 2007). Morphological characterization is an important initial step in developing intelligent strategies to combat the problems caused by soot emissions. The aim of the work reported here has been to make progress towards the development of an optimized methodology for the high through-put morphology characterization of soot nanoparti-cles in 3D using electron tomography. It is the belief of the authors that the use of 3D characterization has the potential to offer significant advantages compared to the current state of the art (2D TEM) and if developed appropriately could prove a very beneficial tool for researchers in all areas related to the study of soot and similar nanoparticles.
Soot is produced by internal combustion engines when in-complete combustion takes place in the cylinders. Such condi-tions arise during routine operation due to the presence of fuel rich zones (La Roccaet al., 2015). These areas of nonstoichio-metric air-fuel mixtures form for a variety of reasons, including insufficient fuel vaporization due to low engine temperature, limited fuel-air mixing prior to injection and the presence of fuel films on the cylinder walls and piston due to the injec-tion strategies (La Roccaet al., 2015). Additionally, soot can form from the direct pyrolysis of liquid fuel droplets due to the extreme temperatures (Heywood, 1988). Diesel engines and modern direct injection gasoline (GDI) engines are partic-ularly prone to soot formation due to limited fuel-air mixing prior to injection, though overall engine efficiency and emis-sions are improved compared to conventional gasoline engines (Mathiset al., 2005; Bonatestaet al., 2014). Use of exhaust gas recirculation (EGR) systems has been observed to increase the production of nucleation mode particles in the 10–25 nm range (Zhaoet al., 2013).
C
2018 The Authors.Journal of Microscopypublished by JohnWiley & Sons Ltd on behalf of Royal Microscopical Society.
From a chemical mechanism perspective, the most impor-tant initial precursor to soot formation is generally considered to be acetylene (Richter & Howard, 2000). This, and other small unsaturated species form early during combustion, and undergo a series of radical and polymerization reactions to form small aromatic species, such as benzene and naphtha-lene. These molecules continue to grow in size via further similar reactions with smaller molecules and with one an-other. The larger polycyclic aromatic hydrocarbons (PAHs) of around 1000u (unified atomic mass units) that eventu-ally form are the direct precursors to the first soot nuclei that leave the vapour phase. Physical collision of these 1nm spher-ical structures, concurrent with continued surface growth reactions with smaller species in the gas phase, produces the characteristic soot primary particles (Richter & Howard, 2000). These larger spherical structures have diameter typi-cally around 10–50 nm (La Roccaet al., 2013), and are the structural sub-unit of the distinctive fractal-like soot particles. Carbonization occurs due to the high temperature conditions during formation, with the result being that soot particles are almost entirely carbon in their elemental constitution (Richter & Howard, 2000). Oxidation of soot and its precursors occurs throughout all stages of soot formation due to the presence of oxygen in the high temperature environment of the com-bustion chamber, acting to reduce the concentration and size of any soot structures formed (Richter & Howard, 2000). The balance of these processes and thus the amount of soot formed, depends on the particular operating conditions of the engine. Soot particles, often referred to as agglomerates or aggre-gates, have a complex, branched morphology resulting from the random collisions of primary particles. The size of these structures typically ranges from 50–500 nm, though this is strongly dependent on the formation conditions (Clagueet al., 1999; Virtanenet al., 2004; Lapuertaet al., 2007; La Rocca et al., 2013). The term ‘mass fractal’ is often used to describe soot agglomerates (Rogak & Flagan, 1992; Koyluet al., 1995; Neer & Koylu, 2006), due to their resemblance to self-similar fractal patterns, though self-similarity in soot is often only true over very limited distances. The internal structures of the primary particles has been investigated and typically consists of an inner core and outer shell arrangement (Ishiguroet al., 1997). The inner core will contains several small, spherical or ‘fullerenoid’ carbonaceous structures surrounded by short, distorted layers of graphite-like carbon. The outer shell con-sists of an onion-skin like arrangement of short sections of graphite-like carbon, typically 2–5 carbon layers thick and 3 nm wide (Omidvarbornaet al., 2015). In a small number of publications, additional amorphous carbon structures have been observed in samples of GDI soot-in-oil (Uyet al., 2014; La Roccaet al., 2015).
The major fraction of the soot produced is emitted from the engine with the exhaust gases, contributing to a number of major problems in the environment. The negative effects of soot inhalation on human health have been widely
investigated and it has been observed that the surface area of the nanoparticles is linked to their toxicity (Oberd¨orsteret al., 1995). In the stratosphere, soot nanoparticles are involved in complex interactions with radiation (Yonet al., 2011), partic-ularly visible wavelengths, resulting in a net positive contri-bution to the greenhouse effect (Khalizovet al., 2009). Again it is seen that the fractal morphology, as measured via the fractal dimension, plays a role in determining the refractive properties of soot in these environments and similarly can be used to understand the Brownian coagulation of soot in at-mospheric models (Kajino & Kondo, 2011). A further example of the effects of soot is in its concentration in surface waters (Mariet al., 2014), where the surface area of soot particles act as active sites for adsorption of waterborne biological species, altering the microbial balance.
A small percentage of the soot produced in the cylinders becomes entrained within the engine lubricant oil, either via blow-by gases passing the piston rings (Green & Lewis, 2008) or via a thermophoretic mechanism into the oil film on the cylinder walls (Kittelsonet al., 1990; Suhre & Foster, 1992). The soot-oil relationship is extremely complex and as such reports in the literature on the effect of soot on lubricant oil viscosity, friction and on engine wear at times appear con-tradictory (Heywood, 1988; Chinas-Castillo & Spikes, 2004; Greenet al., 2006; Green & Lewis, 2007; Antuschet al., 2010; Huet al., 2013; Salehiet al., 2016). The particular changes that take place depends not only on the concentration of soot, but also on its morphology (Chinas-Castillo & Spikes, 2004; Antuschet al., 2010). It is known, for example that the surface area of soot nanoparticles correlates directly with increases in oil viscosity (Green & Lewis, 2007). Additionally, the oil for-mulation, contact type and lubrication regime will all play a role in the changes observed. Depending on the particular combination of contact-type and the lubricant oil chosen in a study, the presence of soot has been observed to cause both increases and decreases in friction and oil viscosity (Huet al., 2013; Salehiet al., 2016) and rates of wear within engines (Salehiet al., 2016).
It is clear from these examples that in order to efficiently and competently deal with the numerous problems that automo-tive soot causes, a thorough understanding of its morphology is needed. This will, in turn, permit a deeper understanding of the behaviour of soot and, through correlating properties to observations with modelling studies, enable effective design of solutions. As such, the characterization of soot is an area of great interest for researchers from various disciplines and many methods have been employed to these ends.
and size distribution of particles. Although these techniques can measure many thousands of particles within minutes, they only provide information on the diameter of the hydro-dynamic volume a particle occupies. In comparison to the known fractal structures of soot particles this information is clearly very limited and often more detailed methods of characterization are preferred.
Over the last few decades, TEM has been widely used for the detailed characterization of soot nanoparticles (Dobbins & Megaridis, 1987; Megaridis & Dobbins, 1990; Palotaset al., 1996; Clagueet al., 1999; Suet al., 2004; Devlinet al., 2008; Lapuertaet al., 2009; La Roccaet al., 2013; La Roccaet al., 2015; La Roccaet al., 2016). From TEM images a variety of parameters may be measured (volume, surface area, radius of gyration, fractal dimension, skeletal length etc.). However, this currently requires the manual measurement of several hundred particles, significantly increasing the time involved compared with the previous methods. Although the morpho-logical detail is greatly increased compared with simple hy-drodynamic diameter size distributions, it is still limited in this regard as they are based upon the measurements of two-dimensional (2D) images. As such, various assumptions, ap-proximations and empirical correction factors must be applied in order to infer the value of 3D morphological properties. For example, the number of primary particles that constitute an agglomerate is often calculated from the 2D area of a par-ticle in TEM images, first by assuming all primary parpar-ticles are perfectly spherical and of a constant diameter and then by using semi-empirical correction factors to account for the overlap of primary particles (Neer & Koylu, 2006). In some cases, agglomerate volume is then inferred simply by multi-plying the number of primary particles by the volume of the assumed spherical primary particle, ignoring the overlap of the primary particles (Koyluet al., 1997). In particular, em-pirical correction factors may be problematic when applied to a situation that does not resemble the experimental conditions under which they were deduced. In some instances, properties that can be measured from the 2D projection of the particle, such as radius of gyration and fractal dimension, may simply be assumed to represent the 3D values (Gwazeet al., 2006; Lapuertaet al., 2006; Sachdeva & Attri, 2008; Schenket al., 2015). In such cases the accuracy of this assumption depends on how well the TEM images portray the 3D nature of the particle, i.e. are more accurate if the particles are not partic-ularly large perpendicular to the TEM grid. The effect of these assumptions and approximations is to add an unknown level of uncertainty to morphological properties measured via 2D means, which may limit our ability to understand how soot morphology impacts its effect on lubricant oil properties.
Emphasis for 3D characterization
A small number of researchers (Medalia, 1970;, Adachiet al., 2007), including the authors (La Roccaet al., 2016), have
expressed concern over the validity of 3D properties inferred from just a single projection, though in the vast majority of publications this is ignored. The notion is that it can be con-sidered incorrect to only use values measured from a single 2D projection of a particle, given that all possible 2D projections are equally valid representations of the 3D structure and all involve the same lack of depth perception. The apparent mor-phology of a particle in a projection can change considerably if the angle of projection is altered, and as such the value of any measured morphological properties would also change con-siderably. Previous work by the authors observed that com-monly measured morphological properties could vary by up to 60% for the same particle when projection angles over a ±60°range were considered (La Roccaet al., 2016). Work by Adachi also found that 2D-derived properties are highly sensi-tive to the angle of projection, with similar levels of variability (Adachiet al., 2007).
If every soot particle in a sample showed a similar level of variability with the angle of projection and the contribution of all possible projections is considered (i.e. all projection are equally valid), a large uncertainty becomes associated with traditional single projection characterizations. As such, many more particles than the usual200 must be considered for the calculation of statistically valid means, greatly increasing the time taken for 2D characterization of samples.
Additionally, previous works (including that of the authors) have considered the discrepancy between 2D- and 3D-derived morphological parameters via 3D models of simulated (Ro-gak & Flagan, 1992; Martoset al., 2017) and real soot ag-glomerates (van Poppelet al., 2005; Orhanet al., 2016). Van Poppel observed that values of surface area and volume from 2D methods were up to 16 and 125 times larger (respectively) than the real 3D-derived values (van Poppelet al., 2005). Rogak’s study of simulated agglomerates observed that fractal dimension was generally underestimated by 10–20% when using 2D methods (Rogak & Flagan, 1992). Our own study found agreement with Rogak’s work and additionally that volume could be underestimated by up 40% via 2D methods (Orhanet al., 2016). Recently, Martos’ study of a large num-ber of simulated agglomerates found that 2D-derived radius of gyration underestimated the true values by over 45%, leading to a corresponding overestimation of fractal dimension (Mar-toset al., 2017). Whether 2D methods over- or underestimate the real values of morphological parameters depends on the exact methods that were used to derive the values from the 2D-projections.
of the greatest detail possible and would greatly reduce or even eliminate the need for unrealistic assumptions and correction factors. Additionally, the issue of multiple valid projections of the same particle is not present, and fewer particles need to be considered for the calculation of accurate and valid mean values.
Whilst a handful of publications have proved that soot char-acterization through 3D volume reconstruction is possible (van Poppelet al., 2005; Adachiet al., 2007; La Roccaet al., 2016), there remain a major challenge to be overcome be-fore the technique becomes a viable alternative to 2D-TEM, as the time required to produce the models is currently far too long for a statistically significant number of particles to be characterized.
The individual steps required to produce 3D volume recon-structions via electron tomography are discussed below in the context of soot-specific issues.
Acquisition
As for traditional 2D characterization, TEM images of soot agglomerates must be acquired for 3D characterization, so soot samples of interest must be prepared for electron microscopy. Due to the low contrast nature of carbon under the TEM beam soot must be deposited onto support films with as low contrast as possible, such as graphene oxide. Soot-in-oil samples must be subjected to a cleaning process the remove the oil residue, as it is a severe contaminant under the electron beam (Shuff & Clarke, 1991). This process includes dilution in heptane, followed by washing with diethyl ether and is described in greater detail in (La Roccaet al., 2013). Gold nanoparticle fiducial makers must then be added to the grid to facilitate high quality alignment of images (see next section for further details).
The tomographic reconstruction process is based upon Fourier Slice Theory, which states that the 3D volume of an object can be recreated from the complete set of its 2D pro-jections (Frank, 2008). The use of the term ‘propro-jections’ is an important nuance, and refers to the fact that contrast in TEM images used for tomography should be monotonically varying functions of the mass (i.e. mass-thickness contrast is dominant in forming the images, as opposed to diffraction con-trast etc.; Midgley & Weyland, 2003; Hawkes, 2006). This is known as the ‘projection requirement’, and for soot particles, conventional TEM images adequately fulfil this requirement.
A series of projections is produced by capturing multiple images of a soot particle as the TEM grid is tilted at a series of angles, most commonly in 1–2°increments. In theory the more complete the set of images the more accurate the recon-structed volume, though limitations of the TEM machinery mean that in most cases it is limited to a maximum tilt range of±60-70°.
Particles situated close to the edges of the grid can become obscured by the copper mesh at higher angles of tilt, and it may
become impossible to collect a tilt series over a sufficient range. So although for 2D TEM characterization particles needed only to be clearly visible, for 3D reconstruction we have additional restrictions on the location of particles, potentially reducing the number of suitable particles significantly. Also, if particles are present in too high concentrations they can obscure one another, and not allow for the reconstruction of individual particles. The transparency of soot nanoparticles under the electron beam means that it often hard to tell whether over-lapping agglomerates are indeed individuals or part of a single larger structure.
Once suitable particles have been found, the tilt series of images can be collected. Tilt series can contain as many as 100–200 images, and take up to an hour to complete. The large number of images required exposes the soot samples to high beam dosage, which can be problematic for soot-in-oil samples. Residual oil can cause severe contamination of the image, obscuring regions of interest (La Roccaet al., 2015), meaning quality tomographic reconstruction is no longer pos-sible.
Alignment
Prior to the reconstruction process the images in the tilt series must be aligned to a common coordinate system, else the tomo-gram produced will be of poor quality. Although the software used to capture the tilt series in this work [SerialEM (Kremer et al., 1996)] performs an alignment during acquisition, me-chanical limitations of the machinery means the tilt is not perfectly smooth. In studies of high contrast species, such as metal nanoparticles, markerless alignments based on simple cross correlation between adjacent images may be sufficient, but the low contrast of soot species means it is unsuitable for this work (Fernandez, 2012). Hence, we have used high contrast gold particles to improve both the automated acquisi-tion alignment, and the alignment by reconstrucacquisi-tion software (IMOD eTomo in this work). In the experience of the authors, fiducial marker alignment in eTomo is neither particularly difficult nor time consuming, and primarily automated. The main drawback associated with fiducial marker alignment is additional experimental step that is required in preparing the grids. Not only must an appropriate concentration of soot par-ticles be added, but fiducial markers must also be added in neither too great, nor too small a concentration.
Reconstruction
Once a suitably aligned tilt series has been created, the re-construction can then be performed. There are a number of algorithms that can be employed to produce the tomograms, using several software packages.
of the simplest and most widely used algorithms, and depend-ing on the software, hardware and number of pixels in the tilt series images, can complete in under a minute (Orhanet al., 2016). The simultaneous iterative reconstruction technique (SIRT) is another widely used method that involves some de-gree of back-projection, and depending on the number of iter-ations can take several hours to complete (Fernandez, 2013). Newer methods solve the reconstruction iteratively via an al-gebraic method and can produce high quality tomograms from relatively few images, though require prior knowledge of grey levels in the specimen (Batenburget al., 2009; Batenburg & Sijbers, 2011), and thus are unsuitable for the study of soot. IMOD with eTomo (Kremeret al., 1996), TomoJ (Messaoudil et al., 2007) and Tomo3D (Agulleiro & Fernandez, 2011) are examples of commonly used and freely available reconstruc-tion software.
An appraisal of the available reconstruction techniques must be performed in order to discover the optimal method. For viability in comparison to 2D-characterization, the time required for reconstruction is the greatest concern. For exam-ple if reconstruction of a single particle took 1 working day, characterization of an entire sample via a statistically rele-vant number of individuals (100–200 particles) would take around an entire year to complete, which regardless of any improvements to accuracy is simply too long. Additionally, we must ensure that measures taken to improve speed at this stage do not come at the cost of reducing the quality of the reconstructions to the point that they no longer offer greater morphological information than the current 2D methods.
Segmentation
Due to the low contrast of soot in TEM images, there is sub-sequently low contrast in the tomogram between soot parti-cle and background support film. Additionally, reconstruction artefacts lead to varying grey levels within areas of particle matter, increasing the difficulty of the process. Since no gen-erally applicable computational method for segmentation has yet come to the fore, manual segmentation is still amongst the most widely used methods (Fernandez, 2012).
Depending on the size of the particle and the resolution in the TEM images, the tomogram can easily be several hun-dred slices thick. Manual segmentation of this many images can be extremely time consuming, and is probably the most time intensive step in the entire 3D-characterization process. Segmentation also uniquely defines the particle model that is produced and characterized, and so defines the values of the parameters measured. Accuracy in manual segmentation is clearly of great importance, yet the more accurately the tomo-gram is segmented, the more time is required.
There are two obvious ways in which the time taken for seg-mentation could be reduced. The first is to develop a protocol for the postprocessing of tomogram slices so that automated segmentation is possible. Difficulties envisioned with this
ap-proach relate to the strong variability in the quality, contrast, degree of artefacts etc. of the tomograms, which depend upon the specimen under study, imaging conditions, reconstruc-tion algorithms used etc. It may not be possible to develop a methodology robust enough to be generally applicable, and may result instead in a method that requires time for the tun-ing of postprocesstun-ing parameters comparable to that needed for manual segmentation. A second method would be to de-velop the use of interpolation in manual segmentation, i.e. to manually segment everynth slice, and interpolate the results in between. This could dramatically reduce the time required for segmentation, whilst retaining the benefits of manual seg-mentation (applicable to all types of tomogram, low tech etc.). This method is clearly less desirable than a high quality auto-mated process, though represents a more achievable goal in the short term.
Elongation correction and validation
Although tomographic reconstruction from TEM images can be performed, in practice it is rarely possible to produce the ‘full set’ of projections that is described in Fourier Transform theory. Mechanical limitations mean that a±70°tilt range is often the most that can be achieved, resulting in a ‘miss-ing wedge’ of information. This causes an elongation and blurring of the reconstructed volume in the direction of the missing information (i.e. the z-direction, perpendicular to the TEM grid; Fernandez, 2012). Consequently, even if segmenta-tion perfectly isolates all particle matter within the tomogram the resultant particle model will still be erroneous because of the elongation, which will affect measured parameters such as volume and surface area. As the purpose for the develop-ment of a 3D-TEM methodology for soot is to improve the quality of morphology characterization, it is clearly of great importance that the extent of elongation be quantified, and a strategy be developed to ensure 3D-TEM actually does offer significant improvements compared to the current state of the art.
In 1980, Radermacher proposed a series of equations to evaluate elongation in tomographic reconstruction as a func-tion of the maximum tilt angle, resulting in the following re-lation (Radermacher & Hoppe, 1980):
exz=
α+sin (α) cos (α) α−sin (α) cos (α).
For a maximum tilt range of±60°, this results in a supposed elongation factor (exz) of 1.55 in the z-direction. Alternatively,
the original. On occasion, researchers have attempted this using the gold nanoparticles added as fiducial markers (Mezerji et al., 2011). These particles are spherical and can be acquired with well-defined diameters as small as 5nm. However, they are far removed from resembling real soot ag-glomerate morphology. In addition they are opaque to the electron beam, meaning that the projection requirement for tomographic reconstruction is not fulfilled in bright field (BF) TEM, meaning HAADF-STEM must be used (see (Frank, 2008) for further details on the projection requirement). In the BF-TEM tomography, gold nanoparticles are particularly prone to the effects of fanning artefacts, and at typical resolutions con-stitute only a small number of pixels (10–20) As such, elonga-tion calculated via these structures are particularly prone to error in their analysis.
Because of such issues with real structures of known dimen-sions, researchers in the field of electron tomography have analysed reconstruction elongation and artefacts via the use of simulated data sets (Friedrichet al., 2011; Aliet al., 2012). The example most closely related to our own area of research is Okyay’s study of SEM tomography of soot (Okyay et al., 2016), which aimed to quantify the effects of missing wedge elongation via reconstruction of a sphere model measuring the equivalent of 100 nm in diameter. Values of volume and surface area from the reconstructed sphere were compared to values from the original model, showing deviations of 0.6% in volume and 7% in surface area. The size of this structure is clearly more representative of real soot agglomerates than the gold nanoparticles, and the computational nature of the model means the appearance of the 2D projections can eas-ily be tuned to match the contrast and noise in real images (Friedrichet al., 2011; Aliet al., 2012). However, it is known that distortions in tomography are dependent upon the objects shape and size (Frank, 2008), and so for a truly representa-tive and accurate calculation of the elongation, the calibration species should ideally mimic the defining fractal morphology of soot aggregates as well.
Towards these ends, we have devised a method for the cre-ation of simple, soot-like 3D models and their TEM-style tilt series in order to assess the extent of elongation to be expected in the tomographic reconstruction of soot nanoparticles. The elongation factor is calculated for multiple 3D models, and a full ‘original versus reconstructed’ morphology assessment is carried out for a select few. This investigation allows us an idea of the scale of the error we can expect during real soot reconstruction, and in future the ability to design a scheme for the correction of the effects of elongation, blurring, fanning and other reconstruction artefacts.
Experimental setup and sample preparation
Three model systems of soot were used in this work: flame-generated soot and diesel and gasoline engine soot extracted from oil in the sump. Diesel soot-in-oil was drawn from a
high-pressure common rail direct injection diesel engine which was a single cylinder variant of a multicylinder de-sign, see (La Roccaet al., 2016) for further details. Gasoline soot-in-oil was collected from the oil sump of a modern 1-L turbocharged gasoline direct injection passenger car driven in city/urban environment after 6000 miles. All soot samples were deposited onto 300 mesh Graphene Oxide TEM support films obtained from EM Resolutions. Flame-generated (FG) soot was deposited directly onto the TEM grid. As mentioned, soot samples from engine oil need to undergo a cleaning pro-cedure prior to deposition on the grid. Oil samples were diluted in heptane at a ratio of 1:60, then deposited onto the grid be-fore further washing with diethyl ether. Further details of this procedure can be found in previous publications (La Rocca et al., 2013; Orhanet al., 2016). Colloidal gold nanoparticles in aqueous suspension were deposited onto the grid to aid alignment of images. Gold nanoparticles were obtained from Generon, and are spherical with 10 nm diameter. Soot char-acterization was carried out at the Nottingham Nanoscale and Microscale Research Centre (nmRC) using a JEOL 2100F TEM equipped with a Gatan Orius CCD camera, operating at 200 kV.
Reconstructions were performed using IMOD with eTomo (Kremer et al., 1996), on a Lenovo PC with a 3.50 GHz Intel Xeon E5-1620v3 processor (8 CPUs) and 32 GB RAM, using a 64-bit version of Windows 7. The two single-axis reconstructions were performed on the same tilt series, which contained an image every 1°over a ±60° tilt range (121 images total). The measurement of morphological parameters from the produced 3D reconstructions was carried out using a combination of MATLAB and Fiji (Schindelinet al., 2012). Fiji is a distribution of the open-source image-processing software ImageJ (Schindelinet al., 2015), pre-installed with a range of plugins and supporting a range of scripting languages to facilitate development of novel image-processing algorithms. Morphological characterization was carried out as follows: Volume and surface area were determined using the BoneJ plugin for ImageJ (Doube et al., 2010), radius of gyration was determined using a self-produced ImageJ macro, and fractal dimension using the Box-count algorithm for Matlab (Moisy, 2008).
Simulated data
Results and discussion
Reconstruction algorithm
This section of the paper details the investigation into the opti-mal reconstruction algorithm to use to facilitate high through-put 3D characterization of soot nanoparticles.
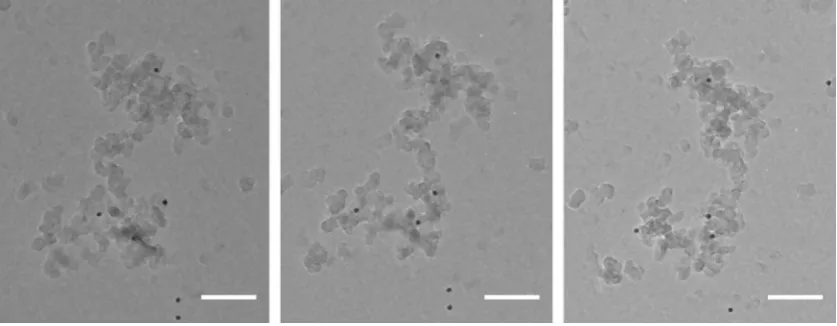
In order to assess the optimal technique, two reconstruc-tion algorithms were used to produce 3D models of the same FG soot particle (Fig. 1). The time required for the computational reconstruction step, and the values measured during the morphological characterization for each method were compared to assess speed and quality. The algorithms employed in this study were single-axis WBP and single-axis SIRT (with 50 iterations). WBP is based on a real-space ap-plication of Fourier Transform theory, assuming a monotonic relationship between particle mass and its representation in the projections. SIRT performs an iterative process that compares experimental projections to those computed from an estimated tomogram, and uses back-projection of the error between them in order to refine the reconstruction (Fernandez, 2012). WBP reconstruction is essentially the lowest quality/computationally cheapest method that may be used, and is expected to be quicker than the iterative SIRT method but produce an inferior tomogram. The tilt series consisted of 121 individual 16-bit images, 1000×668 pixels in size.
The weighted back-projection algorithm was much quicker than the iterative technique, taking only around 30 s. SIRT reconstruction was performed with 50 iterations, based on the suggestion of Messaoudiet al.(Messaoudilet al., 2007). After image alignment, the computational step took 135 min to complete. With a view towards high throughput charac-terization of soot nanoparticles, it appears as though the SIRT method could be too slow regardless of the quality of recon-struction. Our aim is to develop a method to characterize soot samples to a higher level of detail than current methods al-low, but within a similar time frame. Characterization of the
average morphology of a soot sample requires the considera-tion of upwards of 100 particles (La Roccaet al., 2013), and at this rate would take around 1 month simply for the produc-tion of the tomograms, and therefore even longer for the full characterization. Evidently, SIRT must present pronounced improvements in quality in comparison to the WBP method to even be considered.
The quality of reconstruction was assessed by comparing the values of volume, surface area, fractal dimension and ra-dius of gyration measured from each of the 3D particle models. Comparison of absolute accuracy in the reconstruction of the FG particle is not easy because the true values of the mor-phological parameters are not known. However, assessment of accuracy could be achieved through the reconstruction of a simulated tilt series for a model of known dimensions. Such methods were employed by Okyayet al.in their study of SEM tomography of soot and Adachiet al. in their electron to-mography study of soot via the reconstruction of numerically generated spheres (Adachiet al., 2007; Okyayet al., 2016). However, in this case absolute accuracy was deemed unnec-essary for a comparison of the two methods. Simply put, there was a small enough difference in the values of volume, surface area, etc. that it could be concluded that there was no signifi-cant difference in the quality of the reconstructions. The values of the morphological parameters are presented in Table 1.
[image:7.595.94.513.542.705.2]The particle models were produced from the tomogram via manual segmentation. In each slice of the tomogram, the oper-ator differentiated particle matter from background material in the region of interest (ROI) selection using image analy-sis software ImageJ. Manual segmentation is often preferred in tomogram segmentation as low signal to noise ratio in TEM images renders application of automated/thresholding methods difficult (Fernandez, 2012), particularly due to grey level discrepancy within particle matter. However, automated methods have been employed in tomographic studies of soot (Adachiet al., 2007; Okyayet al., 2016). Segmentation re-sults in a 3D voxel map of the particle, which was then
Table 1. Time required for, and morphological parameters measured from two reconstructions of FG soot particle.
Algorithm Reconstruction time (mins) Z-depth (1 nm slices) Volume (nm3) Surface area (nm2) Fractal dimension Radius of gyration (nm)
WBP 0.5 203 1 819 000 268 900 2.367 148.6
SIRT 135 197 1 920 000 273 800 2.377 148.5
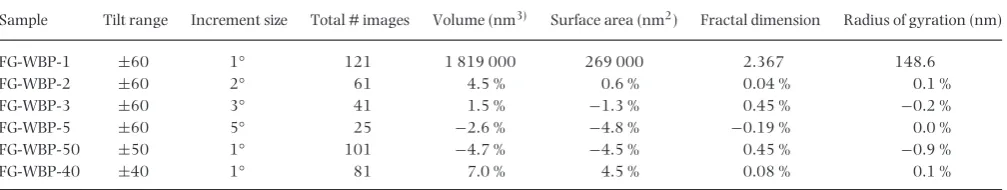
Fig. 2. Equivalent slices from within WBP and SIRT tomograms, roughly halfway through the depth of the particle. Note similarity in visual quality and similarity between particle matter in WBP and SIRT tomograms. Scale bars are equal to 100 nm.
characterized using a combination of Fiji, the boneJ plugin for ImageJ and self-produced macros for ImageJ.
In terms of visual quality, there was little difference between the two tomograms. The WBP tomogram was slightly more prone to noise, producing images with a ‘grainier’ quality. Figure 2 shows sections from within similar areas of the to-mograms to illustrate this point. As such, the two toto-mograms were similarly easy to manually segment, i.e. there was a simi-lar degree of subjectivity in distinguishing particle matter from the background.
After segmentation, the content of each of the tomograms were compared by superimposing the ROI sets of one tomo-gram upon the other tomotomo-grams. In doing this, it could easily be seen that the WBP and SIRT tomograms were essentially identical. In every slice the ROI set of one particle appeared to almost perfectly match with the particle matter visible in the other’s tomogram. As such, the differences in the measured pa-rameters between these two methods (5.5% in volume, 1.8 % in surface area and<0.5% difference inDfandRg) provide us
with an example of the amount of error we could consider ac-ceptable as it derives simply from the manual segmentation by the operator, due in part to subjectivity of the particle matter. It was observed that WBP produces a tomogram not remotely inferior to that produces by SIRT, even with 50 iterations. Given that the former completes so much faster, we can only conclude that WBP is the most appropriate method to use for high throughput reconstruction and characterization.
Three-dimensional renderings of the FG soot particle as produced by WBP and SIRT reconstruction are shown in Figure 3.
Content of tilt series
Fig. 3. Three-dimensional models of FG soot particle visualized in UCSF Chimera. Left to right: WBP, SIRT.
Table 2. Size of deviations between particles produced from reduced tilt series and FG-WBP-1 particle. FG-WBP-1 results shown as absolute values, deviations shown as percentage’s of FG-WBP-1 results. Positive values indicate results larger than those for FG-WBP-1 and negative results are those smaller than that for FG-WBP-1.
Sample Tilt range Increment size Total # images Volume (nm3) Surface area (nm2) Fractal dimension Radius of gyration (nm)
FG-WBP-1 ±60 1° 121 1 819 000 269 000 2.367 148.6
FG-WBP-2 ±60 2° 61 4.5 % 0.6 % 0.04 % 0.1 %
FG-WBP-3 ±60 3° 41 1.5 % −1.3 % 0.45 % −0.2 %
FG-WBP-5 ±60 5° 25 −2.6 % −4.8 % −0.19 % 0.0 %
FG-WBP-50 ±50 1° 101 −4.7 % −4.5 % 0.45 % −0.9 %
FG-WBP-40 ±40 1° 81 7.0 % 4.5 % 0.08 % 0.1 %
As in the previous section, the time required for the compu-tational step and the quality of reconstructions via the values of the measured morphological parameters were considered. The results for the WBP algorithm are the focus of this section given the findings of the previous section.
As WBP reconstruction completed so quickly already (30 s for the FG particle), there was no appreciable decrease in time for the ‘reduced’ tilt series. In terms of visual quality, most of the tomograms produced were fairly similar. Only the FG-WBP-5 tomogram was of significantly lower quality, with higher lev-els of noise meaning that some regions of particle matter were less easily discernible from the background in manual segmen-tation (see Fig. 4). However, as this tomogram was produced from only 25 images in total and by one of the most basic reconstruction algorithms, the quality was still impressive.
As performed in the previous section, the FG-WBP-1 ROI set was superimposed on the other tomograms to compare the content/ordering of particle matter. It was observed that the content of the FG-WBP-2 tomogram was essentially identical to FG-WBP-1 as in every slice the ROI selection was appropri-ate (as was seen earlier for FG-SIRT-1). This meant there were now three particles whose segmentations could be considered as three separate considerations of the same tomogram. The
scale of deviations considered acceptable were barely changed by this, as FG-WBP-2 possessed an intermediate volume, sur-face area and fractal dimension. There was a marginal increase in the size of deviations in radius of gyration, though this re-mained below 0.2%. None of the other tomograms matched the FG-WBP-1 ROI set so closely, though differences were fairly minor and overall the particles were very similar.
To assess their quality more quantitatively, particles pro-duced from the repro-duced tilt series were compared in terms of their morphological parameters to the FG-WBP-1 particle (or FG-SIRT-1 for the SIRT reconstructions). This was produced from the most complete tilt series and thus the tomogram should be of the highest quality, and the particle should be the most accurate. Large deviations from the values measured for the FG-WBP-1 particle would indicate lower quality recon-struction, whilst deviations comparable to those seen between the FG-WBP-1 and FG-SIRT-1 particles (as discussed in the previous section) indicate a very similar quality.
[image:9.595.52.556.336.431.2]Fig. 4. Comparative slices from FG-WBP-1 (left) and FG-WBP-5 (right) tomograms. Images are not postprocessed.
range (FG-WBP-40) that showed consistently larger devia-tions, but given that our bounds for acceptable deviations (i.e. those due to subjectivity in manual segmentation) were based on only three sets of results, even these may not be significant. These findings are impressive, and potentially very useful con-sidering that we are able to significantly reduce the number of images, and therefore beam exposure, with no large losses in quality.
There was no clear relationship between the number of im-ages a particle was reconstructed from and how much that particle deviated from FG-WBP-1 particle in terms of the mor-phological parameters, e.g. FG-WBP-3 was closest but was produced from second fewest images. Similarly, there was no strong relationship between the sizes of the deviations in the particular parameters. Such behaviour might indicate that when segmenting these tomograms they were similar enough that the limiting factor in quality was the human operator, rather than the appearance of the tomograms.
The results in this section have shown that WBP reconstruc-tion can produce tomograms of good quality from as few as 25 images over a±60°tilt range. Despite the FG-WBP-5 parti-cle showing no significantly larger deviations than any other particle it is the opinion of the authors that the FG-WBP-3 protocol, reconstructed from 41 images over a±60 tilt range, represents the optimal situation as lower image quality for FG-WBP-5 hampered segmentation. As the particle with the largest deviations, FG-WBP-40, was produced from a rela-tively large number of images, it appears that reducing the number of images via increasing increment sizes between them is better for particle quality than reducing the overall tilt angle range. The main benefits of these findings is to greatly reduce the beam dosage experienced by the soot particles that are imaged. This will greatly reduce the likelihood of carbon contamination from mineral oil obscuring particles, as was observed in (La Roccaet al., 2015), permitting less rigorous sample preparation procedures to be used. Additionally, it will
reduce the likelihood of damage or changes to soot structures occurring from beam damage during the acquisition of the tilt series. Despite a reduction in the number of images needed, any improvements to speed of acquisition of a tilt series are expected to be minor as the limiting factor in this case is the tracking of particles between each tilt increment, which takes slightly longer for larger increments sizes.
Effects of interpolation on segmentation quality
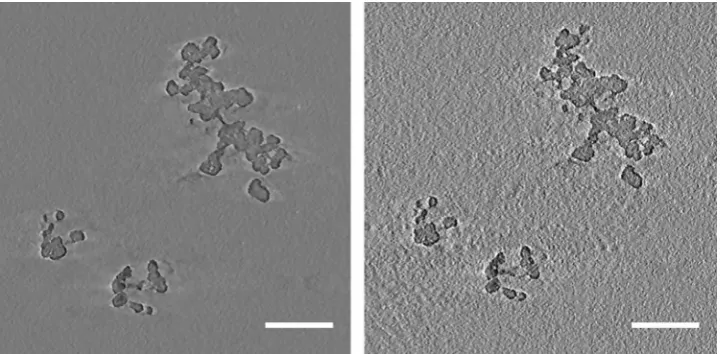
In an attempt to explore possible improvements to the manual segmentation of soot particles, the effects of differing degrees of interpolated segmentation upon the quality of 3D volume reconstruction were investigated. From the tomograms of nine individual soot particles, multiple versions of each particle were produced by segmentation utilizing five different levels of interpolation. The particles in question come from a range of sources, including the flame-generated particle considered thus far, carbon black, and soot-in-oil from both diesel and GDI engines. Particles are shown in TEM images in Figure 5 below. They represent a diverse range of sizes and shapes, from extensively branched 3D structures over a micrometers in length to highly clustered particles consisting of only a handful of primary particles. Such a set of particles were considered in order to improve the validity of any findings, as to be able to recommend a procedure that may be appropriate for soot particles of any size and morphology. For the FG particle, the FG-WBP-1 tomogram was used, whereas all other particles were reconstructed using the WBP-3 protocol.
Fig. 5. Untilted TEM images of the nine soot particles studied in this section. Scale bar equal to 100 nm.
segmented slices can greatly reduce the time required, but leads to inaccuracies in the size and shape of the produced particle as the interpolation does not make any knowledgeable prediction of the intermediate particle matter. The FG-WBP-1 particle already introduced in previous sections represents a full manual segmentation of the tomogram, in which the ROI selection of particle matter is reviewed to be to the operator’s satisfaction in every slice.
For each tomogram, the time required for segmentation at each level of detail was recorded, and for the resultant parti-cles the morphological parameters used throughout this work were measured. In this case, the values provided by full seg-mentation (e.g. the FG-WBP-1 and equivalent results for each particle) act as the standard, as they represent the most accu-rate selection of the particle matter present in the tomogram. Again, deviations from the ‘full’ values were compared to those between the FG-WBP-1, -WBP-2 and –SIRT-1 particles, as this represents the magnitude of deviations that can occur simply
due to subjectivity in particle matter and manual segmenta-tion. In an ideal scenario, interpolated segmentation will allow time to be saved during the segmentation whilst still producing a particle that falls within, or close to, the bounds of ‘operator uncertainty’ set by these three particles.
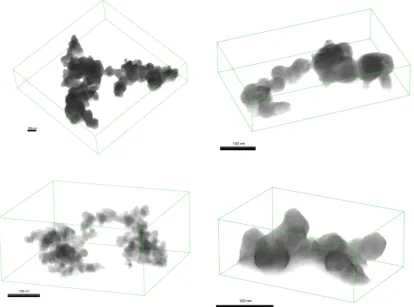
Fig. 6. Average decreases in time taken for the various levels of interpolated segmentation, presented as percentage of time required for full manual segmentation (solid line, left y-axis). Also showing average decrease in particle volume for each level of interpolation, as a percentage of the volume of the fully manually segmented particle (dashed line, right y-axis). Error bars represent 95% confidence intervals.
Table 3. Decreases in time and morphological parameters at each level of interpolated segmentation as percentage of values for ‘full’ manual segmentation. Values are averages of those for all nine particles.
Segmentation Protocol
time required (% of full)
Volume decrease (% of full)
Surface area decrease (% of full)
Df
decrease (% of full)
Rg
decrease (% of full)
5th 58.7 3.4 3.9 0.08 0.93
10th 32.5 8.4 10.7 0.34 2.29
15th 21.7 11.2 15.8 0.42 3.53
20th 17.5 26.4 25.8 0.71 5.21
also considered. For each of the agglomerates reconstructed, the morphological parameters of the ‘interpolated particles’ were compared to those of the fully segmented particle. The changes in the values of the parameters were quantified as a percentage of the ‘full’ values and the results were aver-aged to give those shown in Table 3. It should be noted that the values of the various parameters always decreased for in-terpolated particles compared to the ‘full’ particles, because the particular interpolation method applied with ImageJ had the tendency to underestimate particle matter that was not continuous between adjacent manually segmented slices. The error bars shown are 95% confidence intervals based on the nine different particles considered.
As mentioned, deviations in the values of the morpholog-ical parameters was compared to the size of those observed between the FG-WBP-1, -WBP-2 and -SIRT-1 particle. These were: 5.5% in volume, 1.8% in surface area, 0.4% in frac-tal dimension and 0.2% in radius of gyration. In terms of volume only ‘5th slice’ interpolation produced particles that
were within the acceptable limits, with an average decrease of 3.5% compared to fully segmented particles. At an average decrease of 8.4%, 10th slice interpolated presented a more sig-nificant reduction in quality. Volume losses up to the ‘15th slice’ level remained fairly linear, but 20th slice segmentation showed a severe drop in quality, with an average decrease of 26% in volume. The data suggested that particles with higher volume/surface area ratios (such as Carbon Black and GDI-E) lose less volume with interpolation, though ROI selection of the slices took comparatively longer.
The effects of interpolation on the accuracy of the particle surface area were fairly similar. At the 5th slice level, a decrease of 3.9% represented the most acceptable levels of information loss. This was larger than the maximum difference observed between the 3 particles acting as the standard (1.8%), but since there are only 3 results to which we compare they are considered more as guideline than a strict threshold. Losses in surface area at the 10th and 15th slice levels were slightly larger than seen for volume, though at the 20th slice level they were very similar. Again it appeared that particles with higher volume/surface area ratios were less prone to losses in surface area, though as mentioned these particles generally took longer to segment.
[image:12.595.39.281.368.476.2]limited to 5.2% at the 20th slice level (8.2% at upper con-fidence interval), and at just 0.9% at the 5th slice level. For these two shape descriptor parameters, it was mostly the parti-cles with a combination of low volume and small z-depth that had the greatest losses as the level of detail in the interpolated segmentation decreased.
Overall, our data on these nine agglomerates suggested that interpolated segmentation between every 5th slice would pro-vide particles that could be characterized to a level of accuracy similar to that of full manual segmentation. At this level of interpolation, segmentation could be expected to take around 40% less time than a fully manual inspection of the tomogram, concurrent with decreases of around 4.5% in volume, 4.9% in surface area 0.3% in fractal dimension and 1.6% in radius of gyration (all upper limits of the 95% confidence intervals).
The conclusion of our investigations into the optimization of 3D reconstruction is to suggest the following conditions:±60° tilt series with an image every 3°(41 images total), WBP re-construction and interpolated segmentation between every 5th slice. By comparison, a typical reconstruction procedure for the study of soot nanoparticles, based on the conditions in the work of van Poppel (van Poppelet al., 2005), Adachi (Adachiet al., 2007; Adachi & Buseck, 2008), Okyay (Okyay et al., 2016) and Cabie (Cabi´eet al., 2016), could be:±60°tilt series with an image every 1°(121 images total), single-axis SIRT with 50 iterations and full manual segmentation. Our optimized method was compared to this averaged protocol for reconstruction of the FG soot particle for the time required. In terms of the number of images used, potential beam dosage ex-perienced by the sample is cut by two thirds. This is particularly advantageous for soot-in-oil samples, where contamination causing obscuring is a major problem. The time required for SIRT reconstruction (computational step only) of the tilt series was 135 min, compared to<1 min for WBP reconstruction. The time required for alignment etc. prereconstruction was identical. Full manual segmentation of the SIRT tomogram required 144 min, compared to 79 min for segmentation in every 5th slice. Overall, our optimized method reduced the time required by 71.5%.
Reconstruction of simulated soot structures
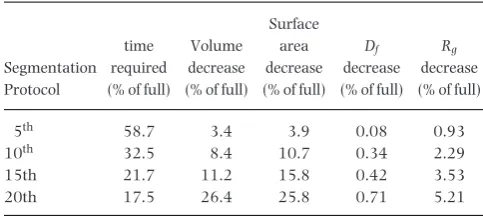
For each synthetic structure, three tilt series were generated: ±80°every 1°(161 images),±60°every 1°(121 images) and ±60° every 3° (41 images) as per the optimal result of the previous section. Each tilt series was reconstructed in order to understand the extent of elongation and quality of reconstruction as a function of tilt range and number of images. Segmentation was carried out manually using Im-ageJ. Segmented models were characterized using ImageJ and Matlab, as was used for the real-soot reconstructions. Ex-amples of simulated 3D models and tilt series are shown in Figure 7.
Simple sphere reconstruction. To initiate this section of our study, a simple 3D model of a sphere was created in order to be reconstructed, similar to the work by Okyay (Okyay et al., 2016). A±60°tilt series was created for the 350px diameter sphere, and the contrast was altered and artificial noise was added so that it more closely resembled a genuine TEM tilt series. The sphere was subject to WBP reconstruction and full manual segmentation (in contrast to SIRT reconstruc-tion and automated segmentareconstruc-tion performed by Okyay). The reconstructed model was 15% longer in the z-direction with no significant difference in the x- and y-directions, resulting in a lemon-like shape. The volume and surface area of the recon-structed sphere was 2.3% and 2.4% larger than the original values, respectively. By comparison, Okyay’s±80°(with 10° increments) reconstruction of a 100 px sphere using SIRT with 100 iterations resulted in no elongation, and deviations in volume and surface area of 0.6% and 7%, respectively. The significant deviations between our results is likely due to dif-ferences in the sizes of the spheres, reconstruction methods, tilt series content and segmentation method. As already men-tioned, it is known that the extent of the deviations due to the missing wedge depends upon the morphology of the object in question, and this sphere reconstruction provides a useful data point to compare the reconstruction of the more complicated models to.
[image:13.595.64.550.560.694.2]Fig. 8. Three-dimensional renderings of particles (left to right): random12, random2, random5, random7. Generated using UCSF Chimera (Yanget al., 2012).
Elongation. The±80°tilt series represents the largest tilt range that can be reconstructed using eTomo. The manual determination of the z-length of the particles was performed without prior referral to the original z-length, to limit the effects of bias. The average elongation for the 14 synthetic particles reconstructed from±80°tilt series was 0.4%±0.2% (95% CI). In terms of 1-px thick slices of the tomogram, this is equivalent to at most two slices larger than the original models. At this maximum tilt range, WBP reconstruction apparently results in no significant elongation of the particle matter.
The±60°tilt series represents the tilt range that can most typically be achieved in routine soot sample analysis. At this tilt range, the average elongation was 4.0%±1.0% (95% CI). This is clearly much smaller than seen for the simple sphere recon-struction and the prediction from Radermacher’s equation. Elongation has dependency upon the shape of the specimen, as soot-style synthetic particles were much less affected than the simple sphere (15% vs. average 4%). Additionally, vari-ability in the shapes of the 14 soot-style particles is reflected in the relatively large confidence interval (±1.0%).
The ±60° with 3° increments tilt-series represents the fewest images from which good quality tomograms can be produced, as per the results of the previous sections. Unsur-prisingly, the measured elongations are very similar to those of the 121 image±60°tilt series, being on average+3.8% ±0.8% (95% CI). As seen previously, the degree of noise in these tomograms did increase, though was not severe enough to significantly hamper the segmentation process. Based on the similarity of the synthetic particles to real soot agglomerates, we can be reasonably confident that the extent of elongation in real situations is similar to that seen in this work.
Full morphological analysis. Full morphological analysis was carried out on simulated particles named: random2, random7, random9 and random12. Models are shown in Figure 8 and results detailed in Table 4.
Generally, deviations in the maximum x and y dimensions of the reconstructed particles were insignificant, with only a single result>1%. The size of the elongation for each particle is shown in the Zmaxcolumn, and again shows the variation
of elongation with particle morphology. Despite only minor
Table 4. Size of the deviations in morphological parameters of recon-structed structures in comparison to the original models. X, Y, Zmaxrefer
to the maximum distance in those respective direction (Z perpendicular to and X and Y parallel to the tilt axis).
Percentage deviations versus original values
Particle Xmax Ymax Zmax Volume
Surface
Area Rg Df
Random2 −0.40 0.95 2.92 25.69 −2.29 0.76 2.655
Random7 0.37 0.30 4.43 26.96 0.61 −1.88 2.651
Random9 0.31 0.54 4.23 24.42 1.64 0.98 2.670
Random12 1.34 0.78 2.72 36.17 2.76 −1.18 2.668
increases in the maximum dimensions of the particles, there is clearly a significant overestimation of particle volume resulting from reconstruction and segmentation. The signif-icant thickening of the particle is likely due to reconstruction artefacts resulting from the lack of ‘information’ in the missing-wedge and between the projections. Elongation, noise and fanning artefacts reduce the definition of particle edges which can cause them to blend together in appearance, particularly in the direction of the missing wedge (Fernandez, 2012). Consequently, some areas of the tomogram falsely appear to contain particle matter and there is an overselection in the segmentation. These effects are particularly prominent on shielded/internal surfaces, especially those towards the middle of the structures and act to increase the particle volume and reduce the surface area, as demonstrated from a 2D viewpoint in Figure 9.
[image:14.595.301.544.299.388.2]Fig. 9. Side-on representative of structure formed from primary particle-style spheres, with areas prone to blurring highlighted. Area and perimeter values (in pixels) shown for perfect segmentation and blur-affected segmentation, showing increase in area (cf.Volume in 3D) and decrease in perimeter (cf.surface area in 3D).
Fig. 10. Examples of typical structures of flame-generated, carbon black, diesel soot-in-oil and GDI soot-in-oil. In each image, the z-direction is perpen-dicular to the scale bar (vertical), as the particles are being viewed from the side on. GDI-D and diesel soot structures are primarily just 1 primary particle thick in z-direction. Scale bar equal to 100 nm in each image.
gyration and fractal dimension measured from reconstruc-tions are within 2% of the original values, implying that the particles retain their particular fractal identity after reconstruction. If these results are indeed representative of those for real soot agglomerates (as we have tried to the best of our abilities to make so, with mimic of fractal geometry etc.) it represents an extraordinary level of accuracy, especially in comparison to the compounding of known and unknown er-rors in 2D-TEM characterization that was described in earlier sections.
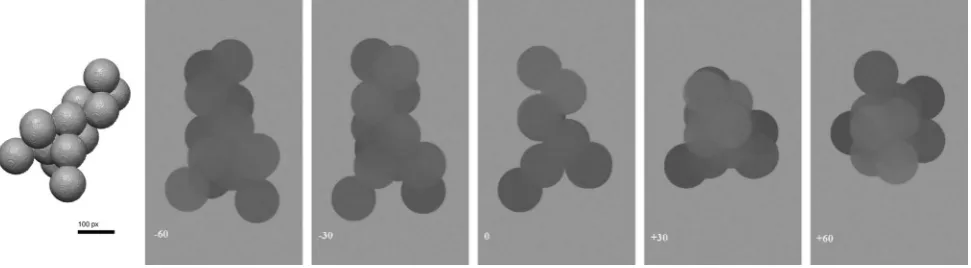
Three-dimensional soot-in-oil structures
[image:15.595.97.512.244.551.2]sample large enough for statistically relevant characteriza-tions (e.g.>200 individual agglomerates typically) has not yet been reconstructed, a sufficient number have been to allow a qualitative understanding of the typical 3D characteristics of agglomerates from different samples. So far, carbon black, flame-generated soot, diesel soot-in-oil and gasoline soot-in-oil samples have been considered.
Typically, flame-generated soot and carbon black nanopar-ticles showed an extensive, fractal, 3D structure, i.e. particle matter extended in all three dimensions from the cen-tre, in the standard structure of agglomerated spherical primary-particles.
Diesel soot-in-oil particles were also fractal aggregates of primary particles. However, in contrast to the flame-generated soot they were notably 2D, in general being just a single primary particle thick in the z-direction (perpendicular to TEM grid).
The structure of soot agglomerates in the GDI drain oil was also fairly typical in terms of a fractal arrangement of pri-mary particles. Similarly to diesel soot-in-oil, the structures were fairly small and their extension in space primarily lim-ited to just two dimensions. However, GDI soot-in-oil struc-tures weren’t quite as 2D, as strucstruc-tures were generally at least two primary particles thick in the z-direction in some sections of the particle. Examples of 3D models of soot structures from these different sources are shown in Figure 10.
Certainly such observations are qualitative, but are a promising indication of the type of extra information 3D mor-phology characterization can offer. Due to the lack of depth perception, the deficiency of 3D character in diesel and GDI soot-in-oil is not clear to see in 2D-TEM projections and only with 3D reconstructions we can truly begin to appreciate, par-ticularly quantitatively, the third dimension of soot structures. The gasoline soot has smaller primary particles, typically 30 nm, than carbon black (mean 48 nm) but larger than diesel soot (mean 20 nm; La Roccaet al., 2013).
Flame generated soot and carbon black are often used to synthetically contaminate lubricants. It is worth mentioning that the FG particle considered in this study showed a high morphological complexity; we estimate thatnpo=222,via3D
volume divided by the assumed spherical, 25 nm diameter pri-mary particle volume. Typically only 4.5% of the agglomerates sampled from diesel exhaust are composed of more than 200 primary particles (Martoset al., 2017). This raises a question over the use of CB and FG soot as a surrogate for engine soot.
Conclusions
Highly detailed characterization of soot nanoparticles can help to more fully understand soot formation and its health and environmental implications. Due to their size, TEM has been the most widely used method to achieve this. TEM produces 2D projections of soot agglomerates and the lack of depth perception leads to underestimation of commonly measured
morphological parameters. High quality 3D reconstruction of soot agglomerates would eliminate this error. However, 3D study of soot aggregates is in its infancy and a major barrier to the success of the technique is its speed.
Three-dimensional volume reconstruction of flame-generated and soot-in-oil nanoparticles was successfully achieved through the use of bright-field TEM. Optimization of 3D-TEM methods allows for high-throughput soot nanopar-ticles analysis. In comparison to a typical procedure, our op-timized methodology reduced the time required by over 70% and cut beam exposure by two thirds with no appreciable decrease in the quality of the produced 3D model.
WBP and SIRT reconstruction algorithms generated tomo-grams of good quality with no significant difference in mor-phological parameters; the WBP is considerably quicker than the iterative technique. Interpolated segmentation between every 5th slice allowed for a level of accuracy similar to that of full manual segmentation; with a 40% reduction in time.
Flame-generated particle and carbon black under study showed an extensive 3D structure; on the contrary, the diesel soot-in-oil particle was notably 2D, being just a single primary particle thick in the z-direction. Gasoline soot-in-oil structures were generally at least two primary particles thick in the z-direction in some sections of the particle.
Carbon black showed a mean primary particle diameter of 48 nm, whereas gasoline soot was on average typically around 30nm and larger than diesel soot.
Synthetic soot-like agglomerates and their TEM-style tilt se-ries were generated using image processing software ImageJ. These structures were subjected to WBP reconstruction on tilt-series of various compositions. The average elongation factor for 14 synthetic structures was calculated as 0.2% for±80° tilt series and 4% for±60°tilt series. In terms of morphologi-cal properties, volume was significantly overestimated due to the effects of reconstruction artefacts causing over-selection in segmentation. However, values of surface area, radius of gy-ration and fractal dimension were close to the original values (<3% deviation).
Acknowledgements
This work was supported by the Engineering and Physical Sciences Research Council [grant number EP/M506588/1]; through the scholarship provided by EPSRC DTG Centre in Complex Systems and Processes for E. Haffner-Staton, and The University of Nottingham EPSRC Impact Acceleration Account is also acknowledged.
References
Adachi, K., Chung, S.H., Friedrich, H. & Buseck, P.R. (2007) Fractal pa-rameters of individual soot particles determined using electron tomog-raphy: implications for optical properties.J. Geophys. Res-Atmos.112. Agulleiro, J.I. & Fernandez, J.J. (2011) Fast tomographic reconstruction
on multicore computers.Bioinformatics.27, 582–583.
Ali, R.A., Landsberg, M.J., Knauth, E., Morgan, G.P., Marsh, B.J. & Han-kamer, B. (2012) A 3D image filter for parameter-free segmentation of macromolecular structures from electron tomograms.PLoS One.7, e33697.
Antusch, S., Dienwiebel, M., Nold, E., Albers, P., Spicher, U. & Scherge, M. (2010) On the tribochemical action of engine soot.Wear.269, 1–12. Asango, A., La Rocca, A. & Shayler, P. (2014) Investigating the effect of
carbon nanoparticles on the viscosity of lubricant oil from light duty automotive diesel engines. SAE Technical Paper.
Batenburg, K.J., Bals, S., Sijbers, J.,et al. (2009) 3D imaging of nanoma-terials by discrete tomography.Ultramicroscopy.109, 730–740. Batenburg, K.J. & Sijbers, J. (2011) DART: a practical reconstruction
algorithm for discrete tomography.IEEE T. Image Process.20, 2542– 2553.
Bonatesta, F., Chiappetta, E. & La Rocca, A. (2014) Part-load particu-late matter from a GDI engine and the connection with combustion characteristics.Appl. Energ.124, 366–376.
Broday, D.M. & Rosenzweig, R. (2011) Deposition of fractal-like soot ag-gregates in the human respiratory tract.J. Aerosol Sci.42, 372–386. Cabi´e, M., Gailhanou, M. & Ferry, D. (2016) Electron tomography:
influ-ence of defocus on the determination of reconstructed soot aggregates’ surface and volume. InEuropean Microscopy Congress 2016: Proceedings. Wiley Online Library. https://doi.org/10.1002/9783527808465 Chinas-Castillo, F. & Spikes, H.A. (2004) The behavior of diluted sooted
oils in lubricated contacts.Tribol. Lett.16, 317–322.
Clague, A.D.H., Donnet, J., Wang, T.K. & Peng, J.C.M. (1999) A compari-son of diesel engine soot with carbon black.Carbon.37, 1553–1565. Devlin, C.C., Passut, C., Campbell, R. & Jao, T.-C. (2008) Biodiesel fuel
effect on diesel engine lubrication. SAE Technical Paper.
Dobbins, R.A. & Megaridis, C.M. (1987) Morphology of Flame-Generated Soot as Determined by Thermophoretic Sampling.Langmuir.3, 254– 259.
Doube, M., Klosowski, M.M., Arganda-Carreras, I.,et al. (2010) BoneJ Free and extensible bone image analysis in ImageJ.Bone.47, 1076–1079. Fernandez, J.J. (2012) Computational methods for electron tomography.
Micron.43, 1010–1030.
Fernandez, J.J. (2013) Computational methods for materials characteri-zation by electron tomography.Curr. Opin. Solid St. M.17, 93–106. Frank, J. (2008)Electron Tomography: Methods for Three-Dimensional
Visu-alization of Structures in the Cell, Springer, New York.
Friedrich, H., Guo, S.J., de Jongh, P.E., Pan, X.L., Bao, X.H. & de Jong, K.P. (2011) A quantitative electron tomography study of ruthenium particles on the interior and exterior surfaces of carbon nanotubes.
Chemsuschem.4, 957–963.
George, S., Balla, S., Gautam, V. & Gautam, M. (2007) Effect of diesel soot on lubricant oil viscosity.Tribol. Int.40, 809–818.
Green, D.A. & Lewis, R. (2007) Effect of soot on oil properties and wear of engine components.J. Phys. D Appl. Phys.40, 5488–5501.
Green, D.A. & Lewis, R. (2008) The effects of soot-contaminated engine oil on wear and friction: a review.P I Mech. Eng. D-J Aut.222, 1669– 1689.
Green, D.A., Lewis, R. & Dwyer-Joyce, R.S. (2006) Wear effects and mech-anisms of soot-contaminated automotive lubricants.P I Mech. Eng. J-J Eng.220, 159–169.
Gwaze, P., Schmid, O., Annegarn, H.J., Andreae, M.O., Huth, J. & Helas, G. (2006) Comparison of three methods of fractal analysis applied to soot aggregates from wood combustion.J. Aerosol Sci.37, 820–838. Hawkes, P.W. (2006) The Electron Microscope as a Structure Projector.
In:Electron Tomography: Methods for Three-Dimensional Visualization of Structures in the Cell(ed. J. Frank). Springer, New York, NY.
Heywood, J.B. (1988)Internal combustion engine fundamentals, McGraw Hill, New York.
Hu, E., Hu, X., Liu, T., Fang, L., Dearn, K.D. & Xu, H. (2013) The role of soot particles in the tribological behavior of engine lubricating oils.
Wear.304, 152–161.
Ishiguro, T., Takatori, Y. & Akihama, K. (1997) Microstructure of diesel soot particles probed by electron microscopy: first observation of inner core and outer shell.Combust. Flame.108, 231–234.
Kajino, M. & Kondo, Y. (2011) EMTACS: Development and regional-scale simulation of a size, chemical, mixing type, and soot shape resolved atmospheric particle model.J. Geophys. Res. Atmos.116.
Khalizov, A.F., Xue, H.X., Wang, L., Zheng, J. & Zhang, R.Y. (2009) En-hanced light absorption and scattering by carbon soot aerosol internally mixed with sulfuric acid.J. Phys. Chem A.113, 1066–1074.
Kittelson, D.B., Ambs, J.L. & Hadjkacem, H. (1990) Particulate emissions from diesel engines: influence of in-cylinder surface. SAE Technical Paper.
Koylu, U.O., Faeth, G.M., Farias, T.L. & Carvalho, M.G. (1995) Fractal and projected structure properties of soot aggregates.Combust Flame.100, 621–633.
Koylu, U.O., McEnally, C.S., Rosner, D.E. & Pfefferle, L.D. (1997) Si-multaneous measurements of soot volume fraction and particle size/microstructure in flames using a thermophoretic sampling tech-nique.Combust. Flame.110, 494–507.
Kremer, J.R., Mastronarde, D.N. & McIntosh, J.R. (1996) Computer visu-alization of three-dimensional image data using IMOD.J. Struct. Biol.
116, 71–76.
La Rocca, A., Bonatesta, F., Fay, M.W. & Campanella, F. (2015) Char-acterisation of soot in oil from a gasoline direct injection engine using Transmission Electron Microscopy.Tribol. Int.86, 77–84.
La Rocca, A., Campbell, J., Fay, M.W. & Orhan, O. (2016) Soot-in-oil 3D volume reconstruction through the use of electron tomography: an introductory study.Tribol Lett.61, 8.
La Rocca, A., Di Liberto, G., Shayler, P., Parmenter, C. & Fay, M. (2014a) A novel diagnostics tool for measuring soot agglomerates size distribution in used automotive lubricant oils.SAE Intl.J. Fuels Lubricants.7, 301– 306.
La Rocca, A., Di Liberto, G., Shayler, P.J. & Fay, M.W. (2013) The nanos-tructure of soot-in-oil particles and agglomerates from an automotive diesel engine.Tribol. Int.61, 80–87.
La Rocca, A., Di Liberto, G., Shayler, P.J., Parmenter, C.D.J. & Fay, M.W. (2014b) Application of nanoparticle tracking analysis platform for the measurement of soot-in-oil agglomerates from automotive engines. Tri-bol. Int.70, 142–147.
Lapuerta, M., Ballesteros, R. & Martos, F.J. (2006) A method to determine the fractal dimension of diesel soot agglomerates.J. Colloid Interf. Sci.