“ROLE OF DYNAMIC MRI IN REPLACING THE
ISOTOPE RENOGRAM IN THE FUNCTIONAL
EVALUATION OF PUJO”
Dissertation submitted for
M.D. DEGREE EXAMINATION
BRANCH VIII – RADIODIAGNOSIS
MADRAS MEDICAL COLLEGE
AND
GOVERNMENT GENERAL HOSPITAL
CHENNAI – 600 003
THE TAMIL NADU DR.M.G.R MEDICAL UNIVERSITY CHENNAI – 600 032
Prof. J. MOHANASUNDARAM,M.D., D.N.B Ph.D.,
CERTIFICATE
This is to certify that Dr. V.SIVA KUMAR has been a post graduate student during the period April 2008 to April 2011 at Barnard Institute of Radiology, Madras Medical College, Government General Hospital, Chennai.
This Dissertation titled “ROLE OF DYNAMIC MRI IN REPLACING THE ISOTOPE RENOGRAM IN THE FUNCTIONAL EVALUATION OF PUJO” is a bonafide work done by him during the study period and is being submitted to the Tamilnadu Dr. M.G.R. Medical University in partial fulfillment of the M.D. Branch VIII Radiodiagnosis Examination
PROF.K.VANITHAM.D.,D.M.R.D., D.R.M.,
DIRECTOR,
BARNARD INSTITUTE OF RADIOLOGY
MADRAS MEDICAL COLLEGE & GOVERNMENT GENERAL HOSPITAL CHENNAI - 600 003.
PROF.N.KAILASANATHANM.D.,D.M.R.D.,
HEAD OF THE DEPARTMENT, BARNARD INSTITUTE OF RADIOLOGY
DECLARATION
I Dr.V.SIVA KUMAR, solemnly declare that this dissertation entitled, “ROLE OF DYNAMIC MRI IN REPLACING THE ISOTOPE RENOGRAM IN THE FUNCTIONAL EVALUATION OF PUJO” is a bonafide work done by me at the Barnard Institute of Radiology, Madras Medical College and Government General Hospital during the period 2008 – 2010 under the guidance and supervision of the Director, Barnard Institute of Radiology of Madras Medical College and Government General Hospital, Professor K.VANITHA,M.D., D.M.R.D. D.R.M., This dissertation is submitted to The Tamil Nadu Dr. M.G.R Medical University, towards partial fulfillment of requirement for the award ofM.D. Degree Radiodiagnosis.
Place : Chennai Date: 30.11.10
ACKNOWLEDGEMENTS
I would like to thank Prof. J. MOHANASUNDARAM, M.D., D.N.B. Ph.D., Dean, Madras Medical College, Government General Hospital,
Chennai, for giving me permission to conduct the study in this institution.
With extreme gratefulness, I express my indebtedness to
Prof. K. VANITHA, M.D., D.M.R.D., D.R.M., Director, Barnard Institute of
Radiology, for having encouraged me to take up this study. But for her
guiding spirit, perseverance and wisdom, this study would not have been
possible.
I express my sincere thanks and gratitude to Prof. T.S. SWAMINATHAN, M.D., D.M.R.D., F.I.C.R., Prof. N. KULASEKERAN, M.D., D.M.R.D.,Prof. M. PRABAKARAN,M.D., D.M.R.D., Former Directors, Barnard
Institute of Radiology for their immense kindness, constant support and
consistent encouragement in conducting this study.
I am deeply indebted to my H.O.D, Prof. N. KAILASANATHAN,
M.D., D.M.R.D., whose help, stimulating suggestions and encouragement helped
me in the research and writing of this thesis.
I wish to thank Prof. K.MALATHY, M.D.,D.M.R.D.,
Prof. A.P. ANNADURAI, M.D., D.M.R.D., and Prof. K. THAYALAN for
I am greatly indebted to my assistant professors
Dr.S.SUNDARESWARAN, D.M.R.D., Dr.S.KALPANA, M.D., D.M.R.D., D.N.B.,
Dr. S. BABU PETER, M.D.R.D., D.N.B., Dr. D. RAMESH, M.D.R.D.,
Dr.C.AMARNATH, M.D.,D.N.B.,F.R.C.R., Dr.J.DEVIMEENAL,M.D., D.M.R.D., D.N.B., Dr. MANIMEKALA, M.D.R.D., and fellow postgraduates for their
untiring help.
Last but not the least; I thank all my patients for their cooperation,
DISSERTATION
Sl.
No CONTENTS Page No.
1. Introduction 1
2. Aim and Objectives 3
3. Review of Literature 4
4.
Functional Imaging of Pelvi –Ureteric Junction Obstruction
23
5. Materials & Methods 26
6. Observation & Results 34
7. Discussion 46
8. Conclusion 50
9. Bibliography 10. Annexures
INTRODUCTION
Pelviureteric Junction obstruction is one of the most common cause of Hydronephrosis and continues to present a challenge to Radiologists and Urologists, who are unable to accurately predict which patient will benefit from surgery (1). Traditional imaging tests have emphasized detection and grading of Hydronephrosis with Sonography and determination of Renal function and obstruction with Scintigraphy. The classification of the kidney as obstructed does not predict progressive loss of function and does not identify which patient will benefit from surgery(2).
As a result of this variable outcome, Management of Pelvi – Ureteric Junction Obstruction is controversial, with some authors recommending early surgery and others advocating simple observation(3).
Most surgeons monitor Hydronephrotic kidney with Sonography, and use decreasing function or worsening Hydronephrosis as an indicator for surgical intervention. The problem with this approach is that some obstructed kidneys will deteriorate while under observation. It would be better to identify and surgically correct the condition in those patient before Nephron loss occurs.
AIM & OBJECTIVES
The aim of this study is to
To find out the Extent of obstruction in Pelvi – Ureteric Junction Obstruction.
To find out the functional potential of the Hydronephrotic Kidney.
REVIEW OF LITERATURE
MRI of the Hydronephrotic system has been reported in several animal studies as well as smaller human studies (10) .Wen et al used Gd-DTPA enhanced MRI in rats, and believed that it provided the necessary information to distinguish between an obstructed and non obstructed collecting system(10).
Rodriguez et al reported on 3 patients with Pelvi – Ureteric Junction Obstruction evaluated by MRI and recommended it as an alternative to the combination of studies currently used to evaluate Hydronephrosis. (11).
Marcos R. Perez –Brayfield, J. Damien Grattan – smith (12). reported, the largest series to date using MR Urography in the evaluation of Hydronephrosis in children. In this series of 96 patients, MR Urography accurately defined anatomical detail and differential renal function in a single study without Ionizing Radiation. The calculation of relative renal function by MR Urography revealed excellent correlation with Renal Scintigraphy (r2=0.83).
injection of Iopromide with that of Gd-DTPA enhanced MRI. He found good correlation between the method. Pearsons correlation coefficient was r =0.86, S.D. was 14.8 ml/mt.
Tarek A. El-Diasty, Abou EL. Ghas (14) from Egypt, has conducted, a study, involving 46 patients with symptomatic Pelvi – Ureteric Junction Obstruction. They found that the mean MR clearance of the obstructed unit was 32.8 ml/mt while, the Radio Isotope clearance was 31.6 ml/mt and there was a strong correlation between them (r=0.82, P <0.001). Time intensity curves plotted for dynamic MRI and Diuretic Renography gave similar results for the diagnosis of obstruction.
Rohrscheneider 15 et al from Germany, has studied 62 patients of Hydronephrosis with MRI. He has quoted that Image quality is good or excellent in 95% of cases. For split Renal function, DMRI and DRS showed significant correlation (r = 0.92 , P < .001). For urinary excretion, MR Renography & DRS showed strong agreement (k=0.67).
PUJO
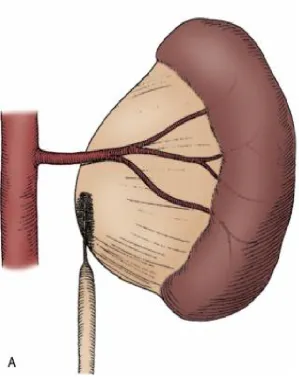
Congenital UPJ obstruction most often results from intrinsic disease. A frequently found defect is the presence of an aperistaltic segment of the ureter.In these cases, histopathologic studies reveal that the spiral musculature normally present has been replaced by abnormal longitudinal muscle bundles or fibrous tissue.This results in failure to develop a normal peristaltic wave for propagation of urine from the renal pelvis to the ureter.
Recognition that this type of segmental defect is often responsible for UPJ obstruction is of utmost importance clinically because such ureters may appear grossly normal at the time of surgery, and, in fact, may often be calibrated to 14 Fr or greater.
Such congenital ureteral strictures are most frequently found at the UPJ, although they may be located at sites anywhere along the lumbar ureter. Abnormalities of Ureteral musculature have been implicated as electron microscopy has demonstrated excessive collagen deposition at the site of the stricture .
Significant controversy persists regarding the potential role of “aberrant” vessels in the etiology of UPJ obstruction. Significant crossing vessels have been noted in as many as 40% of cases of UPJ obstruction but as little as 20% of cases of normal kidneys.In fact, the true etiology is an intrinsic lesion at the UPJ or proximal ureter that causes dilatation and ballooning of the renal pelvis over the polar or aberrant vessel.
UPJ obstruction, although most often a congenital problem, can present clinically at any time of life. In older children or adults,
intermittent abdominal or flank pain, at times associated with nausea or vomiting, is a frequent presenting symptom. Hematuria, either
spontaneous or associated with otherwise relatively minor trauma, may also be an initial symptom.
Radiographic studies should be performed with a goal of determining both the anatomic site and the functional significance of an apparent obstruction. Excretory urography remains a reasonable first-line option for radiographic diagnosis. Classically, findings on the affected side include delay in function associated with a dilated pelvicalyceal symptom . If the ureter is visualized, it should be of normal caliber. In some patients, symptoms may be intermittent and intravenous pyelography between painful episodes may be normal. In such cases, the study should be repeated during an acute episode when the patient is symptomatic.
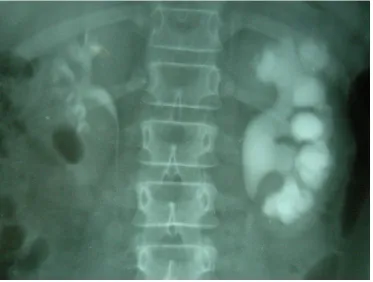
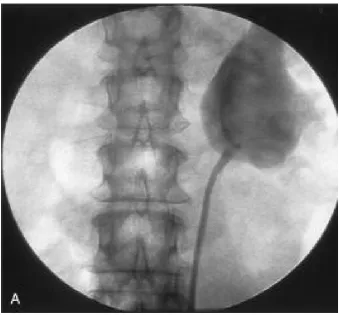
Figure 2 - IVU Showing Lt PUJO
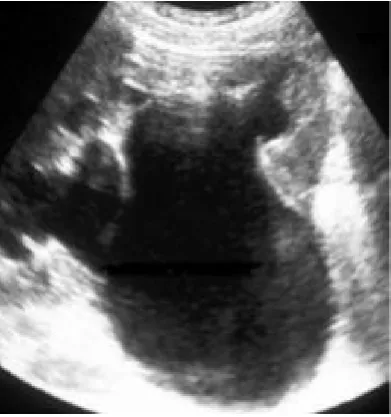
Figure 3 - USG Showing Lt HN Rt HN
R
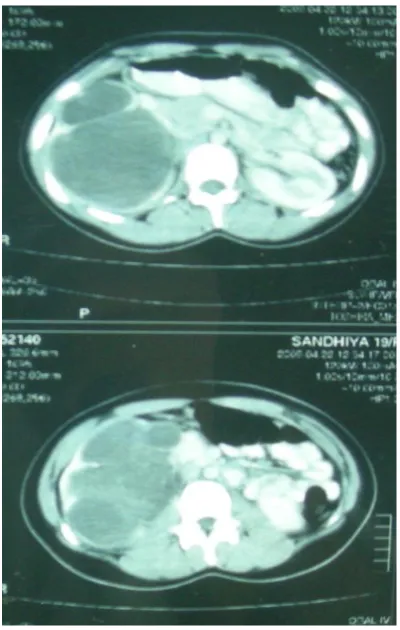
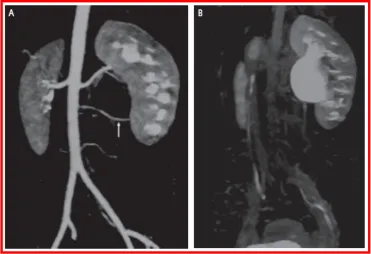
Figure 5 - Reconstructed Image of Rt PUJO
ureteral obstruction, because it provides quantitative data regarding differential renal function and obstruction, even in hydronephrotic renal units. Diuretic renography is noninvasive and readily available in most medical centers. It ideally can be used to follow patients for functional loss, but it is most effective when a standard protocol is used.
The diuretic is given 20 minutes into the study to allow time for filling of the collecting system. One study found diuretic renography to be useful in children to rule out concomitant UPJ obstruction with associated high-grade reflux , Stauss et al, 2003. There is evidence that the diuretic renography using 99mTc-MAG3 is a most accurate study for patients with UPJ obstruction
Retrograde pyelography thus retains a role for confirmation of the diagnosis and for demonstration of the exact site and nature of obstruction before repair. In most cases this study is performed at the time of the planned operative intervention to avoid the risk of introducing infection in the face of obstruction.
This allows the performance of antegrade studies that will help define the nature and exact anatomic site of obstruction. It also allows decompression of the system in cases of associated infection or compromised renal function and allows assessment of recoverability of renal function after decompression. When there remains some doubt as to the clinical significance of a dilated collecting system, placement of a percutaneous nephrostomy tube allows access for dynamic pressure perfusion studies.
Much like the work that was done to define the utility of nuclear renography in the evaluation of PUJO , MRI renography is being investigated to define urinary tract anatomy, calculate differential renal function, and assess urinary tract obstruction , Grattan-Smith et al, 2003 . In comparison with ultrasonography and nuclear renography, dynamic contrast enhanced MRI is superior . The differential renal function, as determined by calculating the volume of enhancing renal parenchyma, is comparable to that determined by nuclear renography. When assessing the utility of each modality, as determined by the decision to proceed with surgery or not, MR renography has been shown to be as sensitive, more specific, and of greater diagnostic efficiency than renal scintigraphy. Because there is no absolute test that exists to define obstruction precisely, the surgery itself becomes the endpoint, Grattan-Smith et al, 2003 .
Further refinements in dynamic contrast material enhanced MR renography include the calculation of renal transit time . This calculation complements the determination of differential renal function.
obstruction. MRI does not involve ionizing radiation so that multiple follow-up studies can be performed to monitor hydronephrosis. This must be balanced with the higher expense, need for sedation, and higher frequency of adverse reactions to the contrast agent. Further refinements in the technique and more widespread application to other centers will be forthcoming.
Figure 8 - Gadodiamide enhanced MRU shows mild Lt hydronephrosis with a filling defect at the PUJ secondary to a
crossing vessel
[image:28.595.116.488.444.698.2]Contemporary indications for intervention for UPJ obstruction include the presence of symptoms associated with the obstruction, impairment of overall renal function or progressive impairment of ipsilateral function, development of stones or infection, or, rarely, causal hypertension.
The primary goal of intervention is relief of symptoms and preservation or improvement of renal function. Traditionally, such intervention should be a reconstructive procedure aimed at restoring nonobstructed urinary flow. This is especially true for neonates, infants, or children in whom early repair is desirable, because these patients will have the best chance for improvement in renal function after relief of obstruction , Bejjani and Belman, 1982 . However, timing of the repair in neonates remains controversial.
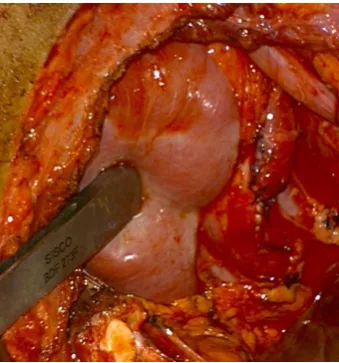
Figure 10 - Per OP Pictures showing Thinned out cortex
[image:30.595.109.502.85.285.2]Figure 11 - Nephrectomy Picture
[image:30.595.337.507.547.729.2]FUNCTIONAL IMAGING OF PUJO
Imaging of Pelvi – Ureteric Junction Obstruction includes Renal USG, IVU, Diuretic Renal Scintigraphy, and Retrograde Ureteropyelography. Newer methods eg. Multiphasic helical CT and Endoluminal USG have also been used for detecting the cause of obstruction by identifying adjacent anatomy(17).
The whitaker test is often considered the reference test for detecting and grading obstruction, but this invasive test is infrequently performed, provides no information on renal function , lacks objective criteria, and uses nonphysiologic flow rates (18).
The principal limitations of DRS are that it relies on projection images, that it provides limited anatomic assessment of the urinary tract, and that it needs depth correction of counts and background subtraction.
The advantages of MRI over other Radiological techniques are : high soft tissue characterisation, capability of direct multiplanar and three dimensional reformatting, use of Non-Ionizing Radiation and a non nephrotoxic contrast medium .
MATERIALS AND METHODS
Title of study
Role of Dynamic MRI in replacing Isotope Renogram in the functional evaluation of Pelvi – Ureteric Junction Obstruction.
Period of Study
May 2008 – May 2010
Type of Study
Prospective Study
Source of patients
Patients with PUJO, who presented to the Department of Urology, Madras Medical College, Government General Hospital, Chennai.
Patient Selection
Inclusion Criteria
All those patients diagnosed to have Pelvi – Ureteric Junction Obstruction based on USG, IVU, CT.
The Institutional review board at our hospital approved the study and informed consent was obtained from all the patients. All these patients were investigated with Isotope Renogram and subsequently, subjected to Dynamic MRI.
Exclusion criteria
Patients with structural defects like Duplex system, Horse – shoe kidney.
Patients with B/L PUJO.
Previous surgery.
Patients with Pacemaker & Metallic Implants.
Claustrophobic patients.
Patient preparation
No specific preparation
Patient position
Imaging Examination
Isotope Renogram
DRS was performed and results evaluated according to current recommendations (4) Scintigraphy followed by IV injection of 12 µci / kg Technetium – 99m MAG-3, with a minimum activity of 150 µci. A
large field of view gamma camera equipped with a low energy all purpose collimator was used. The window was placed over the photo peak of the tracer and was opened by 20%. A 128 x 128 image matrix was used. Data were collected in 12 second time frames.
The scintigraphic examination lasted 40 minutes and furosemide was administered along with the tracer (F+0) . ROIS were placed by an
experienced technician who prepares the imaging material for medical evaluation. Rectangular background ROIs near the upper & lower pole were automatically selected by the system software and manually corrected, if necessary.
Time activity curves were generated from the background corrected count rates.
MR Imaging
All MRI was conducted on a 1.5T Siemens scanner, with the use of a phased- array torso surface coil. The procedure started by obtaining a coronal localizer (scout image) to identify the abdominal aorta and the origins of the renal arteries, followed by a coronal T2 weighted sequence for the whole of both kidneys and six coronal fast spoiled gradient (FSPGR) images at the centre of the kidney.
Then, dynamic MRI was performed by IV injection with 0.1 mmol / kg gadodiamide (Gd- DTPA) at 3 ml/sec and the coronal scan series was repeated every 30 sec for 5 minutes. The total amount of contrast was 20-30ml according to body weight.
Finally, Excretory MR Renography was performed using contrast enhanced T1 weighted 3 D- FSPGR acquisition at 7-10 min after
gadodiamide injection to visualize the collecting system and the ureter
(21)
Maximum intensity projection images were obtained, and using the coronal and saggital MIP images, the anatomy of the pelvicalyceal system and ureter identified.
For DMRI, we started by visually interpreting the images, comparing the series before and after contrast medium, to determine the degree of parenchymal enhancement, and the excretory power of each renal unit.
Image Analysis
Isotope Renogram
The activity and the T ½ of renal signal decay after furosemide administration of each kidney was categoried as being normal, equivocal, or obstructed, with Normal kidney having T ½ of less than 10 minutes, Equivocal kidneys had a T ½ between 10 & 20 minutes, Obstructed kidneys has a T ½ more than 20 minutes. Glomerular filtration rate and split renal function calculated.
MR Images
MR findings were evaluated with regard to the Glomerular filtration rate, the intra Renal Transit time of the contrast material. Time intensity curve is then plotted using in built software.
into the collecting system. This segment is used to calculate the single kidney function (22,23,24). The third segment is characterised by a prompt decline and reflects contrast material elimination from the parenchyma into the collecting system.
For each patient, Renal transit time (20) is used to classify the kidney as being
-Normal : < 245 sec
Equivocal : > 245 - < 490 sec Obstructed : > 490 sec
Visualization of the distal ureter is also noted down.
If there is gross discrepancy between the Isotope Renogram and MR findings, then, to assess the salvageability of that Renal unit, PCN to be done and PCN fluid analysis to be done after 1 month. Planned procedure, Either Pyeloplasty or Nephrectomy to be decided based on salvageability results of PCN fluid analysate.
Surgical findings
Statistical Analysis
Statistical software (SPSS. Version 17) was used to analyse the data. The findings from Isotope Renogram and Dynamic MRI were correlated individually with the surgical finding. The accuracy of Isotope Renogram and Dynamic MRI were individually determined
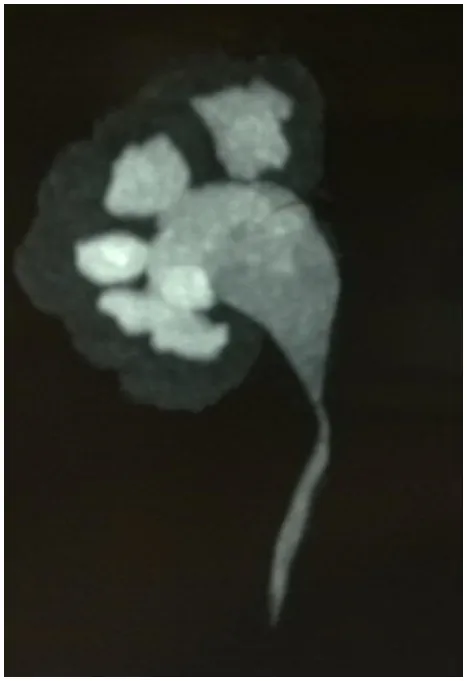
Figure 15 - FUNCTIONAL TISSUE BEING
PLOTTED USING REORIENTED AXIAL
CASE 1
LK : 48 % RK : 52 % RTT : 240 Sec
LK : 45 % RK : 55 % RTT : 260 Sec
[image:49.595.112.507.253.501.2]RK
CASE 2
Figure 21 - PLOTTING ROI TO OBTAIN TIME
INTENSITY CURVE FOR HYDRONEPHROTIC
LK : 36 % RK : 64 %
LK : 34.65 % RK : 65.35 %
[image:52.595.106.500.346.563.2]RK
CASE 3
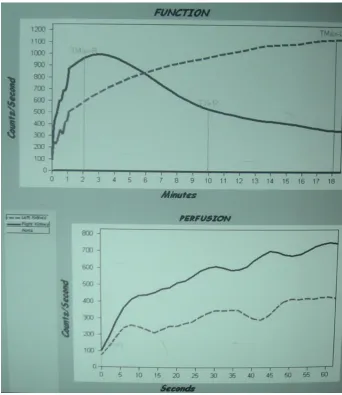
Figure25& 26-ISOTOPE SCAN TIME INTENSITY CURVE
[image:54.595.107.510.151.325.2]DISCREPANCY BETWEEN IMAGES
[image:54.595.118.501.400.637.2]NORMAL
HN
4.58 3.92 9.98 4.01 9.00 3.51 9.57 6.36 11.49 6.72 14.15 6.14 14.98 5.51 16.98 5.84 15.80 5.68 19.37 7.27 19.53 5.07 18.79 4.20 25.65 9.79 19.92 7.93 18.98 9.27 20.44 8.73 16.87 6.49 16.37 5.64 10.70 5.78Figure 28 - FUNCTIONAL TISSUE BEING PLOTTED USING REORIENTED AXIAL IMAGES FOR
NORMAL HN 4.58 3.92 9.98 4.01 9.00 3.51 9.57 6.36 11.49 6.72 14.15 6.14 14.98 5.51 16.98 5.84 15.80 5.68 19.37 7.27 19.53 5.07 18.79 4.20 25.65 9.79 19.92 7.93 18.98 9.27 20.44 8.73 16.87 6.49 16.37 5.64 10.70 5.78
Isotope Renogram
RK LKArea plotted 437.32 334.52 Area under the
Curve 0.7 0.2
218.66 33.45
GFR 87.53 12.47
dMRI
RK LK
[image:56.595.129.472.113.472.2]62 % 38 %
OBSERVATION AND RESULT
Total No of patients studied : 45.
The patients ranged in age from 17 to 45 years, with a mean age of 31.21 years.
Two patients had Pyonephrosis, hence PCN done, one patient had Renal calculus , & hence excluded from our study.
1) Imaging Findings
In all the 42 patients, evaluated with Isotope Renogram, the Intrarenal transit of Radiotracer was calculated. Total GFR calculated and split Renal functions deduced.
Out of the 42 cases, 9 cases were conservatively managed, as they had good split renal function and unobstructed flow pattern in Time intensity curves. These cases are under follow up.
33 cases was taken up for surgical intervention.
and SPGR were taken. ROI was plotted and Time intensity curves obtained with the help of in built software.
2) GFR
GFR Estimation
Mean SD
Isotope Renogram
22.5 4.2
Dynamic MRI
23.8 3.1
3) Accuracy of Imaging compared to surgery
Accuracy of Isotope Renogram compared to surgery
Isotope Renogram
Freq %
Accurate 30 90.9
Non Accurate 3 9.1
Accuracy of Dynamic MRI compared to surgery
Dynamic MRI Freq %
Accurate 31 93.93
No Interpretation 2 6.07
Three patients had discrepancy of GFR between Isotope Renogram and Dynamic MRI. To decide on the surgical modality to be undertaken , PCN was done on that Renal unit. PCN fluid analysis done after 4 weeks of PCN drainage. All the three patients had poor quality of PCN fluid and these patients were deemed to had irreparable renal tubular damage and hence, surgical decision to proceed with Laparascopic Nephrectomy was planned. Thus, in these cases, Isotope Renogram has over estimated the GFR.
Two patients could not be evaluated using MRI one due to motion artifact, one due to incidental stone.No information was obtained for the same.
4) Surgical Approach
Surgical procedure
Freq %
Pyeloplasty 21 63.63
Nephrectomy 12 36.36
5) Surgical approach intended in relation to the GFR estimated using
Isotope Renogram.
Surgical Approach planned Mean SD
Pyeloplasty 33.5 3.8
Nephrectomy 11 2.1
Surgical approach intended in relation in the GFR estimation
by Dynamic MRI.
Surgical Approach planned
Mean SD
Pyeloplasty 35.4 5.2
Nephrectomy 10.8 2.4
6)
Renal Transit time
Isotope
Renogram
Dynamic MRI
< 245 sec 7 7
245 – 490 2 2
> 490 sec 33 33
7)
Visualisation of Distal ureter
D.MRI
Visualised 22
Not visualized 11
Sensitivity 66%
The ureter distal to the obstruction was well visualized in 22 out of 33 patients in MR imaging. This obviates the role of Bulbureterogram to look for patency or to rule out the double obstruction.
8)
Accuracy of Imaging
Isotope Renogram
+ve -ve
+ve 30 1
MRI
-ve 0 2
33
Sensitivity : 100%
Specificity : 66%
Positive predictive value : 96.7% Negative Predictive value : 100%
Proposed Procedure Imaging
Pyeloplasty Nephrectomy
X2 pValue Isotope
Renogram
24 9 0.629 0.4279
D. MRI 20 11 0.000 1.000
Dynamic MRI was able to pick up the functional status of the Renal unit accurately. Dynamic MRI had no false positivity, with 20 patients of 21, deemed for Pyeloplasty and 11 of 12, deemed for Nephrectomy. Correlating with the surgery, the DMRI had a X2.0.000,
with p Value 1.000, having no statistical significance for the difference compared with surgery.
Isotope Renogram has a p value of 0.4279 with respect to surgery, again showing no statistical significance for the difference in number.
Chi-Square Tests
21.290b 1 .000
11.191 1 .001
11.271 1 .001
.006 .006
20.645 1 .000
33 Pearson Chi-Square
Continuity Correctiona
Likelihood Ratio
Fisher's Exact Test Linear-by-Linear Association N of Valid Cases
Value df Asymp. Sig. (2-sided) Exact Sig. (2-sided) Exact Sig. (1-sided)
Computed only for a 2x2 table a.
3 cells (75.0%) have expected count less than 5. The minimum expected count is . 18.
1 - Specificity
1.0 0.8 0.6 0.4 0.2 0.0 Sensiti vity 1.0 0.8 0.6 0.4 0.2 0.0ROC Curve
Diagonal segments are produced by ties.
Area Under the Curve
Test Result Variable(s): MRI
.833 Area
The test result variable(s): MRI has at least one tie between the positive actual state group and the
SURGICAL APPROACH INTENDED IN RELATION
TO THE GFR ESTIMATED BY ISOTOPE RENOGRAM
PER
CENTAGE
STATISTICAL ANALYSIS
0
10
20
30
40
50
60
70
80
90
100
DISCUSSION
Standardised protocols for obtaining Dynamic Radionuclide studies have been proposed (4.5) However, in practice, local protocols are often followed which causes problems in the comparison of results between different centers. Even the details of how these
[ DRF, t ½, Time to peak activity] parameters are calculated can affect the classification of the drainage pattern (6).
Despite its widespread use, Diuretic Renal scintigraphy is not a Reference standard for the diagnosis of obstruction, since the presence or absence of obstruction cannot be distinguished with this modality in atleast 15% of dilated system(7,8).
Additionally, operator variability in the determination of regions of interest can affect the accuracy of the differential Renal function (7,25)
In this study, we calculated the volume of enhancing renal parenchyma and used this value to estimate split Renal function. The calculation of relative renal function by MR renography revealed excellent correlation with Renal scintigraphy (r2=0.93).
The vivid contrast enhancement of the renal parenchyma enabled us to separate kidney from background even in cases of relatively poor renal function and to differentiate renal parenchyma from a dilated collecting system. Differences between the MR renography and nuclear estimation of split renal function occurred in cases with significant parenchyma loss or massive dilatation of collecting system.
Pressure flow studies are reserved for patients with equivocal evidence of obstruction or when the aforementioned studies fail to show obstruction convincingly.
It is an invasive procedure that requires a renal puncture, general anesthesia, and adapted urodynamic equipment. This makes the test difficult to use in patients who would need serial studies (7).
The advantages of MRI are :
(1) High soft tissue characterisation
(2) Capability of direct multiplanar and three dimensional reformatting.
(3) Use of Non Ionizing Radiation
(4) Non Nephrotoxic contrast medium.
The Disadvantages are :
(i) Motion artifact.
(ii) Cost.
Similar to the report by Rodriguez (11) et al, the cost of MRI in our institution is equivalent to the combined cost of Renal USG & Nuclear scan.
Indications for MRI :
(i) Pregnant conditions.
(ii) Pediatric patients.
(iii) Raised Renal function.
CONCLUSION
Using Dynamic MRI, analysis of Renal function is similar to Renal Scintigraphy, because of superior spatial and contrast resolution. MR Renography may be more sensitive than Renal Scintigraphy in analyzing poorly functioning system. While MR Renography, costs more than renal Scintigraphy, the information obtained is superior to currently used methods. As with other medical technologies the cost will decrease as its use becomes more widespread.
BIBLIOGRAPHY
1. Neste MG, DU Cret RP et al Post operative Diuresis Renography and ultrasound in patients undergoing pyeloplasty : Predictors of surgical outcome. Clin Nucl Med 1993;18:872 – 876
2. MacNeily AE, Maizels M, conway JJ. Does early Pyeloplasty really avert loss of Renal function ? A Retrospective view. J. urol 1993; 150 : 769 – 773
3. Gonzales R, schimke CM, Pelvic–Ureteric Junction Obstruction in Infants and children. Paediat. Clin. North AM. 2001 ; 48 : 1505 – 1517.
4. Conway JJ, Maizels M. The ‘ well tempered’ Diuretic renogram : a standard method to examine the asymptomatic neonate with Hydronephrosis.J. Nucl. Med 1992 ; 33 : 2047 – 2051.
5. O’ Reilly P, Aurell M, Britton K, et al. Consensus on Diuresis Renography for investigating the dilated upper urinary tract. J. Nucl Med 1996 ; 37 : 1872 – 1876.
7. Dacher J, Pfeister C, Thoumas D, et al short comings of diuresis scinigraphy in evaluating urinary obstruction : comparison with pressure flow studies. Paediatr Radiol 1999 ; 29 742 – 747.
8. Peters c. urinary tract obstruction in children. J uro,l 1995 ; 154 : 1874 – 1883.
9. Ryan Pc Maher K, Hurley GD, et al. The whitaker test : Experimental analysis in a canine model of partial ureteric obstruction J. urol 1989 ; 141 : 387 – 394.
10. Wen, J.G, Chen, y; Ringgard S etal Evaluation of Renal function in normal and Hydroneprotic kidneys in rats using Gd- DTPA enhanced dynamic magnetic Resonance Imaging. J urol 2000 ; 163 : 1264.
11. Rodriguez, L.V., spielman, D. etal. Magnetic Resonance imaging for the evaluation of Hydronephrosis. J. urol 2001; 160 : 1023.
13. Nils Hackstein, Jan Heckrodt, Wigbert S. Rav. J. Magnet. Reson Imag 2003 ; 18 : 714 – 725.
14. Ahmed R. E1-Nahas, Abou EL – Ghas, Tarek A. EL Diasty etal. MRI in the evaluation of Pelvic –Ureteric Junction Obstruction an all in one approach. BJUI 2007 ; 99 : 641 – 645.
15. Wiltrud K. Rohrschneider, Satine Hanfe, Manfred wiesel, Jochen Troger et al. Radiology 2002 ; 224 : 683 – 694.
16. Benjamin B. Mc Daniel, Richard A. Jones, J. Damien Grattan simth et al Dynamic Contract entranced MR urography in the evaluation of Pediatric Pelvi –Ureteric Junction Obstruction AJR 2005 ; 185 : 1608 – 1614.
17. Wolf JS Jr. Siegel CL, Clayman RV Imaging for Pelvic -Ureteric Junction Obstruction. J. Endourol 1996 ; 10 : 93 – 104.
19. Taylor J, Summers PE, keevis SF etal, Magnetic Resonance Renography ; optimization of pulse sequence parameters & Gd – DTPA dose. Magn Reson Imaging 1997 ; 15 : 637 – 649.
20. Jones RA, peres – Brayfield MR, Kirsch AJ, Grattan smith JD. Renal Transit time with MR urography in children. Radiology 2004 ; 233 ; 41 – 50.
21. EL – Diasty , EL –Ghar ME, shokeir AA et al. MRI as a sole method for the morphological and functional evaluation of live kidney donors. BJUI 2005 ; 96 : 111 – 116.
22. Rohrschneider WR, Becker K, Hoffend J, et al combined static dynamic MR Urography for the simultaneous evaluation of morphology and function in urinary tract obstruction – II Paediatr Radiol 2000 ; 30 : 523 – 532.
24. Brown SCW. Nuclear medicine in the clinical diagnosis and treatment of obstructive uropathy Edinburgh, Scotland : Churchill Livingstone, 1998 ; 291 – 313.
25. Rossleigh, MA Renal cortical scintigraphy and diuresis Renography in Infants and children J. Nucl Med 2001 ; 42 : 91.
ROLE OF DYNAMIC MRI IN REPLACING ISOTOPE RENOGRAM IN THE FUNCTIONAL EVALUATION OF PUJO
PROFORMA
Name : Age/Sex :
Address : Phone No : MRD No :
Clinical History :
a :Pain - Site , Character , Duration , Aggravating & Relieving Factors
b :LUTS
c :Hematuria
d :Fever / Vomiting
Past History :
Comorbid Illness :
General Physical Examination :
Systemic Examination :
DRE :
Blood Investigations :
a.Hemoglobin
b.Packed Cell Volume c.Blood Urea
d.Sr.Creatinine e.Sr.Electrolytes
Urine Investigations :
a.Urine R/E b.Urine C/S X-Ray – KUBU
USG KUB
IVU
Isotope Renogram
Consent
Bowel Preparation
Dynamic MRI
ABBREVIATIONS
PUJO – Pelvi ureteric junction
MRI – Magnetic Resonance Imaging CT – Computed Tomography
IVU – Intravenous Urogram
DRS – Diuretic Renal Scintigraphy
Tc - Technetium
DTPA - Diethylene Triamine Pentaacetic acid MAG - Mercapto Acetyl Tri glycine
GFR – Glomerular Filtration Rate RTT – Renal Transit Time
HUN – Hydroureteronephrosis HN – Hydronephrosis
ROI – Region of Interest
FSPGR - Fast Spoiled Gradient
Master Chart
R.T.T. GFR Visualisation of
Distal ureter. Surgery
S.
No Name Age Sex Isotope
Renogram (sec) DMRI (sec) Isotope Renogram (ml/mt) DMRI (ml/mt Isotope Renogram DMRI
1. Anand 18 M 1320 1300 11 11 - No N
2. Baby 20 F 720 726 29 34 - Yes P
3. Nagabushnam 30 F 205 205 42 42 - - C
4. Nivedha 29 F 660 1200 44 13 - Yes N
5. Anandhan 17 M 1200 1200 10 8 - No N
6. Anitha 36 F 350 380 44 45 - - C
R.T.T. GFR Visualisation of
Distal ureter. Surgery
S.
No Name Age Sex Isotope
Renogram (sec) DMRI (sec) Isotope Renogram (ml/mt) DMRI (ml/mt Isotope Renogram DMRI
9. Soundrapandi 23 M 1080 1080 <5 9 - No N
10. Mallickarjun 22 M 780 774 33 - - Yes P
11. Ranjitham 44 F 1140 1140 9 11 - No N
12. Madhavi 42 F 220 220 42 44 - - C
13. Indumathi 20 F 720 780 36 38 - Yes P
14. Desamma 40 F 840 900 28 32 - Yes P
15. Srinivasan 37 M 1260 1200 12 10 - No N
16. Ponnusamy 31 M 900 840 33 37 - Yes P
R.T.T. GFR Visualisation of
Distal ureter. Surgery
S.
No Name Age Sex Isotope
Renogram (sec) DMRI (sec) Isotope Renogram (ml/mt) DMRI (ml/mt Isotope Renogram DMRI
18. Bharathkumar 30 M 800 810 26 30 - Yes P
19. Dadappan 36 M 960 990 15 11 - No N
20. Balu 37 M 780 720 34 39 - Yes P
21. Ravi 23 M 420 400 44 43 - - C
22. Raja 25 M 780 780 36 38 - Yes P
23. Periyasamy 26 M 840 840 33 35 - Yes P
24. Anbu 45 M 215 215 46 45 - - C
R.T.T. GFR Visualisation of
Distal ureter. Surgery
S.
No Name Age Sex Isotope
Renogram (sec) DMRI (sec) Isotope Renogram (ml/mt) DMRI (ml/mt Isotope Renogram DMRI
27. Prasad 38 M 1200 1140 10 - - No N
28. Chitra 36 F 780 774 35 35 - Yes P
29. Shanmugam 37 M 210 210 46 43 - - C
30. Kala 21 F 780 780 36 38 - Yes P
31. Malliga 32 F 550 600 32 35 - Yes P
32. Krishnaveni 30 F 600 620 32 35 - Yes P
33. Sarangi 40 M 930 950 38 12 - No N
34. Kanniappan 38 M 1080 1080 15 13 - No N
R.T.T. GFR Visualisation of
Distal ureter. Surgery
S.
No Name Age Sex Isotope
Renogram (sec) DMRI (sec) Isotope Renogram (ml/mt) DMRI (ml/mt Isotope Renogram DMRI
36. Shalini 28 F 720 720 34 35 - Yes P
37. Suprabha 37 F 230 230 44 43 - - C
38. Srividhya 20 F 860 890 36 10 - No N
39. Kannan 43 M 760 750 32 35 - Yes P
40. Manimaran 26 M 780 720 34 36 - Yes P
41. Sakthi 40 M 640 620 36 38 - Yes P