Int. J. Electrochem. Sci., 7 (2012) 10952 - 10964
International Journal of
ELECTROCHEMICAL
SCIENCE
www.electrochemsci.orgNew Biosensor for Phenols Compounds Based on Gold
Nanoparticle-Modified PVC/TTF-TCNQ Composite Electrode
Guadalupe Sánchez-Obrero1, Manuel Mayén2, José Miguel Rodríguez-Mellado,
Rafael Rodríguez-Amaro1,*
1
Departamento de Química Física y Termodinámica Aplicada, Universidad de Córdoba, Campus de Rabanales, Edificio C-3, 14014 Córdoba, Spain
2 Departamento de Química Agrícola y Edafología, Universidad de Córdoba, Campus de Rabanales,
Edificio C-3, 14014 Córdoba, Spain
*
E-mail: [email protected]
Received: 6 September 2012 / Accepted: 1 October 2012 / Published: 1 November 2012
A gold nanoparticle-modified PVC/TTF-TCNQ composite electrode with tyrosinase enzyme is proposed as electrochemical biosensor for detecting phenolic compounds in musts and wines samples using phenol and catechol as standards. The work potential was 0 V both in batch and in FIA system (linear range from 0.6 μM up to 10.0 μM), with a detection limit of 7.9 x 10⁻⁷
M for phenol and 6.43 x 10⁻⁷ M for catechol. The good correlation between the results obtained with the biosensor and those achieved with the Folin–Ciocalteu reference method enables that it can be used for rapid and almost automated estimation of the “total phenolics” and “high antioxidant” fraction of must and commercial wines.
Keywords: Poliphenols, Gold nanoparticles, biosensor, Tyrosinase, Flow injection, Wine.
1. INTRODUCTION
In the last years, polyphenolic compounds or “phenolics” have gained enormous attention mainly in the analytical chemistry field, because they have important health properties [1] and antioxidant activity [2-5].
Although several methods based on separation techniques, such as chromatography or capillary electrophoresis with various detection systems [7-10], have demonstrated to be powerful in the identification and separation of phenolics compounds, wine contains a variety of phenolic compounds, commonly called tannis, which cannot be determined singly, so being measured collectively as so-called total polyphenol (TP) index [11].
The Folin–Ciocalteu [FC] spectrofotometric method [12], based on the reaction of phenolic compounds with a colorimetric reagent, is used as reference method and widely recognized, both scientifically and for wineries, although usually produce an overestimation of TP content [6, 13].
Electrochemical biosensors have been proposed as an interesting alternative to existing methods of analysis for the determination of phenolic compounds [14-29], because they offer advantages such as minimal sample preparation, selectivity, sensitivity, reproducibility, fast response time and easy to use continuous analysis [6, 16, 21, 23, 26, 27].
A lot of them are based in the use of the Tyrosinase (polyphenol oxidase) [6, 15, 16-18, 20, 26-28], a copper-containing monooxygenase enzyme that catalyzes the conversion of phenolic substrates to give catechol and o-quinone, as final product, as follows:
phenol + tyrosinase (O2) → catechol (1)
catechol + tyrosinase (O2) → o-quinone +H2O (2)
Later, the resulting o-quinone can be electrochemically reduced at the electrode surface by the following equation:
o-quinone + 2H+ + 2e− → catechol (3)
In this context, PVC/TTF-TCNQ composite electrode has shown good mechanical properties [30] and electrocalytic activity in the oxido-reduction of some analytes of great interest [31-33]. Moreover, modification with gold nanoparticles enhances the intensity current and shifts its redox potential with respect to the non-modified electrode as consequence of facilitate electron transfer between redox proteins and electrode surface [34].
The aim of this work is to propose a new composite-tyrosinase biosensor based on the good electrochemical properties of this modified electrode. The immobilization of the enzyme is accomplished by cross-linking with glutaraldehyde and the biosensor has been used for the estimation of phenolic compounds in different samples of must and red and white wines, via determination of a biolectrochemical index [11, 13] using the basics structures of phenol and catechol as standards.
2. EXPERIMENTAL
2.1. Reagents and solutions
Stock solutions of catechol (Sigma, 99%) and phenol (Sigma, 99.5%) were prepared in 0.05 M phosphate buffer solution (PBS, pH 7.4). More diluted standards were prepared by suitable dilutions with the same phosphate solution. All solutions were prepared freshly.
The solutions used for the immobilization of the enzyme in the biosensor of phenols, was a solution of 91 U µL-1 tyrosinase [Tyr] (Sigma, EC 1.14.18.1 from mushroom sp., 4276 U mg-1) prepared in a 0.05 M phosphate buffer pH 7.4, and a 25% glutaraldehyde solution (Aldrich). The rest of chemicals were purchased in analytical reagent-grade from Merck or Fluka and also used as received.
Aqueous 1% HAuCl4·3H2O solution (Sigma, > 49% as gold) and 1% sodium citrate solution
were used for the preparation of colloidal gold.
All solutions were made in twice-distilled water from a Millipore Milli-Q system (18 mΩ).
2.2. Instrumentation
All electrochemical measurements were made by using an Autolab PSTAT 12 potentiostat using the software package GPES 4.9. A three-electrode cell (10 mL glass electrochemical cell) equipped with a Pt wire counter electrode, a BAS MF-2079 Ag/AgCl 3 M KCl reference electrode, and different PVC/TTF-TCNQ working electrodes, was used. All tests were performed at ambient temperature (ca. 25 ºC).
The UV-Visible spectra of colloidal gold nanoparticles were recorded by using a Cary 100 Bio spectrophotometer equipped with a 1 cm path length cell.
The flow system consists of a Dynamax peristaltic pump model RP-1 (Rainin), a six-way injection valve (Omnifit), PTFE tubes of 0.5 mm inner diameter (Omnifit) and an amperometric detector integrating both the working and counter electrodes. The flow cell was a Metrohm model 6.5303.020 wall-jet cell. The injection volume (sampling loop) was 100 μL.
A Helios Omega UV – vis spectrophotometric (Thermo Scientific) was used to apply the reference spectrophotometric method involving the use of Folin–Ciocalteu reagent.
2.3. Procedure
2.3.1. Preparation of Aucoll
Gold colloids were prepared according to the procedure previously described [34]. After cleaning all the glassware in a bath of freshly prepared 3:1 HNO3-HCl, rinsing thoroughly in
twice-distilled water, and drying in air, 2.5 mL of sodium citrate solution were added to 100 mL of a boiling aqueous solution containing 1 mL 1% (w/w) HAuCl4·3H2O. A stable red colloidal solution was
obtained. The diameter of the Aucoll particles was 16 ± 2.3 nm. Preparations were stored in dark glass
2.3.2. Preparation of the working electrodes
a) The composite electrode without gold was prepared by using the procedure previously described in earlier works [36, 37]. The PVC/TCNQ was obtained at a 1:10 (w/w) ratio of TTF-TCNQ to PVC in DMF. The composite powder was pressed into cylindrical pellets 4 mm in diameter × 2.5 mm thick with an active surface area of 12 mm2
. The pellets were inserted by press-fitting into a Teflon tube furnished with a copper wire to establish electrical contact.
The electrode surface was regenerated as required by polishing with P-1200 emery paper to obtain a flat surface, followed by polishing with glossy paper to obtain a uniform surface and rinsing with water.
b) With respect to gold –modified PVC/TTF-TCNQ/Aucoll composite electrode, it was prepared
as follows: Once polyvinyl chloride is thoroughly dissolved in DMF, the TTF-TCNQ salt is added to obtain a homogeneous PVC/TTF-TCNQ mixture. Subsequently, the suspension was separated, and different volumes of the colloidal gold suspension were added and dried in order to obtain the composite powder. There are reproducibility problems when using biosensors prepared with amounts above 5 mL Aucoll probably due to a lack of homogeneity of the electrode. Therefore, it can be settled a
volume of 5 mL as the most appropriate amount of Aucoll solution to be added to the composite.
Tyr was immobilized onto the composite electrodes by the usual cross-linking with glutaraldehyde [34]. The procedure consisted of coating the composite electrode with 6 L of a 91 units L -1 Tyr solution (c.a. 550 units Tyr). After letting it dry out at ambient temperature, the electrode was immersed in a glutaraldehyde solution for 40 minutes and rinsed with water.
When not in use, the composite electrode was kept in 0.05 M phosphate buffer (pH 7.4) and stored in the refrigerator.
2.3.3. Measurement in wines using the PVC/TTF-TCNQ/Aucoll biosensor
In bath, successive volumes of 20
M phosphate buffer (pH 7.4), which was continuously stirred at a constant rate in the electrochemical cell. Amperometric measurements at 0 V were carried out. The estimation of the phenolic compounds content was performed by extrapolation in a calibration curve with standard solutions of catechol.
For the flow injection analysis (FIA) system, samples of wine and must were diluted in different volumes of 0.05 M phosphate solution at pH 7.4.
2.3.4. Spectrophotometric methods
cells thick. The total phenolic content, expressed in mg L-1 of catechol, was evaluated from the absorbance value by interpolation into the calibration plot obtained with catechol standard solutions.
3. RESULTS AND DISCUSSION
3.1. Cyclic voltammetry responses to poliphenols of the biosensor
Figure 1 shows the cyclic voltammogram (CV) of the catechol obtained at the Tyr-PVC/TTF-TCNQ/Aucoll composite electrode. A well defined reduction peak is observed around 0 V. For phenol
(not shown for clarity) a similar CV is obtained.
E / V
-0,1 0,0 0,1 0,2 0,3 0,4
i / A
-12x10-6
-10x10-6
-8x10⁻⁶
-6x10⁻⁶
-4x10⁻⁶
-2x10⁻⁶
0 2x10⁻⁶
(a) (b)
Figure 1. Cyclic voltammograms obtained at the Tyr-PVC/TTF-TCNQ/Aucoll electrode. (a) 0.2 mM
catechol (b) supporting electrolyte. 10 mV s-1. PBS solution (0.05 M, pH 7.4).
3.2. Chronoamperometric detection of poliphenols 3.2.1. Optimization of variables
The effect of solution pH on the amperometric response of catechol and phenol was investigated over the range of 5.0‒9.0. The steady-state current (data not shown) increases until pH values around 7, which is attributed to the maximum activity presented by the enzyme at these pH values. At pH>7.5 the current decreases sharply, probably due to the involvement of the proton in the electrochemical reaction. Therefore, a 0.05 M phosphate buffer of pH = 7.4 was selected as working medium.
[image:5.596.134.456.277.501.2]
up to 550 units of Tyr. For higher enzyme concentrations, reproducibility problems were observed, which could be due to factors as the saturation of the electrode surface giving a no-homogeneous enzyme distribution, the increase on the electrode resistance, etc. Consequently, the value of 550 units of Tyr was selected for further works.
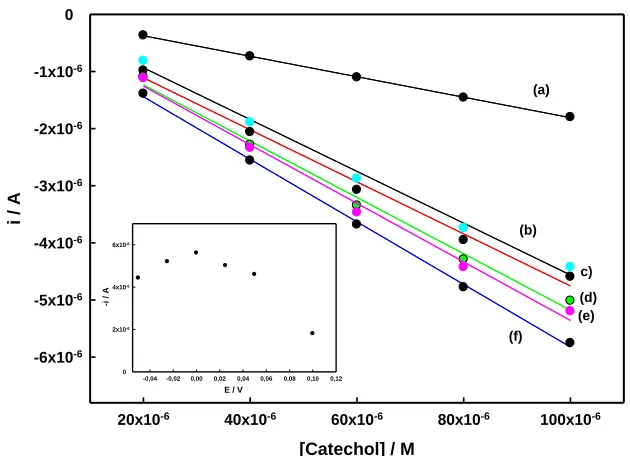
Another parameter of great interest to be determined is the working potential applied to the electrode. In this way, the chronoamperometric response of the poliphenols were recorded at different final potentials Ef after successive additions of poliphenols under stirring conditions, with the
biosensor containing 550 units Tyr.
[Catechol] / M
20x10-6 40x10-6 60x10-6 80x10-6 100x10-6
i / A
-6x10⁻⁶
-5x10⁻⁶
-4x10⁻⁶
-3x10⁻⁶
-2x10⁻⁶
-1x10⁻⁶
0
E / V
-0,04 -0,02 0,00 0,02 0,04 0,06 0,08 0,10 0,12
-i / A
0 2x10⁻⁶ 4x10⁻⁶ 6x10⁻⁶
(a)
(b)
c) (d) (e) (f)
Figure 2. Catechol calibration curves obtained for Tyr-/PVC/TTF-TCNQ/Aucoll composite electrodes.
PBS solution (0.05 M, pH 7.4). The applied potential Ef was a) 0.1 V, b) -0.05 V, c) 0.05 V, d)
0.025 V, e) -0.025 V, f) 0 V. Inset for catechol 1x10⁻⁴ M
Table 1. Analytical characteristics obtained from calibration plots for catechol at different potential values applied to the composite biosensor. PBS solution (0.05 M, pH 7.4)
Potential (Ef)
Slope (mA M-1)
Linear range
(μM) r2
-50 mV 45.3 ± 0.5 0.2 - 10 0.9928
-25 mV 51.2 ± 1.4 0.2 - 10 0.9922
0 mV 54.5 ± 0.6 0.2 - 10 0.9990
25 mV 50 mV 100 mV
49.2 ± 0.4 45.6 ± 0.5 17.8 ± 0.4
0.2 - 10 0.2 - 10 0.2 - 10
0.9916 0.9911 0.9997
[image:6.596.121.436.221.449.2]
3.2.2. Kinetic constants and analytical characteristics
According to above results, 550 units Tyr, 5 mL Au, and 0 V of applied potential can be estimated as rather suitable work conditions.
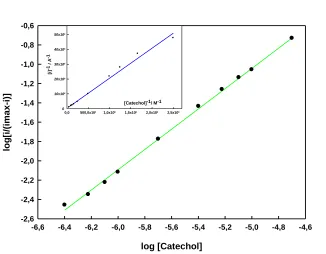
In order to evaluate the applicability of the Michaelis-Menten approach to describe the kinetic behaviour of the proposed biosensor, we have calculated the Hill´s coefficient [35] by fitting the log [i/(imax-i)] versus the log of the substrate concentration. In figure 3 is shown this plot for catechol. The
results obtained were 1.049 and 1.061 for catechol and phenol respectively, that is, close to the theoretical value of unity for the classic Michaelis-Menten equation. Therefore, the apparent Michaelis-Menten constants Kmapp were calculated from the corresponding Linewaver-Burk plots
(inset in Fig. 3, data in table 2). These results are similar to others values reported in the literature [36, 37], and much lower than the free enzyme, 4000 μM [38], thus revealing a good affinity for the substrate of the enzyme immobilized according to the proposed biosensor configuration.
log [Catechol]
-6,6 -6,4 -6,2 -6,0 -5,8 -5,6 -5,4 -5,2 -5,0 -4,8 -4,6
log
[i
/(
imax
-i
)]
-2,6 -2,4 -2,2 -2,0 -1,8 -1,6 -1,4 -1,2 -1,0 -0,8 -0,6
[Catechol]-1/ M-1
0,0 500,0x10³ 1,0x10⁶ 1,5x10⁶ 2,0x10⁶ 2,5x10⁶
[i
]-1
/ A
-1
0 10x106
20x106
30x106
40x106
50x106
Figure 3. log [i/(imax-i)] vs log [Catechol] plot obtained for Tyr-/PVC/TTF-TCNQ/Aucoll composite
electrodes. PBS solution (0.05 M, pH 7.4). The applied potential Ef is 0 V. Inset shows the
corresponding Linewaver-Burk plot.
Table 2. Figures of merit obtained from calibration plots for the two phenolic compounds with the Tyr-/PVC/TTF-TCNQ/Aucoll biosensor.
Analyte Kmapp
(μM)
Limit of detection (M x 107 )
Sensibility (mA M-1)
Linear range (μM)
r2
Phenol 114.0 7.3 62 ± 1.4 0.2 - 10 0.9958
[image:7.596.136.462.298.552.2] [image:7.596.88.511.680.769.2]
Figure 4. Catechol and phenol calibration curves obtained for Tyr-/PVC/TTF-TCNQ/Aucoll composite
electrodes. PBS solution (0.05 M, pH 7.4). The applied potential Ef is 0 V.(a) Catechol (b)
Phenol
Under these experimental conditions we obtained (data in Table 2) for catechol (Fig. 4a) a linear range up to 10 μM, with a sensitivity of 54.5 ± 0.6 mA M–1 and a linear regression coefficient (r) of 0.999. The detection limit (s/n = 3) was 3.53 x 10⁻⁷ M. For phenol (Fig. 4b), the linear range was up to 10 μM, with a sensitivity of 62 ± 1.4 mA M–1, a linear regression coefficient (r) of 0.996 and the detection limit (s/n = 3) was 7.3 x 10⁻⁷ M. These results show that the proposed biosensor is competitive, representing therefore a good and interesting alternative, because there is no need to add any additional substance to the composite mixture to ensure its hardness and conductivity simultaneously. It also has lower cost, as only a small amount of enzyme is needed (just to cover the electrode surface).
3.2.3. Reproducibility
The reproducibility of the biosensor was estimated from the response of the electrode to 10 μM catechol measured at 0 V. We obtained a relative standard deviation (R.S.D.) of 2.2% for five successive determinations by using the same electrode, a R.S.D. of 3.6% when using five different electrodes of the same synthesis and a R.S.D. of 6.5% for five electrodes from different syntheses. These results show a remarkable reproducibility of the proposed biosensor.
3.2.4. Stability of enzyme electrode
We have investigated the long-term stability of the biosensor by recording a daily calibration curve of 10 μM catechol solution, prepared also daily, for one month. During two weeks the biosensor
time / s
0 500 1000 1500 2000 2500 3000
-
i / A
0
100x10-9
200x10-9
300x10-9
400x10-9
500x10-9
600x10-9
700x10-9
[Catechol] / M
0 2x10⁻⁶ 4x10⁻⁶ 6x10⁻⁶ 8x10⁻⁶ 10x10-6
- i
/
A
0 100x10-9
200x10-9
300x10-9
400x10-9
500x10-9
600x10-9
(a)
time / s
0 500 1000 1500 2000
-
i / A
0
200x10-9
400x10-9
600x10-9
[Phenol] / M
0 2x10⁻⁶ 4x10⁻⁶ 6x10⁻⁶ 8x10⁻⁶ 10x10-6
- i / A
0 200x10-9
400x10-9
600x10-9
response was virtually stable. At higher times a continuous decrease in sensitivity and in intensity was observed, thus replacement being recommended from 3-4 weeks. This behaviour is similar to those described in the literature for other tyrosinase sensors [36, 37], being determined by the enzyme stability, since the electrode is easily regenerated.
3.3. Biosensor integration into a FIA system and poliphenols determination
time / s
-i
/
A
0 100x10-9
200x10-9
300x10-9
400x10-9
500x10-9
600x10-9
[Catechol] / M
0 2x10⁻⁶ 4x10⁻⁶ 6x10⁻⁶ 8x10⁻⁶ 10x10-6
I/A
0 100x10-9
200x10-9
300x10-9
400x10-9
(a)
2000 4000 6000 8000
0
time / s
0 2000 4000 6000 8000
-i / A
0 50x10-9
100x10-9
150x10-9
200x10-9
250x10-9
[Phenol] / M
0 2x10⁻⁶ 4x10⁻⁶ 6x10⁻⁶ 8x10⁻⁶ 10x10-6
i / A
0 50x10-9
100x10-9
150x10-9
200x10-9
250x10-9
300x10-9
(b)
[image:9.596.120.459.204.680.2]
Prior to the application in a FIA system, it was examined the influence of hydrodynamic variables such as flow rate and injected volume on the response of the biosensor. The best results in terms of sensitivity and reproducibility were obtained at a flow rate of 1 mL min–1 and an injected volume (sampling loop) of 100 µl. Moreover, the most suitable potential was found to be 0 V for these conditions.
The reproducibility (n=5) was checked on several consecutive injections of a 10 μM catechol solution. A relative standard deviation of 2.7% was obtained, which indicates a good reproducibility and therefore a good mechanical resistance of the biosensor under flowing conditions.
Figure 5 shows the calibration curves obtained for standards of catechol (a) and phenol (b). Three measurements were performed for each standard solution.
For catechol, a sensitivity of 46 ± 1.2 mA M–1 and a linear regression coefficient (r) of 0.997 were obtained for a linear range between 6 x 10⁻⁷ M – 10–5 M. The detection limit (s/n = 3) was 6.4 x 10⁻⁷ M.
For phenol, a sensitivity of 32 ± 0.5 mA M–1 and a linear regression coefficient (r) of 0.996 were obtained for a linear range between 6 x 10⁻⁷ M - 10-5 M. The detection limit (s/n = 3) was 7.3 x 10⁻⁷ M.
These results are in good agreement with those obtained in batch, and involve an interesting improvement when compared to those recently reported on sensor or biosensors applied to FIA systems [23, 26, 27].
3.4. Monitoring of phenolic compounds in wines.
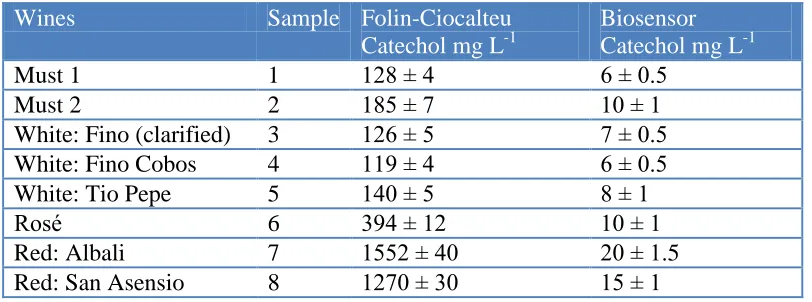
Table 3. Electrochemical poliphenol index (expressed as catechol mg L-1) obtained with the Tyr-PVC/TTF-TCNQ/Aucoll biosensor and comparison with the value obtained using the
Folin-Ciocalteu reference method (n = 5).
Wines Sample Folin-Ciocalteu
Catechol mg L-1
Biosensor Catechol mg L-1
Must 1 1 128 ± 4 6 ± 0.5
Must 2 2 185 ± 7 10 ± 1
White: Fino (clarified) 3 126 ± 5 7 ± 0.5
White: Fino Cobos 4 119 ± 4 6 ± 0.5
White: Tio Pepe 5 140 ± 5 8 ± 1
Rosé 6 394 ± 12 10 ± 1
Red: Albali 7 1552 ± 40 20 ± 1.5
Red: San Asensio 8 1270 ± 30 15 ± 1
[image:10.596.97.503.510.661.2]
Figure 6. Correlation between the results obtained in wines by using the Tyr-PVC/TTF-TCNQ/Aucoll
biosensor and the Folin–Ciocalteu reference method. Insets for white wines and must (left) and red wines (right), separately.
The overall content of phenolic compounds was obtained using catechol as standard (concentration expressed in mg L-1). Table 3 shows the results obtained with the Tyr-PVC/TTF-TCNQ/Aucoll biosensor and their comparison with those obtained using the Folin–Ciocalteu reference
method.The values given correspond to the mean value of five (n = 5) determinations.
The results of the measurements are quite different in values as they are obtained with analytical methods based on different principles. In fact, the Folin–Ciocalteu method consists in a redox reaction of phenols with the phosphomolybdic reagent followed by the colorimetric detection of the resulting products, while the proposed biosensor is based on an enzyme reaction. Consequently, the estimation of phenolic compounds must be considered as a polyphenol index [11, 28] whose absolute value depends on the applied method. Moreover, the electrochemical results also depend on the applied potential [11], such that one can obtain different fractions of their total polyphenolic by changing the oxidation potential. In this way, Mannino et al. [39] have proposed a direct relationship between low oxidation potential and high antioxidant power, so that at 0 V (working potential in this work) we obtain the signal corresponding to the “high antioxidant fraction” [11].
Figure 6 shows the results obtained with the proposed biosensor (bioelectrochemical data) versus the results achieved with the Folin–Ciocalteu method (spectroscopic data). A good correlation was obtained (r = 0.9558) for all different types of must and wines. Moreover, as can be seen in the insets, the correlation is better when the comparison is made for musts and white wines by one hand (r=0.9788), and the red wines by the other (r = 0.9628). This fact seems to be in agreement with the
mg Catechol L-1 (Biosensor)
0 5 10 15 20 25
mg
Cat
echo
l L
-1 (
F o lin) 0 500 1000 1500
mg Catechol L-1 (Biosensor)
6 8 10 12
m g Cat e c ho l L
-1 (
Fo li n) 80 120 160 200
mg Catechol L-1 (Biosensor)
8 12 16 20
m g C at ec h o l L
-1 (
F o li n ) 500 1000 1500
2000 Red wines
different phenol types present in each class of wines [40], and supports the higher antioxidant capacity of red wines.
4. CONCLUSIONS
The PVC/TTF-TCNQ/Aucoll composite electrode has been employed as biosensor for
poliphenols compounds (catechol and phenol) by using tyrosinase enzyme cross-linked with glutaraldehyde. This biosensor can be used both in batch and in a FIA system and shown a good reproducibility and stability. At a working potential of 0 V present a linear range from 0.6 μM up to 10.0 μM, with a detection limit of 7.9 x 10⁻⁷
M for phenol and 6.43 x 10⁻⁷ M for catechol. Moreover, this low working potential value allows to discard possible effects of other interfering species present in solution, such as the ascorbic acid.
The utility of the biosensor was evaluated by performing the estimation of the content of polyphenolic compounds in must and wine samples. A good correlation between the results obtained with the biosensor and those achieved with the Folin–Ciocalteu reference method was obtained. These results are very interesting since the proposed biosensor can be used as a useful tool for rapid and almost automated estimation of the “total phenolics” and “antioxidant power” of must and commercial wines.
ACKNOWLEDGMENTS
The authors wish to acknowledge funding by Spain’s Ministerio de Educación y Ciencia within the framework of Project CTQ2010-15359 and cofunding by FEDER, and Junta de Andalucia (Reseachr group FQM-198).
References
1. M. DellÁgli, A. Buscialá, E. Bosisio, Cardiovascular Research 63 (2004) 593. 2. A. Escarpa, M.C. González, Crit. Rev. Anal. Chem. 31 (2001) 57.
3. M.I. Sabela, N.J. Gumede, P. Singh, K. Bisetty, Int. J. Electrochem. Sci. 7 (2012) 4918. 4. P. Simonetti, P. Pietta, G. Testolin, J. Agric. Food Chem, 45 (1997) 1152.
5. V. Fogliano, V. Verde, G. Randazo, A. Ritieni, J. Agric. Food Chem, 47 (1999) 1035.
6. M. Gamella, S. Campuzano, A.J. Reviejo, J.M. Pingarron, J. Agric. Food Chem, 54 (2006) 7960. 7. S. Pascual-Teresa, C. Santos-Buelga, J.C. Rivas-Gonzalo, J. Agric. Food Chem. 48 (2000) 5331. 8. S. Moane, S. Park, E.C. Lunte, M.R. Smyth, Analyst 123 (1998) 1931.
9. A. Subagio, P. Sari, N. Morita, Phytochem. Anal. 12 (2001) 271.
10. S. Cortacero-Ramirez, M. Hernáinz-Bermúdez de Castro, A. Segura-Carretero, C. Cruces-Blanco, A. Fernández-Gutiérrez, Trends Anal. Chem. 22 (2003) 440.
11. A.J. Blasco, M.C. Rogerio, M.C. González, A. Escarpa, Anal. Chim. Acta 539 (2005) 237. 12. V.L. Singleton, J.A. Rossi, Am. J. Enol. Vitic. 16 (1965) 144.
13. A. Escarpa, M.C. González, Anal. Chim. Acta 427 (2001) 119.
14. L. Campanella, A. Bonanni, E. Finotti, M. Tomasetti, Biosens. Bioelectron. 19 (2004) 641. 15. J.G. Shiller, A.K. Chen, C.C. Liu, Anal. Biochem. 85 (1978) 25.
17. S. Kıralp, L. Toppare, Y. Yağcı, Int. J. Biol. Macromol. 33 (2003) 37. 18. H.G. Xue, Z.Q. Shen, Talanta 57 (2002) 289.
19. S.A.S.S. Gomes, J.M.F. Nogueira, M.F.J. Rebelo, Biosens. Bioelectron. 20 (2004) 1211.
20. K.S. Abhijith, P.V. Kumar, M.A. Kumar, M.S. Thakur, Anal. Bioanal. Chem. 389 (2007) 2227. 21. S. Berend, Z. Grabaric, Arh. Hig. Rada Toksikol. 59 (2008) 205.
22. S. Korkut, B. Keskinler, E. Erhan, Talanta 76 (2008) 1147.
23. M. Di Fusco, C. Tortolini, D. Deriu, F. Mazzei, Talanta 81 (2010) 235.
24. E. Nalewajko-Sieliwoniuk, I. Tarasewicz, A. Kojilo, Anal. Chim. Acta 668 (2010) 19.
25. P. Ibarra-Escutia, J. Juarez Gómez, C. Calas-Blanchard, J.L. Mary, M.T Ramírez- Silva, Talanta 81 (2010) 1636.
26. S.K. Ozoner, M. Yalvac, E. Erhan, Current Applied Physics 10 (2010) 323.
27. M.R. Montereali, L. Della Seta, W. Vastarella, R. Pilloton, J. Mol. Cat. B 64 (2010) 189.
28. V. Carralero Sanz, M.L. Mena, A. González-Cortés, P. Yañez-Sedeño, J.M. Pingarron, J. M. Anal. Chimica Acta, 528 (2005) 1.
29. K. Bisetty, M.I. Sabela, S. Khulu, M. Xhakaza, L. Ramsarup, Int. J. Electrochem. Sci. 6 (2011) 3631.
30. M. Cano, B. Palenzuela, R. Rodríguez-Amaro, Electroanalysis 18 (2006)1727.
31. M. Cano, J. L. Ávila, M. Mayén, M. L. Mena, J. M. Pingarrón, R. Rodríguez-Amaro, J. Electroanal. Chem. 615 (2008) 69.
32. M. Cano, B. Palenzuela, J. L. Ávila, R. Rodríguez-Amaro, Electroanal. 19 (2007) 973. 33. G. Sánchez-Obrero, M. Mayén, J. M. Rodriguez-Mellado, Rafael Rodríguez-Amaro, Int. J.
Electrochem. Sci. 6 (2011) 2001.
34. G. Sánchez-Obrero, M. Cano, J. L. Ávila, M. Mayén, M. L. Mena, J. M. Pingarrón, R. Rodríguez-Amaro, J. Electroanal. Chem. 634 (2009) 59.
35. I.A. Borisov, A.V. Lobanov, A.N. Reshetilov, B.I. Kurganov, Applied Biochemistry and Microbiology 36 (2000) 215.
36. V. Carralero Sanz, M.L. Mena, A. González-Cortés, P. Yañez-Sedeño, J.M. Pingarron, Biosensors and Bioelectronics 22 (2006) 730.
37. S. Liu, J. Yu, H. Ju, J. Electroanal. Chem. 540 (2003) 61.
38. A.E. Böyükbayram, S. Kiralp, L. Toppare, Y. Yagci, Bioelectrochemistry 69 (2006) 164. 39. S. Mannino, O. Brenna, S. Buratti, M.S. Cosio, Electroanalysis 10 (1998) 908.
40. Pedroza, M.A.; Carmona, M.; Rosario Salinas, M.; Zalacain, A. J. Agric. Food Chem. 59 (2011)
10976.