Int. J. Electrochem. Sci., 10 (2015) 1144 - 1168
International Journal of
ELECTROCHEMICAL
SCIENCE
www.electrochemsci.org
Review
Electrochemical and Other Methods for Detection and
Determination of Dissolved Nitrite: A Review
Zhao Yilong1,2,3, Zhao Dean1, Li Daoliang2,3,* 1
School of Electrical and Information Engineering, Jiangsu University, Zhenjiang, 212013, P.R.China 2
Key Laboratory of Agricultural Information Acquisition Technology, Ministry of Agriculture, Beijing 100083, P.R. China
3
Beijing Engineering and Technology Research Center for Internet of Things in Agriculture, Beijing, 100083, P.R. China
*
E-mail: [email protected]
Received: 2 November 2014 / Accepted: 4 December 2014 / Published: 16 December 2014
Nitrite has been widely used in industrial and agricultural production and is ubiquitous in food, water, biology and the environment. However, nitrite is also a toxic inorganic contaminant that is hazardous to the health of humans and other organisms. A variety of strategies have been proposed for detecting and monitoring nitrite in recent years. This article was compiled as a general review of the strategies proposed for nitrite detection, and relevant detection parameters (such as materials, detection limit, detection range, working pH and stability) were tabulated. This article is organized by the type of signal obtained from strategies, including electric and optical signals. Electrochemical methods receive an electric signal from dissolved nitrite, with voltammetric, potentiometric and impedimetric methods included. Methods that receive an optical signal include fluorescence, absorption and Raman spectrometry. Biosensors are proposed as a new detection method. The advantages/disadvantages and limitations of the techniques are discussed. Finally, methods employed to perform nitrite detection are summarized, and their future development is discussed.
Keywords: Dissolved Nitrite Detection, Review, Electrochemistry, Spectrometry, Biosensor
1. INTRODUCTION
Nitrite has been widely used in meat curing [1], food preservatives [2, 3], dyes, bleaches, fertilizers as well as for medicinal purposes [4]. Nitrite can also be converted to the potent vasodilator nitric oxide [5], which is relevant in numerous physiological processes [6].
gastric cancer (GC) [9], spontaneous intrauterine growth restriction [10], abortions [11] and birth defects of the central nervous system [12] have been associated with high nitrite concentrations.
Nitrites can also cause damage to aquaculture through its toxicity to aquatic animals, including fish and crustaceans. As nitrite can oxidize hemoglobin to methemoglobin, which is not capable of carrying oxygen, the latter can reach toxic concentrations in a high-density aquaculture system in contaminated waters. However, other studies have suggested that methemoglobinemia may not be the primary mechanism of nitrite toxicity. [13] In aquatic animals, nitrite can be taken up across gill epithelia and can be accumulated to a high concentration in bodily fluids; thus, there is a greater risk for aquatic animals than for terrestrial animals. In addition, high nitrite concentrations have caused considerable economic losses to aquaculture production. The nitrite uptake and toxicity mechanisms have been introduced in several reviews [13-16] and are not further discussed here. Many species of fish have been investigated to determine the relationship between nitrite concentration and fish diseases. The toxicity of nitrite to fish varies with fish species. A table has been compiled with the median lethal concentrations (LC50) of different fish species according to the work of William M. Lewis and coworkers [17].
Due to the damage caused by nitrite to human health and aquaculture production, relative standards have been established to limit the concentration of nitrite in potable water, food and aquaculture water. The World Health Organization (WHO) recommends a maximum nitrite concentration in drinking water of 3 mg/l as nitrite ion (or 0.9 mg/l as nitrite-nitrogen). [18] The maximum allowed nitrite concentration in meat products is 200 ppm. Similar standards have been formulated by many countries to limit nitrite concentration. With these limitations, several methods have been proposed to remove nitrite from water, including chemical/electrochemical methods [19] and bio-methods [20-22].
their higher sensitivity and specificity, the application of biosensors to nitrite detection has attracted much attention.
A number of excellent reviews have been compiled over the past decade. [23, 41-47] However, detection requirements and technology have developed in recent years. The aim of this article is to review various nitrite detection methods proposed in recent years and to summarize their technologies, advantages and disadvantages. This review is organized based on the type of signal obtained from the methods, including electric and optical signals. Biosensors are proposed as a new detection method. By tabulating the various analytical parameters (including materials, detection limit, detection range, working pH and stability) of each method, their performance and research trends can be observed. Finally, the advantages/disadvantages and limitations of each technique are discussed.
2. ELECTROCHEMICAL METHODOLOGIES
Electrochemical detection techniques have been investigated for in situ quantitative analysis and real-time monitoring of environmental parameters. [23, 43, 46] Technologies used to detect nitrite can be divided into a number of categories, of which voltammetric, potentiometric and impedimetric methods are routinely introduced. Articles using these categories are compiled, and their performances are tabulated.
2.1. Voltammetric electrodes
A voltammetric or amperometric electrode provides a current signal to represent the rate of reactions on the probe surface while a potential is applied to the working electrode. The potential applied to the working electrode is determined to avoid oxygen interference and obtain a strong electrode response to nitrite oxidation, including sensitivity and response time. [48] A typical measuring system consists of three electrodes, including working, reference and counter electrodes. A current-to-voltage converter and voltage amplifier are needed to convert the working probe current to voltage and amplify it to a suitable range for the analog-to-digital converter (ADC) to sample. The result can then be transmitted, saved, calculated, or displayed on a local instrument or remote monitor.
Voltammetric methodologies have been employed to detect and monitor nitrite since the early 1900s, when glassy carbon electrodes [49-52] were used that continuously detect without additional agent consumption. A great number of substrates have since been investigated for voltammetric detection and to improve electrode performance, such as copper, nickel, boron-doped diamond, platinum, carbon, cadmium, alloys, gold, lead and indium tin oxide. [41, 42] However, a disadvantage was discovered; the bare electrode has a poor electron-transfer rate, and the effect of electrode passivation caused by species formed during the electrochemical process tend to poison the electrode.
organic/inorganic catalysts and enzymes may be used as modifiers that can remarkably improve the sensibility and selectivity of electrodes by enhancing the reduction or oxidation of nitrite.
Ag nanoplates [53] grafted on the surface of a glassy carbon electrode may be used as a sensitive sensor for the assessment of nitrite. In addition, carbon black (CB) [54], reduced graphene oxide and dendritic copper nanoclusters [55], poly(3,4-ethylenedioxythiophene)–Au nanoparticles (PEDOT–AuNPs) composites [56], polyaniline (PANI)-Cu nanocomposites [57] and graphene oxide/palladium (ERGO-Pd) nanocomposites [58] have been investigated as modifiers on glassy carbon electrodes. Polymeric films of pyronin Y (PyY) [59] and platinum black [60] have also been reported as modifiers on pencil graphite electrodes (PGE) and platinum, respectively.
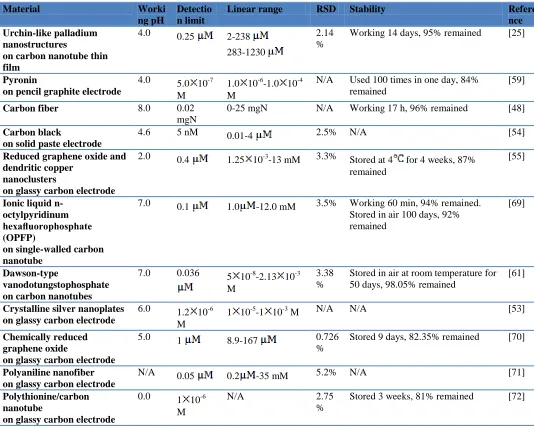
The carbon nanotube-based electrode is another promising substrate that has been investigated as a nitrite sensor with a number of modifiers. Zhang et al. constructed a composite film of vanodotungstophosphate, α2-K7P2VW17O62•18H2O (P2W17V), and carbon nanotubes (CNTs) that was used as a sensitive amperometric nitrite sensor. [61] Palladium nanostructures were deposited onto pre-patterned single-walled carbon nanotube (SWCNT) thin films to perform nitrite detection with a detection limit of 0.25 µM (S/N=3). [25]
In addition to a variety of modifications, photochemical catalysis is also a potential method to facilitate the performance of electrodes and obtain a rapid response. Photocatalysis technology has been investigated by X. F. Chen et al. and Li XiuTing et al. [62, 63], but no nitrite electrodes that use photocatalysis technology have been investigated before.
Increasing the sensitivity of the electrode response can also be achieved by constructing and exposing a large and highly active surface area. This goal can be achieved by the nanoparticle electroplating technique. Appropriate ions are dissolved in an electrolyte with a potential sweeping the immersed electrode in the cathodic direction. The metal ions are then electrolytically plated onto the electrode, providing a fresh surface for nitrite to undergo the oxidation-reduction reaction. A significant advantage of this approach is that the analysis is relatively independent of the base electrode material, as the nitrite reaction occurs at the freshly deposited metal layer.
Ag nanoplate-modified electrodes (AgNP/GC), which have high current response to the electrooxidation of NO2-, benefit from the enhanced surface area and high specific activity of AgNP/GC due to the exposure of many defect sites. [53] Solid paste electrodes prepared using a nanostructured carbon black [54], reduced graphene oxide and dendritic copper nanoclusters [55], AuNPs inserted into a PEDOT layer [56], single-walled carbon nanotubes (SWCNTs) [64] and carbon nanotube thin film electrodes immobilized on urchin-like palladium nanostructures [25] also benefit from large surface areas for higher current response, sensitivity and LOD.
Polarography [65-68] has also been introduced for detection of nitrite, as the behavior of a dropping mercury electrode (DME) is relatively independent of its past history. Polarography has high accuracy and reproducibility, as a liquid working electrode is used that can continuously refresh and remain unpolluted from contamination without interference among polarographic waves. Ummihan T. Yilmaz and Guler Somer [66] have reproducibly detected trace nitrite using differential pulse polarography (DPP) with a dropping mercury electrode (DME).
[image:5.596.26.560.192.620.2]
Hung Pham and co-workers immobilized Pd NPs, which are highly electrocatalytic, nontoxic and chemically inert to oxygen, on SWCNT film electrodes that were fabricated on a poly(ethylene terephthalate) substrate to obtain a flexible, transparent Pd/SWCNT electrode with high sensitivity, low detection limit, high selectivity, wide linear range and low cost. [25]
Table 1. Parameters and performances of voltammetric electrodes.
Material Worki ng pH
Detectio n limit
Linear range RSD Stability Refere nce Urchin-like palladium
nanostructures
on carbon nanotube thin film
4.0 0.25 2-238
283-1230
2.14 %
Working 14 days, 95% remained [25]
Pyronin
on pencil graphite electrode
4.0 5.0 10-7
M
1.0 10-6-1.0 10-4 M
N/A Used 100 times in one day, 84% remained
[59]
Carbon fiber 8.0 0.02 mgN
0-25 mgN N/A Working 17 h, 96% remained [48]
Carbon black
on solid paste electrode
4.6 5 nM 0.01-4 2.5% N/A [54]
Reduced graphene oxide and dendritic copper
nanoclusters
on glassy carbon electrode
2.0 0.4 1.25 10-3-13 mM 3.3% Stored at 4 for 4 weeks, 87%
remained
[55]
Ionic liquid n-octylpyridinum hexafluorophosphate (OPFP)
on single-walled carbon nanotube
7.0 0.1 1.0 -12.0 mM 3.5% Working 60 min, 94% remained.
Stored in air 100 days, 92% remained
[69]
Dawson-type
vanodotungstophosphate on carbon nanotubes
7.0 0.036 5 10-8
-2.13 10-3 M
3.38 %
Stored in air at room temperature for 50 days, 98.05% remained
[61]
Crystalline silver nanoplates on glassy carbon electrode
6.0 1.2 10-6
M
1 10-5-1 10-3 M N/A N/A [53]
Chemically reduced graphene oxide
on glassy carbon electrode
5.0 1 8.9-167 0.726
%
Stored 9 days, 82.35% remained [70]
Polyaniline nanofiber on glassy carbon electrode
N/A 0.05 0.2 -35 mM 5.2% N/A [71]
Polythionine/carbon nanotube
on glassy carbon electrode
0.0 1 10-6
M
N/A 2.75
%
Stored 3 weeks, 81% remained [72]
Detailed sensor parameters are compared in
Table 1. Many materials have been investigated, and nanometric materials have been employed to obtain larger surface areas. Voltammetric electrodes can work in solutions whose pH ranges from 4.0 to 8.0, thus including neutral solutions. The lowest detection limit of the tabulated electrodes is 5 nM, which has been significantly improved, and a relative standard deviation of 2.5% has been obtained.
2.2. Potentiometric electrodes
The potentiometric electrode detects ions with the assistance of organic membranes that contain an appropriate ionophore or ion-exchanger with specific binding affinity for the target ion and carry a particular charged species from the sample to the electrode area. A potential difference is formed between the reference and indicator electrodes with the appearance of a charged species, without current flowing between electrodes, and no species are consumed or produced. The potential difference varies with the logarithm of the concentration under the condition that the concentration of the ion of interest is sufficiently low that the activity coefficients can be considered constant; otherwise, the response curve should be calibrated.
Potentiometry with ion-selective electrodes has improved significantly in recent years, notably by achieving very low detection limits. The key advantages of potentiometry are signal selectivity to the analyte of interest, the ability to probe a large range of species that are not redox-active in aqueous environments, low detection limit [23] and applicability to colored and turbid samples [79]. The required instrumentation is also simple to fabricate, easy to use, inexpensive and portable. Many researchers have sought to devise ion-selective electrodes, often covered with membranes incorporated with suitable ionophores, for potentiometric detection of nitrite. Of course, neither option is particularly favorable. Several issues exist in potentiometric methods, such as low electrode response, interference from other species, unfeasible miniaturization due to unstable potential when the electrode approaches micrometer dimensions, common fluctuation of reference potential and potential drifts with time. [23]
Two electrodes are employed by the potentiometric method. A saturated calomel electrode (SCE) or Ag/AgCl electrode is typically employed to provide a reference for the working electrode. The working electrode, which provides selectivity and sensitivity towards the species of interest, is more complex than the reference electrode.
A number of complexes have been reported as nitrite-selective ionophores, including Co(III)-cyanocobyrinate [80-82], Co(III)-phthalocyanine [83], Co(III)-tetraphenylporphyrin derivatives [84], Co(III)-aquocyanocobyrinate [85], cobalt(III) tetraazaporphyrins [86], cobalt salens [87], In(III)-tetraphenylporphyrin chloride derivatives [88], benzylbis(triphenylphosphine) palladium(II) [89], UO2-salophen [90], corrins [80] and phthalocyanines [80].
biomimetic compounds were prepared to replace biological macromolecules that mimic the activity of the enzymes on an electrode surface that should be more stable. [91] Cosnier and coworkers demonstrated a cobalt(II) deuteroporphyrin derivative that was electropolymerized with the ability to perform potentiometric detection of nitrite by recording the shift of the reduction potential of [Dp Co(II) NO2-]-.
[image:7.596.36.563.278.653.2]A number of nitrite ion-selective electrodes have been reported, but strong interference effects existed from anionic species such as perchlorate, thiocyanate and iodide in a polymeric membrane doped with Co-salen as an ionophore [92] and acetate salts of three Co(III)-tetraphenylporphyrin derivatives [93].
Table 2. Parameters and performances of potentiometric and impedimetric electrodes.
Method Material Work ing pH
Detecti on limit
Linear range RSD Stability Reference
Potentiomet ry
Cobalt(III),10,15-tris(4-tert-butylphenyl) corrole in a plasticized poly(vinyl chloride) membrane
4.5 5 N/A N/A Soaked for
14 days, <82.92% remained [26] Potentiomet ry
Rhodium(III) porphyrins and salophens in a polymeric membrane electrode
4.5 5 N/A N/A 66 days,
88.71% remained
[27]
Potentiomet ry
Metallo-salens of cobalt(II) in a polymer-membrane electrode
5.0 N/A 1.58 10-5-0.138 M N/A N/A [87]
Potentiomet ry
Co(III)-tetraazaporphyrin in a PVC matrix
2.3-6.4
1.0 1.1 10-5-1.0 10-1
M (NL)
N/A Stored under 0.1 M solution of correspondin g anion, 5 months
[86]
Potentiomet ry
Co(II)-salophen complex in a PVC matrix
4.5-11.9 8.0 10-7 M
1.0 10-6-1.0 10-1 M
(Nernstian)
N/A Can be used at least 2 months without divergence [94] Potentiomet ry Poly(pyrrole-cobalt(II)deuteroporphyrin)
N/A N/A 2 10-6
-2.5 10-4 M
N/A N/A [91]
Impedimetr y
Naphthylethylenediamine on a gold electrode
N/A 20 nM 0.1-4 N/A N/A [28]
Impedimetr y
PTFE membrane, zinc-filled reduction column and bulk acoustic wave impedance sensor
N/A 1.8 2.5 -1.00 mM 1.75
%
N/A [95]
Ionophores have been proposed with better nitrite selectivity over thiocyanate, perchlorate, and salicylate. The best nitrite selectivity and longest functional lifetimes were obtained with membranes doped with carboxylated PVC and Rh-tBTPP, respectively. The response time can be partially shortened by employing polymer matrix additives such as polyurethanes or carboxylated PVC. [27]
Lipophilic vitamin B12 derivative complexes with cobalt(III) as the metal center have been exploited that have high selectivity for nitrite over chloride as a ionophore. However, these complexes exhibited a nearly equivalent potentiometric response to thiocyanate. A corrole ligand with a different metal ion center shows different selectivity towards different ions, and a Co(III) center can serve as a nitrite-selective ionophore. Sensors with proper amounts of lipophilic cationic sites have greatly enhanced nitrite response and selectivity. Based on the above findings, plasticized polymeric membrane electrodes incorporated with cobalt(III) corrole were investigated for potentiometric detection of nitrite. [26]
PVC membrane electrodes cooperated with nitrite-selective carriers have been fabricated as a nitrite-responsive detector with good selectivity. [83, 84, 97, 98] However, the PVC membrane has poor adhesion on certain solid substrates, such as silicon chips; thus, other polymeric matrices have been explored, including functionalized PVC, polyurethane (PU), silicone rubber and poly(acrylate or methacrylate), accompanied by poor electrochemical performance and limited plasticizer compatibility. Malinowska and coworkers investigated an anion-selective electrode based on metal(III) porphyrin ionophores in polyurethane membranes, with potentiometric responses to nitrite obtained. Significant potentiometric anion response and selectivity of the metal(III) porphyrin membranes were also observed in the presence of endogenous cationic sites in PU; in contrast, the anionic sites in PVC have no exogenous lipophilic sites added. [99]
Some of the potentiometric electrodes are compiled in
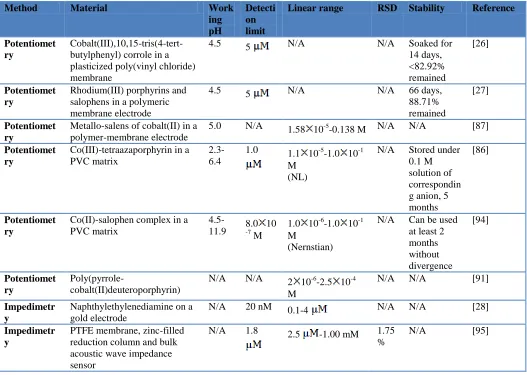
Table 2. Ccompared with voltammetric electrodes, the detection limit of potentiometric electrodes is somewhat higher, thus limiting their application in fields in which trace amounts of nitrite must be detected. But potentiometric electrodes are more easily and conveniently used, as no stimulation circuits are needed for detection.
2.3. Impedimetric electrodes
Electrochemical sensors whose impedance is proportional to an increase in nitrite concentration have also been investigated. To obtain the impedance of this electrode type, stimulation is also needed. When a voltage stimulation is applied to the electrode, the current from the electrode must be detected, and current stimulation requires voltage detection.
redox probe and the electrode. This Griess reaction-based method has been demonstrated, achieving a detection limit of 20 nM. [28]
A flow-injection system has been developed based on the use of a zinc-filled reduction column and a bulk acoustic wave impedance sensor (BAWIS) as detector. Both nitrate and nitrite are converted on-line to ammonia with water as a carrier stream, but only nitrate is converted to ammonia with sulfamic acid as a carrier. The formed ammonia diffuses across a PTFE membrane and is trapped in an acid stream, causing a change in the solution conductance. At a throughput of approximately 60 h-1, the system achieves a detection limit of 1.8 µM for nitrite. [95]
Few inorganic impedimetric nitrite electrodes have been investigated with few RSD and stability data acquired. As shown in
Table 2, a similar detection limit as voltammetric electrodes and even lower can be achieved.
3. SPECTROSCOPIC METHODOLOGIES
Spectroscopic methods for nitrite detection operate generally by measuring the radiation or absorption intensity of a particular wavelength affected by nitrite. Spectroscopy is a detection method that can be cooperated with other separation and enrichment methods, such as capillary electrophoresis [100], chromatography [101] and liquid-liquid extraction [102], to improve detection accuracy and decrease the detection limit. Flow injection analysis [30], sequential injection analysis [103], reverse flow injection analysis [37] and microfluidic analytical devices [32] have also been employed for reagent injection, mixture and reaction as a cooperated automation technology.
3.1. Fluorescence spectrometry
In the spectrofluorimetric detection of nitrite, the light emitted by a reagent that absorbed light or other energy can be detected. Fluorescence spectroscopy detection was first reported in 1972 by Gen-Ichiro Oshima and Kinzo Nagasawa, employing benzidine for detection. [104] Fluorescence spectroscopy detection can be divided into two categories: turn-on and turn-off type. Nitrite dissolved in solution can enhance the fluorescence intensity of turn-on indicators, while the fluorescence intensity of turn-off indicators is typically reduced, also known as fluorescence quenching detection. A large variety of indicators have been investigated for nitrite detection, including cerium [105], 2,3-diaminonaphthalene (DAN) [106], 2'7'-dichlorofluorescein [107], tetra-substituted amino aluminum phthalocyanine (TAAlPc) [108], rhodamine 3GO [109] and rhodamine 110 [110].
3.1.1. Turn-on indicator-based methods
preparative steps to remove interfering substances may cause variable recovery and introduce contamination in detection. Therefore, rapid determination of nitrite by reversed-phase high-performance liquid chromatography with fluorescence detection was developed to perform detection at picomole levels of nitrite, including the reaction of nitrite with 2,3-diaminonaphthalene (DAN) to form 2,3-naphthotriazole (NAT), the chromatographic separation of NAT, and the fluorescence detection of NAT. [111]
For an ultra-low detection limit, separation and extraction methods have been employed. Akyuez and Ata proposed a method for nitrite detection in which aqueous nitrite was reacted with 2,3-diaminonaphthalene (DAN) under acidic conditions to form 2,3-naphthotriazole (NAT) and extracted with toluene. The toluene layers were then analyzed by gas chromatography–mass spectrometry (GC– MS) and liquid chromatography with fluorescence detection (LC-FL). A detection limit of 0.29 pg/ml on S/N=3 has been achieved. [112]
Luminol chemiluminescence (CL) detection is a commonly used method for nitrite detection. Accompanied with a Cu–Cd reductor column, luminol CL can also be used for nitrate detection. Nitrite is oxidized to peroxynitrous acid by H2O2 in an acidic medium, which is converted to the peroxynitrite anion in an alkaline medium and oxidizes luminol to generate CL emission. [113] Another luminol method, based on ion-exchange separation (HPLC), online photochemical reaction and FIA, has been proposed to implement nitrite and nitrate detection without a Cu-Cd redactor column. Nitrite and nitrate were separated using an anion-exchange column and were then converted to peroxynitrite by UV irradiation using a low-pressure mercury lamp and mixed with a luminol solution to yield chemiluminescence. The key advantage is the employment of a photochemical reaction instead of a copperized cadmium column, thereby eliminating the production of harmful effluents. [114]
Rhodamine has also been used as a fluorescent indicator to detect nitrite. Kumar et al. developed a rhodamine-based fluorescent probe for the detection of trace amounts of nitrite ions in water. The probe operates by the diazotization of its amino group, followed by opening of the spirocyclic ring, intra-molecular rearrangement and fragmentation to produce rhodamine B in an acidic solution (pH 1). Extremely high sensitivity and selectivity were obtained over many other anionic species. [115] Rhodamine B hydrazide was employed as a fluorescence indicator to detect nitrite under acidic pH [116] but is not applicable in natural water at neutral pH. Rhodamine B phenyl hydrazide is sensitive to acid and undergoes ring-opening in acidic media without addition of any ions or oxidizing agents in solution; thus, the compound was synthesized and has been reported as an indicator for NO 2-with remarkably high sensitivity and selectivity in aqueous methanol at pH 7.0 over other common ions and oxidants (Cl−, ClO−, ClO2−, ClO3−, ClO4−, SO4
2− , SiO3
2− , NO3
2− , CO3
2− ). [31]
3.1.2. Turn-off indicator-based methods
A number of reagents have been employed as fluorescence quenching indicators, and some of these detection methods cooperate with separation methods. Constantine D. Stalikas and coworkers investigated an ion chromatographic method for the simultaneous determination of nitrite and nitrate by post-column indirect fluorescence detection. The method uses an enhanced fluorescence mobile phase containing tryptophan, and suppression of fluorescence caused by the elution of the target ions was detected. A highly induced fluorescence quenching effect of tryptophan was observed by the presence of phosphate ions, which are utilized as buffer solution components in the flow stream for the post-column reaction. [119]
A notable enhancement of fluorescence response was obtained when a conjugated polyelectrolyte was used in the sensory scheme. Fe2+ can easily be oxidized to Fe3+ in the presence of NO2– and H+; the ferric ion dramatically quenches the fluorescence of PPESO3. Thus, anionic conjugated polyelectrolytes and PPESO3 (poly[2,5-bis(3-sulfonatopropoxy)-1,4-phenylethynylene-alt-1,4-poly(phenyleneethynylene)]) have been employed for nitrite detection based on fluorescence quenching effects. [120]
The photochemical reduction of nitrite to NO and generation of peroxynitrite have also been achieved via UV irradiation instead of a cadmium-copper column, and subsequent chemiluminescent detection was employed based on luminol chemiluminescence for nitrite detection. [121]
As modifiers can detach from modified probes, a stability problem is encountered. Silica nanoparticles covalently grafted with a rhodamine derivative of p-hydroxybenzaldehyde, rhodamine 6G hydrozone (Rh 6G-OH), on the surface was fabricated for nitrite detection based on the nitrosation reaction, and high selectivity for nitrite ion in the presence of interference ions was obtained. More importantly, organic dye leakage can be effectively prevented by covalent-grafting of Rh 6G-OH to the surface of SiO2 nanoparticles. [122]
Spectrofluorimetric microdetermination of nitrite in water was reported after derivatization with 4-methyl-7-aminocoumarin. [123] However, the method involved several steps, including synthesis of the diazonium salt of coumarin and two cumbersome liquid–liquid extraction procedures requiring nearly an hour. A fast and simple method was developed by the use of 6-aminocoumarin (L) without derivatization of the aminocoumarin. The result is an efficient nitrite ion-selective fluorescent sensor in which interference from other common anions is almost negligible. [6]
Quantum dots have attracted much attention for analytical applications because of their excellent fluorescence properties, high photochemical stability and excellent resistance to chemical degradation relative to organic dyes. [127, 128]
The electrochemiluminescence (ECL) behavior of Si nanocrystals (NCs) was first studied by Bard in 2002 [129], and NCs have been extensively investigated as a new type of ECL emitter, with many NC-based ECL sensing strategies reported [130]. NCs were also employed for nitrite detection based on the ECL quenching of dual-stabilizer-capped CdTe QDs. Experiments have been conducted by Xunxun Yin, achieving a detection limit of 1.4 nM. [131]
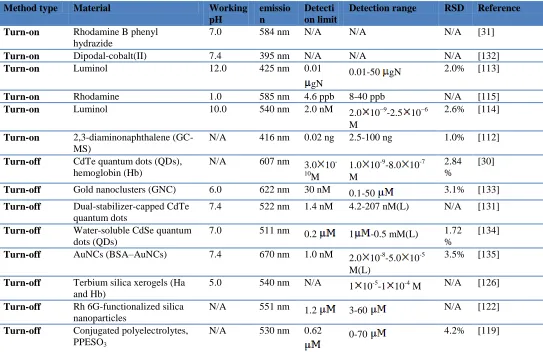
[image:12.596.24.567.380.732.2]To increase CL intensity and system selectivity, Hb was introduced to a nitrite detection system based on a CdTe CL system, which resulted in significant enhancement of the CL signal. Hb reacts with H2O2 to produce a large number of hydroxyl radicals that then interact with the QDs, leading to the injection of holes into the 1Sh quantum-confined orbitals of the CdTe QDs with great enhancement of chemiluminescence intensity. Additional nitrite in the system reacts with ferrous Hb to form ferric Hb and NO, then NO binds to ferrous Hb to generate iron nitrosyl Hb, resulting in the quenching of the CL from the CdTe QDs-based CL system [30]
Table 3. Parameters and performances of fluorescence spectrometric methods.
Method type Material Working pH
emissio n
Detecti on limit
Detection range RSD Reference
Turn-on Rhodamine B phenyl hydrazide
7.0 584 nm N/A N/A N/A [31]
Turn-on Dipodal-cobalt(II) 7.4 395 nm N/A N/A N/A [132]
Turn-on Luminol 12.0 425 nm 0.01 gN
0.01-50 gN 2.0% [113]
Turn-on Rhodamine 1.0 585 nm 4.6 ppb 8-40 ppb N/A [115]
Turn-on Luminol 10.0 540 nm 2.0 nM 2.0 10−9-2.5 10−6
M
2.6% [114]
Turn-on 2,3-diaminonaphthalene (GC-MS)
N/A 416 nm 0.02 ng 2.5-100 ng 1.0% [112]
Turn-off CdTe quantum dots (QDs), hemoglobin (Hb)
N/A 607 nm 3.0 10
-10M
1.0 10-9-8.0 10-7 M
2.84 %
[30]
Turn-off Gold nanoclusters (GNC) 6.0 622 nm 30 nM 0.1-50 3.1% [133]
Turn-off Dual-stabilizer-capped CdTe quantum dots
7.4 522 nm 1.4 nM 4.2-207 nM(L) N/A [131]
Turn-off Water-soluble CdSe quantum dots (QDs)
7.0 511 nm 0.2 1 -0.5 mM(L) 1.72
%
[134]
Turn-off AuNCs (BSA–AuNCs) 7.4 670 nm 1.0 nM 2.0 10-8-5.0 10-5
M(L)
3.5% [135]
Turn-off Terbium silica xerogels (Ha and Hb)
5.0 540 nm N/A 1 10-5-1 10-4 M N/A [126]
Turn-off Rh 6G-functionalized silica nanoparticles
N/A 551 nm 1.2 3-60 N/A [122]
Turn-off Conjugated polyelectrolytes, PPESO3
Xun Yao and coworkers have prepared CdSe quantum dots (QDs) for nitrite detection based on the quenching effect of nitrite, achieving a detection limit of 0.2 µM. Water-soluble CdSe QDs have been fabricated with L-cysteine as the stabilizer, which has low toxicity compared with traditional hydrosulfonyl reagents, for electrochemiluminescence determination of nitrite. The ECL emission of CdSe QDs is greatly enhanced by sulfite and is gradually quenched by nitrite at an indium tin oxide (ITO) electrode. [134]
With quantum dots, encouraging developments have been achieved in analytical applications, but inherent compositional toxicity limits their applications [136, 137]. Gold nanoclusters (AuNCs), whose advantages include low toxicity, excellent biocompatibility, stability, good solubility, strong fluorescence emission and excellent photostability [138-140], have attracted much attention as a fluorescent probe. [141-144] Because of their attractive advantages, near-infrared (NIR)-emitting bovine serum albumin-stabilized AuNCs (BSA-AuNCs) have been prepared via sonochemical methods by Hongying Liu and coworkers for construction of the first nitrite sensor based on the selective fluorescence quenching effect towards nitrite, with a detection limit of 1.0 nM. [135] In similar work by Yue et al., a detection limit of 30 nM was obtained under optimal conditions. [133]
As shown in
Table 3, fluorescence spectrometric methods can achieve a very low detection limit, and their wavelength range is in the scope of visible light. A pH range of 1.0 to 10.0 is suitable for these indicators, and some are optimal in neutral solution.
3.2. Absorption spectrometry
The absorption of a specific is measured to quantify the amount of a specific substance, as the substance can absorb energy (photons) from radiation of a specific wavelength. The absorption spectrum is usually measured by detecting the intensity of the radiation that passes through the substance upon irradiation with a specific wavelength. Light with different wavelengths has been employed for nitrite detection.
3.2.1. Colorimetric spectrophotometry
The complementary color of visible light absorbed by an analyte is usually detected in colorimetric spectrophotometry. A chromogenic reagent is usually needed, as well as reagents to preprocess the analyte and remove impurities and interfering ions. For colorimetric nitrite detection, the Griess diazotization reaction is widely used.
resorcinol, or catechol. A purple azo dye produced in the foam membranes is then used for quantitative spectrophotometric determination of nitrite. [146]
For a lower detection limit, preprocess methods have been introduced, such as separation and enrichment. Gapper et al. have introduced ion exchange liquid chromatography (LC) for spectrophotometric detection of nitrite using Griess reagents. [147] Polyetherimide (PEI)-composed membranes have also been employed for nitrite enrichment in samples with an on-line dialysis preconcentration nitrite determination system based on injection methods. The PEI method resulted in high dialyzing yield and analytical signal and low blank signal without membrane clogging. Nitrite penetrated from the PEI membrane is diazotized with sulfanilamide to form an active diazonium in the recipient (acceptor) stream that subsequently couples with N-(1-naphthyl)-ethylenediamine dihydrochloride to form a stable purple azo dye with measured absorbance at 525 nm. [148]
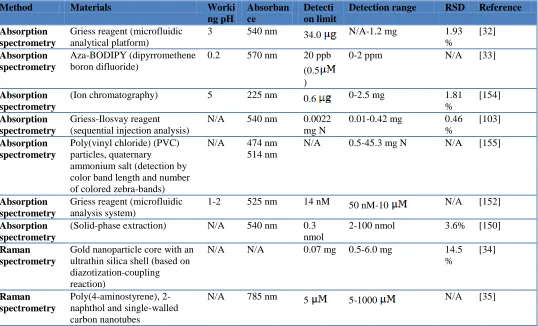
Solid-phase enrichment techniques are another type of preconcentrate method employed to improve the detection limit before Griess reaction-based colorimetric detection. [149] On-line solid-phase extraction (SPE) and liquid waveguide capillary cell (LWCC) spectrophotometric detection have been combined to construct a flow analysis system that can monitor nanomolar levels of nitrite and nitrate simultaneously. The azo compound formed from nitrite will be quantitatively extracted on an HLB SPE cartridge and then eluted and detected in a 16-cm path length LWCC detector. Experiments have been conducted with a detection limit of 0.3 nmol/L. [150]
The Griess reagent has been used as a commercial nitrite sensor. However, special attention is required for the preparation and storage of this reagent because of the usage of high concentrations of three different components and complexity of the operating procedure. A novel aza-BODIPY probe has been developed for sensitive colorimetric detection of the nitrite ions by a simple and direct method. A distinct visual color change from bright blue to intense green appears as nitrite contacts the probe. This probe is reportedly the simplest probe that can be used in the form of strips or dipsticks for on-site analysis of nitrite. [33]
For simultaneous automated detection, sequential injection analysis (SIA) has been employed in a fiber-optic spectrophotometer based on the Griess method. The formed azo dye was measured at 540 nm. [103, 151]
Due to its large physical size, power consumption and large amounts of reagent consumed, the conventional FIA system is unsuitable for long-term, on-site and remote detection. Reagent consumption as well as size and power requirements can be reduced by microfluidic platforms. Some microchip absorption cells with small path lengths result in reduced sensitivities and high LODs. A continuous-flow, microfluidic tinted PMMA absorption cell and detection system has been designed with integrated optical illumination and detection. The system detects nitrite based on the Griess reaction, with a limit of detection of 14 nM. [152]
and the nitrite concentration is determined by a highly sensitive, low-cost wireless PEDD detector, ensuring inexpensive fabrication and functioning of the whole platform. However, the PSPNIPAAm ionogel-based valves require exposure to acidic solution to induce swelling, and the shrinking mechanism of the gel results in the release of protons into the external solution around the gel. Thus, the pH requirement restricts its application to enzyme- or antibody-based methods or the handling of cells and proteins, which typically require neutral pH. In such cases, the acidic solution must be pushed through the microfluidic system in front of the assay reagents. [32]
[image:15.596.15.553.438.764.2]In addition to the Griess reaction, there are other methods proposed for absorption detection of nitrite. Daniel et al. have prepared two types of gold nanoparticle (Au NP) probes for nitrite detection based on spectrophotometry. The first one features aniline Au NPs modified with 5-[1,2]dithiolan-3-yl-pentanoic acid [2-(4-amino-phenyl)ethyl]amide (DPAA). The second type features naphthalene Au NPs modified with 5-[1,2]dithiolan-3-yl-pentanoic acid [2-(naphthalene-1-ylamino)et-hyl]amide and MTA. The solution containing aniline and naphthalene Au NPs is red due to intense surface plasmon resonance at 520 nm. When nitrite is added, the amine groups on the aniline Au NPs convert to a diazonium salt under acidic conditions. The diazonium salt then couples with the naphthalene Au NPs to form covalently interconnected nanoparticle probes. Finally, precipitate crosslinked particle networks will form, causing the solution to become colorless. However, the detection limit is somewhat high. [153]
Table 4. Parameters and performances of absorption and Raman spectrometric methods.
Method Materials Worki ng pH
Absorban ce
Detecti on limit
Detection range RSD Reference
Absorption spectrometry
Griess reagent (microfluidic analytical platform)
3 540 nm 34.0 N/A-1.2 mg 1.93
% [32] Absorption spectrometry Aza-BODIPY (dipyrromethene boron difluoride)
0.2 570 nm 20 ppb
(0.5 )
0-2 ppm N/A [33]
Absorption spectrometry
(Ion chromatography) 5 225 nm 0.6 0-2.5 mg 1.81
%
[154]
Absorption spectrometry
Griess-Ilosvay reagent (sequential injection analysis)
N/A 540 nm 0.0022
mg N
0.01-0.42 mg 0.46
%
[103]
Absorption spectrometry
Poly(vinyl chloride) (PVC) particles, quaternary
ammonium salt (detection by color band length and number of colored zebra-bands)
N/A 474 nm
514 nm
N/A 0.5-45.3 mg N N/A [155]
Absorption spectrometry
Griess reagent (microfluidic analysis system)
1-2 525 nm 14 nM 50 nM-10 N/A [152]
Absorption spectrometry
(Solid-phase extraction) N/A 540 nm 0.3
nmol
2-100 nmol 3.6% [150]
Raman spectrometry
Gold nanoparticle core with an ultrathin silica shell (based on diazotization-coupling reaction)
N/A N/A 0.07 mg 0.5-6.0 mg 14.5
%
[34]
Raman spectrometry
Poly(4-aminostyrene), 2-naphthol and single-walled carbon nanotubes
Another method to detect nitrite concentration is to read the color band length and number of colored zebra-bands. A detecting tube packed with poly(vinyl chloride) (PVC) particles coated with a quaternary ammonium salt into a mini-column has been developed. Nitrite solution is treated with sulfanilic acid and 1-naphthol; the resulting colored solution is drawn into the detecting tube by suction with a syringe, and a color band then forms in the tube. The color band length (CBL) corresponds to nitrite concentration. Another type of detecting tube has been prepared by alternately packing adsorbent and uncoated PVC particles in a mini-column. In this column, colored zebra-bands are formed whose number is proportional to nitrite concentration. However, the accuracy obtained with these methods is somewhat low, and preparation of the detecting tube to produce colored zebra-bands is difficult. [155]
3.2.2. Ultraviolet spectrophotometry
In addition, ultraviolet radiation has been used as an absorption photometric method for nitrite detection. Different ions have different absorption peaks at a corresponding wavelength. Therefore, a specific analyte can be detected by measuring the absorbance at a certain wavelength. Other wavelengths are needed to distinguish or detect interfering ions.
Ultraviolet spectrophotometry has been employed for nitrite detection in combination with anion chromatography, which was used for anion separation. This measurement does not require pretreatment of samples and reagents yet still achieves nanomolar detection limits and requires <100 ml of samples. [156] Chromatography (IC) and ultraviolet (UV) spectrophotometry have also been used for nitrite detection with the assistant of dilauryldimethylammonium-coated monolithic ODS columns and sodium chloride as an eluent. [154]
An existing UV spectrophotometer was adapted for on-line detection of nitrite with a sequential batch reactor (SBR). Samples react sufficiently in an SBR, and a UV spectrophotometer detects specific ions. The detection system also has a filtering module that is developed to provide particle-free fluids to the sensor. The system has run for five months with a detection range of 0 to 18 mg/L for nitrite and, except for the filtering module, is nearly non-consumable. [157]
As shown in
Table 4, absorption spectrometry also results in a very low detection limit. Most of these methods work in acidic solution, and the detection wavelength varies from ultraviolet to visible light. Similar to fluorescence spectrometry, reagents are needed for absorption spectrometry.
3.3. Raman spectrometry
However, spontaneous Raman scattering is very weak, making it difficult to separate weak inelastically scattered light from intense Rayleigh-scattered light. Thus surface-enhanced Raman spectroscopy (SERS) [158, 159] was proposed, with tremendously enhanced Raman scattering obtained. This method has been employed for nitrite detection with the use of 4-aminobenzenethiol (4-ABT) on Au, with a detection limit of 5 µM. [160]
Additionally, when the excitation wavelength matches the electronic transition of the molecule, the molecule experiences resonance Raman scattering (RRS), in which the vibrational modes associated with the excited electronic state are greatly enhanced. Based on this finding, UV resonance Raman spectroscopy has been investigated to monitor nitrite. [161]
To improve the selectivity and stability of SERS substrates, shell-isolated nanoparticle-enhanced Raman spectroscopy (SHINERS) [162, 163] was developed. This method has been used to detect trace nitrite based on the diazotization-coupling reaction of nitrite with p-nitroaniline in the presence of diphenylamine in acidic media, where Au/SiO2 nanoparticles with pinholes were used as the SHINERS substrate. The concentration of nitrite can be detected indirectly from azo dye. [34] In addition, surface resonance Raman scattering (SERRS), which combines SERS with RRS, has also been investigated; this method can provide nondestructive and ultrasensitive detection down to the single-molecule level [164].
4. BIOSENSORS
Biosensors used to perform nitrite detection are typically voltammetric, potentiometric and impedimetric [29] electrodes. As biosensors usually show higher sensitivity and specificity, there is emerging interest in their investigation for direct detection of nitrite.
A variety of biosensors have been developed for nitrite detection that use a number of modifiers, such as copper-containing nitrite reductase (Cu-NiR) and viologen-modified sulfonated polyaminopropylsiloxane (PAPS-SO3H-V) [165], copper-containing nitrite reductase (Cu-NiR, from Rhodopseudomonas sphaeroides forma sp. denitrificans) and viologen-modified chitosan (CHIT-V) [166], cytochrome c (Cyt c) [167], single-layer grapheme nanoplatelet (SLGnP)–protein [168], myoglobin (Mb) [169] and a (Mb)-L-cysteamine (Cys)-AuD biological hybrid [170].
In addition to the variety of modifiers, many substrates have also been investigated, such as a gold electrode modified with Nafion and a Cu-Mg-Al layered double hydroxide (Cu-LDH) [167], LaF3-doped CeO2 (LaF3-DP-CeO2) [169] and a glassy carbon electrode [165].
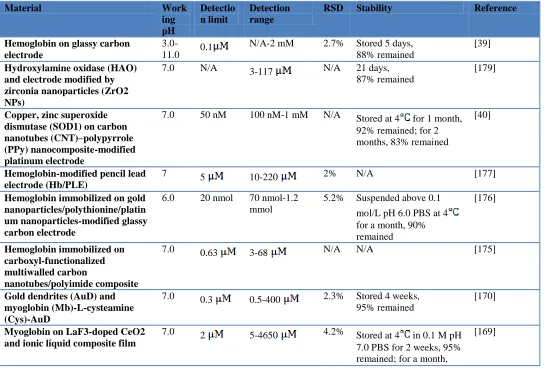
Hb as a bio-modifier has been immobilized on a number of substrates, such as a carboxyl-functionalized multiwalled carbon nanotubes/polyimide composite [175], a gold nanoparticles/polythionine/platinum nanoparticles-modified glassy carbon electrode [176] and a pencil lead electrode [177]
[image:18.596.29.573.397.765.2]However, the deep burying of heme groups in the large three-dimensional structure of the proteins and the denaturation of Hb when immobilized onto the electrode surface make it difficult to transfer electrons from hemoglobin (Hb) to conventional electrodes. The additional diffusion resistance offered by entrapment materials or the mesopores usually results in lower sensitivity and a higher detection limit. Therefore, Hb was directly electrospun onto the surface of a glassy carbon (GC) electrode with a highly porous structure, which significantly reduces the additional diffusion resistance of analytes without the use of an entrapment matrix. [178] Biological incompatibility can also make the DET difficult when biomolecules are directly composited on an electrode surface. To improve the biosensor performance, Shaghayegh Saadati et al. fabricated a glassy carbon electrode modified with a covalently attached amine-terminated ionic liquid and titanium nitrite nanoparticles used as support for immobilization of hemoglobin protein with direct electron transfer and achieved excellent bioelectrocatalytic nitrite reduction activity. [39]
Table 5. Parameters and performances of biosensors.
Material Work ing pH Detectio n limit Detection range
RSD Stability Reference
Hemoglobin on glassy carbon electrode
3.0-11.0 0.1
N/A-2 mM 2.7% Stored 5 days,
88% remained
[39]
Hydroxylamine oxidase (HAO) and electrode modified by zirconia nanoparticles (ZrO2 NPs)
7.0 N/A 3-117 N/A 21 days,
87% remained
[179]
Copper, zinc superoxide dismutase (SOD1) on carbon nanotubes (CNT)–polypyrrole (PPy) nanocomposite-modified platinum electrode
7.0 50 nM 100 nM-1 mM N/A Stored at 4 for 1 month,
92% remained; for 2 months, 83% remained
[40]
Hemoglobin-modified pencil lead electrode (Hb/PLE)
7 5 10-220 2% N/A [177]
Hemoglobin immobilized on gold nanoparticles/polythionine/platin um nanoparticles-modified glassy carbon electrode
6.0 20 nmol 70 nmol-1.2
mmol
5.2% Suspended above 0.1
mol/L pH 6.0 PBS at 4 for a month, 90% remained
[176]
Hemoglobin immobilized on carboxyl-functionalized multiwalled carbon
nanotubes/polyimide composite
7.0 0.63 3-68 N/A N/A [175]
Gold dendrites (AuD) and myoglobin (Mb)-L-cysteamine (Cys)-AuD
7.0 0.3 0.5-400 2.3% Stored 4 weeks,
95% remained
[170]
Myoglobin on LaF3-doped CeO2 and ionic liquid composite film
7.0 2 5-4650 4.2% Stored at 4 in 0.1 M pH
7.0 PBS for 2 weeks, 95% remained; for a month,
87% remained
Catalase on gold electrode 7.3 8 10-11
M
N/A N/A N/A [29]
Electron donors and acceptors are usually needed to activate the nitrite redox enzyme, which can transport electrons to or from the enzyme. However, the donors or acceptors are often expensive and not economically feasible for use in industrial processes. As an improvement, biosensors without electron donors and acceptors have been designed. The latest such sensor was fabricated based on a carbon paste electrode and zirconia with hydroxylamine oxidase enzyme by Hamideh Dehghani and coworkers. [179]
For simultaneous measurement of nitrite and nitrate in biological samples, a bienzymatic biosensor using copper, zinc superoxide dismutase (SOD1) and nitrate reductase (NaR) co-immobilized on a carbon nanotubes (CNT)–polypyrrole (PPy) nanocomposite-modified platinum electrode was developed. Two enzymes were co-immobilized on an electrode surface, with biological activity completely retained. To provide a porous host matrix for the immobilization of SOD1 and NaR, the electrode surface was modified with polypyrrole (PPy) and a well-ordered conductive polymer chain with good environmental stability [180] was also provided. CNT–PPy nanocomposites with additional surface area to immobilize more SOD1 and NaR also act as molecular wires to accelerate electron transfer between underlying electrode and active sites. To eliminate possible interferences during measurements in biological samples, a cellulose acetate (CA) membrane was also used. The electrocatalytic activity of SOD1 towards nitrite was observed at +0.8 V with a detection limit of 50 nM and sensitivity of 98.57±1.7 nA mM-1
cm-2. [40]
An obvious feature of biosensors is that they usually work in neutral solution, as shown in Table 5. So that it is convenient to perform nature water detection. And as shown in Table 5, biosensors also have a low detection limit due to the high activity of the protein or enzyme toward the analyte.
5. CONCLUSION AND FUTURE PERSPECTIVES
ACKNOWLEDGEMENTS
The authors would like to thank Cody M and Leyna D for providing English language editing of this paper. This work was supported by “Special Fund for Agro-scientific Research in the Public Interest” (201203017). This work was supported by agricultural engineering in colleges and universities of JiangSu advantage discipline construction project. (PAPD)
References
1. C.U. Carlsen, J.K.S. Moller, and L.H. Skibsted, Coordination Chemistry Reviews, 249 (2005) 485.
2. H. Yetim, A. Kayacier, Z. Kesmen, and O. Sagdic, Meat Science, 72 (2006) 206. 3. J.G. Sebranek and J.N. Bacus, Meat Science, 77 (2007) 136.
4. O. World Health, The selection and use of essential medicines: report of the WHO Expert Committee, March 2011 (including the 17th WHO model list of essential medicines and the 3rd WHO model list of essential medicines for children). The selection and use of essential medicines: report of the WHO Expert Committee, March 2011. 2012. xiv + 249 pp.
5. L. Jia, C. Bonaventura, J. Bonaventura, and J.S. Stamler, Nature, 380 (1996) 221.
6. S. Guha, S. Lohar, M. Bolte, D.A. Safin, and D. Das, Spectroscopy Letters, 45 (2012) 225. 7. V.Y. Titov and Y.M. Petrenko, Biochemistry-Moscow, 70 (2005) 473.
8. L. Li, P. Wang, X.L. Xu, and G.H. Zhou, Journal of Food Science, 77 (2012) C560. 9. P. Jakszyn and C.A. Gonzalez, World Journal of Gastroenterology, 12 (2006) 4296. 10. F. Lyall, I.A. Greer, A. Young, and L. Myatt, Placenta, 17 (1996) 165.
11. A. Aschengrau, S. Zierler, and A. Cohen, Archives of Environmental Health, 44 (1989) 283. 12. J.D. Brender, J.M. Olive, M. Felkner, L. Suarez, W. Marckwardt, and K.A. Hendricks,
Epidemiology, 15 (2004) 330.
13. J.R. Tomasso, Aquatic Toxicology, 8 (1986) 129.
14. H. Kroupova, J. Machova, and Z. Svobodova, Nitrite influence on fish: a review. 2005. 461. 15. Z. Svobodova, J. Machova, G. Poleszczuk, J. Huda, J. Hamackova, and H. Kroupova, Acta
Veterinaria Brno, 74 (2005) 129.
16. J.R. Tomasso, Aquaculture International, 20 (2012) 1107.
17. W.M.L. Jr. and D.P. Morris, Toxicity of Nitrite to Fish: A Review. 1986. 183.
18. O. World Health, Guidelines for drinking-water quality. Guidelines for drinking-water quality. 2011. 632 pp.
19. M. Saleem, M.H. Chakrabarti, and D.u.B. Hasan, African Journal of Biotechnology, 10 (2011) 16566.
20. B.U. Foesel, A. Gieseke, C. Schwermer, P. Stief, L. Koch, E. Cytryn, J.R. de la Torre, J. van Rijn, D. Minz, H.L. Drake, and A. Schramm, Fems Microbiology Ecology, 63 (2008) 192. 21. S. Keuter, M. Kruse, A. Lipski, and E. Spieck, Environmental Microbiology, 13 (2011) 2536. 22. M.N. Brown, A. Briones, J. Diana, and L. Raskin, Fems Microbiology Ecology, 83 (2013) 17. 23. G. Denuault, Ocean Science, 5 (2009) 697.
24. P.K. Rastogi, V. Ganesan, and S. Krishnamoorthi, Journal of Materials Chemistry A, 2 (2014) 933.
25. X.-H. Pham, C.A. Li, K.N. Han, H.-N. Buu-Chau, L. Thanh-Hai, E. Ko, J.H. Kim, and G.H. Seong, Sensors and Actuators B-Chemical, 193 (2014) 815.
26. S. Yang and M.E. Meyerhoff, Electroanalysis, 25 (2013) 2579.
27. M. Pietrzak and M.E. Meyerhoff, Analytical Chemistry, 81 (2009) 3637.
28. Z. Wang, X. Liu, M. Yang, S. An, X. Han, W. Zhao, Z. Ji, X. Zhao, N. Xia, X. Yang, and M. Zhong, International Journal of Electrochemical Science, 9 (2014) 1139.
Letters, 9 (2011) 2283.
30. L. Liu, Q. Ma, Z. Liu, Y. Li, and X. Su, Analytical and Bioanalytical Chemistry, 406 (2014) 879.
31. M. Saleem, R. Abdullah, I.S. Hong, and K.-H. Lee, Bulletin of the Korean Chemical Society, 34 (2013) 389.
32. M. Czugala, C. Fay, N.E. O'Connor, B. Corcoran, F. Benito-Lopez, and D. Diamond, Talanta, 116 (2013) 997.
33. N. Adarsh, M. Shanmugasundaram, and D. Ramaiah, Analytical Chemistry, 85 (2013) 10008. 34. K.G. Zhang, Y.L. Hu, and G.K. Li, Talanta, 116 (2013) 712.
35. Z.B. Wang, J.F. Wang, Z.W. Xiao, J.F. Xia, P.P. Zhang, T. Liu, and J.J. Guan, Analyst, 138 (2013) 7303.
36. M. Yaqoob, A. Nabi, and P.J. Worsfold, Journal of the Chemical Society of Pakistan, 35 (2013) 533.
37. M. Zhang, D.-X. Yuan, S.-C. Feng, and Y.-M. Huang, Chinese Journal of Analytical Chemistry, 39 (2011) 943.
38. R. Attiq ur, M. Yaqoob, A. Waseem, and A. Nabi, Acta Chimica Slovenica, 58 (2011) 569. 39. S. Saadati, A. Salimi, R. Hallaj, and A. Rostami, Sensors and Actuators B-Chemical, 191
(2014) 625.
40. T. Madasamy, M. Pandiaraj, M. Balamurugan, K. Bhargava, N.K. Sethy, and C. Karunakaran, Biosensors & Bioelectronics, 52 (2014) 209.
41. J. Dutt and J. Davis, Journal of Environmental Monitoring, 4 (2002) 465. 42. M.J. Moorcroft, J. Davis, and R.G. Compton, Talanta, 54 (2001) 785.
43. B.J. Privett, J.H. Shin, and M.H. Schoenfisch, Analytical Chemistry, 82 (2010) 4723. 44. E. Bakker and Y. Qin, Analytical Chemistry, 78 (2006) 3965.
45. E. Bakker, Analytical Chemistry, 76 (2004) 3285.
46. M. Lu, N.V. Rees, A.S. Kabakaev, and R.G. Compton, Electroanalysis, 24 (2012) 1693. 47. M. Taillefert, G.W. Luther, and D.B. Nuzzio, Electroanalysis, 12 (2000) 401.
48. W.H. Lee, D.G. Wahman, and J.G. Pressman, Sensors and Actuators B-Chemical, 188 (2013) 1263.
49. A.Y. Chamsi and A.G. Fogg, Analyst, 113 (1988) 1723. 50. J.E. Newbery and M.P.L. Dehaddad, Analyst, 110 (1985) 81.
51. D.L. Ehman and D.T. Sawyer, Journal of Electroanalytical Chemistry, 16 (1968) 541. 52. W.M. Graven, Analytical Chemistry, 31 (1959) 1197.
53. W. Zhoufeng, L. Fang, G. Tingting, Y. Siwei, and Z. Chunmei, Journal of Electroanalytical Chemistry, 664 (2012) 135.
54. S.I.R. Malha, J. Mandli, A. Ourari, and A. Amine, Electroanalysis, 25 (2013) 2289.
55. D. Zhang, Y. Fang, Z. Miao, M. Ma, X. Du, S. Takahashi, J.-i. Anzai, and Q. Chen, Electrochimica Acta, 107 (2013) 656.
56. O. Zhang, Y. Wen, J. Xu, L. Lu, X. Duan, and H. Yu, Synthetic Metals, 164 (2013) 47.
57. Y. Zhang, J. Yin, K. Wang, P. Chen, and L. Ji, Journal of Applied Polymer Science, 128 (2013) 2971.
58. Y. Zhang, Y. Zhao, S. Yuan, H. Wang, and C. He, Sensors and Actuators B-Chemical, 185 (2013) 602.
59. K. Dagci and M. Alanyalioglu, Journal of Electroanalytical Chemistry, 711 (2013) 17.
60. Y. Li, C. Sella, F. Lemaitre, M.G. Collignon, L. Thouin, and C. Amatore, Electroanalysis, 25 (2013) 895.
61. D. Zhang, H. Ma, Y. Chen, H. Pang, and Y. Yu, Analytica Chimica Acta, 792 (2013) 35. 62. X.F. Cheng, W.H. Leng, D.P. Liu, J.Q. Zhang, and C.N. Cao, Chemosphere, 68 (2007) 1976. 63. X.T. Li, L.F. Liu, F.L. Yang, X.W. Zhang, and J. Barford, Chinese Journal of Inorganic
64. L. Agui, P. Yanez-Sedeno, and J.M. Pingarron, Analytica Chimica Acta, 622 (2008) 11.
65. Q. Li, T. Zhan, Y. Luo, D.N. Song, and G.H. Lu, Journal of Aoac International, 85 (2002) 456. 66. U.T. Yilmaz and G. Somer, Journal of Electroanalytical Chemistry, 624 (2008) 59.
67. P. Sharma and R. Sharma, International Journal of Environmental Analytical Chemistry, 82 (2002) 7.
68. S. Rigaut, M.H. Delville, J. Losada, and D. Astruc, Inorganica Chimica Acta, 334 (2002) 225. 69. L. Zhou, J.P. Wang, L. Gai, D.J. Li, and Y.B. Li, Sensors and Actuators B-Chemical, 181
(2013) 65.
70. V. Mani, A.P. Periasamy, and S.M. Chen, Electrochemistry Communications, 17 (2012) 75. 71. W. Hui, Y. Pei-Hui, C. Huai-Hong, and C. Jiye, Synthetic Metals, 162 (2012) 326.
72. C. Deng, J. Chen, Z. Nie, M. Yang, and S. Si, Thin Solid Films, 520 (2012) 7026. 73. J. Jiang and X. Wang, Ecs Electrochemistry Letters, 1 (2012) H21.
74. M. Khairy, R.O. Kadara, and C.E. Banks, Analytical Methods, 2 (2010) 851. 75. P.F. Liu and J.F. Hu, Chinese Chemical Letters, 13 (2002) 79.
76. R.G. Compton, J.C. Eklund, F. Marken, and D.N. Waller, Electrochimica Acta, 41 (1996) 315. 77. H. Langeder and G. Trettenhahn, Electrochemical process for cleaning the surfaces of metallic
workpieces, especially close to welding seams, comprises using an electrode which is oscillated with frequencies in the ultrasound region during cleaning. FRONIUS INT GMBH (FRNU-C) FRONIUS INT GMBH (FRNU-C) FRONIUS INT GMBH (FRNU-C) LANGEDER H (LANG-Individual) TRETTENHAHN G (TRET-Individual) FRONIUS INT GMBH (FRNU-C). p. 1518008.
78. R.I. Ablatinov, Instrumentation electrochemical measurements sensor - uses liquid electrode with ultrasound emitter to clean electrode from deposits. ABLATIPOV R I (ABLA-Individual). 79. S.S.M. Hassan, S.A.M. Marzouk, and H.E.M. Sayour, Talanta, 59 (2003) 1237.
80. R. Stepanek, B. Krautler, P. Schulthess, B. Lindemann, D. Ammann, and W. Simon, Analytica Chimica Acta, 182 (1986) 83.
81. P. Schulthess, D. Ammann, B. Krautler, C. Caderas, R. Stepanek, and W. Simon, Analytical Chemistry, 57 (1985) 1397.
82. P. Schulthess, D. Ammann, W. Simon, C. Caderas, R. Stepanek, and B. Krautler, Helvetica Chimica Acta, 67 (1984) 1026.
83. J.Z. Li, X.C. Wu, R. Yuan, H.G. Lin, and R.Q. Yu, Analyst, 119 (1994) 1363. 84. E. Malinowska and M.E. Meyerhoff, Analytica Chimica Acta, 300 (1995) 33.
85. U. Schaller, E. Bakker, U.E. Spichiger, and E. Pretsch, Analytical Chemistry, 66 (1994) 391. 86. R. Prasad, V.K. Gupta, and A. Kumar, Analytica Chimica Acta, 508 (2004) 61.
87. I.H.A. Badr, Analytica Chimica Acta, 570 (2006) 176.
88. D. Gao, J. Gu, R.Q. Yu, and G.D. Zheng, Analyst, 120 (1995) 499.
89. I.H.A. Badr, M.E. Meyerhoff, and S.S.M. Hassan, Analytical Chemistry, 67 (1995) 2613. 90. W. Wroblewski, Z. Brzozka, D.M. Rudkevich, and D.N. Reinhoudt, Sensors and Actuators
B-Chemical, 37 (1996) 151.
91. S. Cosnier, C. Gondran, R. Wessel, F.P. Montforts, and M. Wedel, Sensors, 3 (2003) 213.
92. M.R. Ganjali, M. Rezapour, M.R. Pourjavid, and M. Salavati-Niasari, Analytical Sciences, 19 (2003) 1127.
93. M. Shamsipur, M. Javanbakht, A.R. Hassaninejad, H. Sharghi, M.R. Ganjali, and M.F. Mousavi, Electroanalysis, 15 (2003) 1251.
94. M.R. Ganjali, S. Shirvani-Arani, P. Norouzi, M. Rezapour, and M. Salavati-Niasari, Microchimica Acta, 146 (2004) 35.
95. X.L. Su, P. Chen, X.G. Qu, W.Z. Wei, and S.Z. Yao, Microchemical Journal, 59 (1998) 341. 96. C.A. Caro, F. Bedioui, and J.H. Zagal, Electrochimica Acta, 47 (2002) 1489.
99. E. Malinowska, J. Niedziolka, and M.E. Meyerhoff, Analytica Chimica Acta, 432 (2001) 67. 100. X. Wang, E. Adams, and A. Van Schepdael, Talanta, 97 (2012) 142.
101. S.Y. Zhan, Q. Shao, L. Liu, and X.H. Fan, Biomedical Chromatography, 27 (2013) 1547. 102. L. He, K. Zhang, C. Wang, X. Luo, and S. Zhang, Journal of Chromatography A, 1218 (2011)
3595.
103. A. Ayala, L.O. Leal, L. Ferrer, and V. Cerda, Microchemical Journal, 100 (2012) 55. 104. G. Oshima and K. Nagasawa, Chemical & Pharmaceutical Bulletin, 20 (1972) 1492.
105. S. Tanabe, M. Kitahara, M. Nawata, and K. Kawanabe, Journal of Chromatography-Biomedical Applications, 424 (1988) 29.
106. T.E. Casey and R.H. Hilderman, Nitric Oxide-Biology and Chemistry, 4 (2000) 67. 107. B.L. Yuan and Q.Z. Lin, Chinese Journal of Analytical Chemistry, 28 (2000) 692. 108. X.Q. Zhan, D.H. Li, H. Zheng, and J.G. Xu, Analytical Letters, 34 (2001) 2761. 109. C.Z. Dong, Chinese Journal of Analytical Chemistry, 30 (2002) 1407.
110. X. Zhang, H. Wang, N.N. Fu, and H.S. Zhang, Spectrochimica Acta Part a-Molecular and Biomolecular Spectroscopy, 59 (2003) 1667.
111. H. Li, C.J. Meininger, and G.Y. Wu, Journal of Chromatography B, 746 (2000) 199. 112. M. Akyuez and S. Ata, Talanta, 79 (2009) 900.
113. M. Yaqoob, B.F. Biot, A. Nabi, and P.J. Worsfold, Luminescence, 27 (2012) 419.
114. H. Kodamatani, S. Yamazaki, K. Saito, T. Tomiyasu, and Y. Komatsu, Journal of Chromatography A, 1216 (2009) 3163.
115. V. Kumar, M. Banerjee, and A. Chatterjee, Talanta, 99 (2012) 610. 116. T. Rieth and K. Sasamoto, Analytical Communications, 35 (1998) 195.
117. D.Y. He, Z.J. Zhang, Y. Huang, and Y.F. Hu, Food Chemistry, 101 (2007) 667. 118. S. Fujii, T. Tokuyama, M. Abo, and A. Okubo, Analytical Sciences, 20 (2004) 209.
119. C.D. Stalikas, C.N. Konidari, and C.G. Nanos, Journal of Chromatography A, 1002 (2003) 237. 120. T. Zhang, H. Fan, and Q. Jin, Talanta, 81 (2010) 95.
121. H. Kodamatani, S. Yamazaki, K. Saito, Y. Komatsu, and T. Tomiyasu, Analytical Sciences, 27 (2011) 187.
122. L. Wang, B. Li, L. Zhang, L. Zhang, and H. Zhao, Sensors and Actuators B-Chemical, 171 (2012) 946.
123. S. Diallo, P. Bastard, P. Prognon, C. Dauphin, and M. Hamon, Talanta, 43 (1996) 359. 124. Q. Wang and C. Tan, Analytica Chimica Acta, 708 (2011) 111.
125. Q. Wang, C. Tan, H. Chen, and H. Tamiaki, Journal of Physical Chemistry C, 114 (2010) 13879.
126. Z. Zhou and Q. Wang, Sensors and Actuators B-Chemical, 173 (2012) 833. 127. J.M. Klostranec and W.C.W. Chan, Advanced Materials, 18 (2006) 1953.
128. W.C.W. Chan, D.J. Maxwell, X.H. Gao, R.E. Bailey, M.Y. Han, and S.M. Nie, Current Opinion in Biotechnology, 13 (2002) 40.
129. Z.F. Ding, B.M. Quinn, S.K. Haram, L.E. Pell, B.A. Korgel, and A.J. Bard, Science, 296 (2002) 1293.
130. X. Liu, H. Jiang, J. Lei, and H. Ju, Analytical Chemistry, 79 (2007) 8055.
131. X. Yin, Q. Chen, H. Song, M. Yang, and H. Wang, Electrochemistry Communications, 34 (2013) 81.
132. A.K. Mahapatra, G. Hazra, S.K. Mukhopadhyay, and A.R. Mukhopadhyay, Tetrahedron Letters, 54 (2013) 1164.
133. Q. Yue, L. Sun, T. Shen, X. Gu, S. Zhang, and J. Liu, Journal of Fluorescence, 23 (2013) 1313. 134. X. Yao, P. Yan, K. Zhang, and J. Li, Luminescence, 28 (2013) 551.
135. H. Liu, G. Yang, E.S. Abdel-Halim, and J.-J. Zhu, Talanta, 104 (2013) 135.
138. J.P. Wilcoxon and B.L. Abrams, Chemical Society Reviews, 35 (2006) 1162.
139. L. Jin, L. Shang, S. Guo, Y. Fang, D. Wen, L. Wang, J. Yin, and S. Dong, Biosensors & Bioelectronics, 26 (2011) 1965.
140. C.-A.J. Lin, T.-Y. Yang, C.-H. Lee, S.H. Huang, R.A. Sperling, M. Zanella, J.K. Li, J.-L. Shen, H.-H. Wang, H.-I. Yeh, W.J. Parak, and W.H. Chang, Acs Nano, 3 (2009) 395.
141. Y.-C. Shiang, C.-C. Huang, and H.-T. Chang, Chemical Communications (2009) 3437. 142. W. Chen, X. Tu, and X. Guo, Chemical Communications (2009) 1736.
143. C.-T. Chen, W.-J. Chen, C.-Z. Liu, L.-Y. Chang, and Y.-C. Chen, Chemical Communications (2009) 7515.
144. S.-Y. Lin, N.-T. Chen, S.-P. Sum, L.-W. Lo, and C.-S. Yang, Chemical Communications (2008) 4762.
145. G. Weidong, M. Mowlem, M. Kraft, and H. Morgan, IEEE Sensors Journal, 9 (2009) 862. 146. A.B. Farag, E.A. Moawed, and M.F. El-Shahar, Analytical Letters, 38 (2005) 841.
147. L.W. Gapper, B.Y. Fong, D.E. Otter, H.E. Indyk, and D.C. Woollard, International Dairy Journal, 14 (2004) 881.
148. Y.J. Fang, H. Chen, Z.X. Gao, and X.L. Jing, International Journal of Environmental Analytical Chemistry, 82 (2002) 1.
149. G. Chen, D. Yuan, Y. Huang, M. Zhang, and M. Bergman, Analytica Chimica Acta, 620 (2008) 82.
150. M. Zhang, D. Yuan, G. Chen, Q. Li, Z. Zhang, and Y. Liang, Microchimica Acta, 165 (2009) 427.
151. Z. Legnerova, P. Solich, H. Sklenarova, D. Satinsky, and R. Karlicek, Water Research, 36 (2002) 2777.
152. V.J. Sieben, C.F.A. Floquet, I.R.G. Ogilvie, M.C. Mowlem, and H. Morgan, Analytical Methods, 2 (2010) 484.
153. W.L. Daniel, M.S. Han, J.-S. Lee, and C.A. Mirkin, Journal of the American Chemical Society, 131 (2009) 6362.
154. K. Ito, R. Nomura, T. Fujii, M. Tanaka, T. Tsumura, H. Shibata, and T. Hirokawa, Analytical and Bioanalytical Chemistry, 404 (2012) 2513.
155. K. Niki, Y. Kiso, T. Takeuchi, T. Hori, T. Oguchi, T. Yamada, and M. Nagai, Analytical Methods, 2 (2010) 678.
156. T.F. Rozan and G.W. Luther, Marine Chemistry, 77 (2002) 1.
157. J.-C. Bouvier, M. Bekri, D. Mazouni, O. Schoefs, J. Harmand, T. Ribeiro, H.N. Pham, and A. Pauss, International Journal of Chemical Reactor Engineering, 6 (2008).
158. M. Fleischmann, P.J. Hendra, and McQuilla.Aj, Chemical Physics Letters, 26 (1974) 163. 159. D.L. Jeanmaire and R.P. Vanduyne, Journal of Electroanalytical Chemistry, 84 (1977) 1. 160. K. Kim, K.L. Kim, and K.S. Shin, Analyst, 137 (2012) 3836.
161. A. Ianoul, T. Coleman, and S.A. Asher, Analytical Chemistry, 74 (2002) 1458.
162. J.F. Li, Y.F. Huang, Y. Ding, Z.L. Yang, S.B. Li, X.S. Zhou, F.R. Fan, W. Zhang, Z.Y. Zhou, D.Y. Wu, B. Ren, Z.L. Wang, and Z.Q. Tian, Nature, 464 (2010) 392.
163. J.-F. Li, S.-Y. Ding, Z.-L. Yang, M.-L. Bai, J.R. Anema, X. Wang, A. Wang, D.-Y. Wu, B. Ren, S.-M. Hou, T. Wandlowski, and Z.-Q. Tian, Journal of the American Chemical Society, 133 (2011) 15922.
164. S.M. Nie and S.R. Emery, Science, 275 (1997) 1102.
165. D. Quan, R.K. Nagarale, and W. Shin, Electroanalysis, 22 (2010) 2389. 166. D. Quan and W. Shin, Sensors, 10 (2010) 6241.
167. H.S. Yin, Y.L. Zhou, T. Liu, L. Cui, S.Y. Ai, Y.Y. Qiu, and L.S. Zhu, Microchimica Acta, 171 (2010) 385.
168. R. Yue, Q. Lu, and Y.K. Zhou, Biosensors & Bioelectronics, 26 (2011) 4436.