eurostat
Theme 2
Economy and finance
Series Β
Short-term trends
ECU-EMS INFORMATION
5 -
1987
Monthly
S u m m a r y
The Statistical Office of the European Communities is providing in ECU-EMS INFORMATION
important data on the European Monetary System (EMS) and private uses of the ECU.
It includes:
I. A graph of the bilateral fluctuations of the EMS currencies.
II. Yearly and monthly ECU-denominated bond issues amounts.
III.ECU-denominated bond issues and their yields, together with interest rates for
ECU deposits.
IV. Last month ECU denominated bond issues.
V. Consumer price indices in national currencies.
VI. Consumer price indices in ECU.
eurostat
OFICINA ESTADÍSTICA DE LAS COMUNIDADES EUROPEAS
DE EUROPÆISKE FÆLLESSKABERS STATISTISKE KONTOR
STATISTISCHES AMT DER EUROPÄISCHEN GEMEINSCHAFTEN
ΣΤΑΤΙΣΤΙΚΗ ΥΠΗΡΕΣΙΑ ΤΩΝ
ΕΥΡΩΠΑΪΚΩΝ ΚΟΙΝΟΤΗΤΩΝ
STATISTICAL OFFICE OF THE EUROPEAN COMMUNITIES
OFFICE STATISTIQUE DES
COMMUNAUTÉS EUROPÉENNES
ISTITUTO STATISTICO DELLE COMUNITÀ EUROPEE
BUREAU VOOR DE STATISTIEK DER EUROPESE GEMEENSCHAPPEN
SERVIÇO DE ESTATÍSTICA DAS COMUNIDADES EUROPEIAS
L-2920 Luxembourg - Tél. 43011 - Télex: Comeur Lu 3423
B-1049 Bruxelles, bâtiment Berlaymont, rue de la Loi 200 (bureau de liaison) — Tél. 2351111
Note
For any information on the statistics in this bulletin contact Luxembourg:
Tél.
4 3 0 1 - 2 0 2 2
4 3 0 1 - 3 5 1 9
' ECSC-EEC-EAEC. Brussels - Luxembourg, 1987
Reproduction is authorized, except for commercial purposes, provided the source is acknowledged.
TABLE I
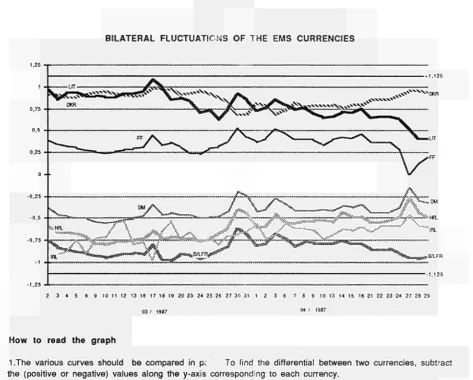
BILATERAL FLUCTUATIONS OF THE EMS CURRENCIES
1,25
9 10 11 12 13 16 17 18 19 20 23 24 25 26 27 30 31 1 2 3 6 7 8 9 10 13 14 15 16 21 22 23 24 27 28 29
How to read the graph
1 The various curves should be compared in pr To find the differential between two currencies, subtract
the (positive or negative) values along the y-axis corresponding to each currency.
2. The graph is drawn with the curve of the strongest currency above that of the weakest. It shows therefore
the relative position of each currency vis-à-vis the other currencies.
3. When two curves intersect or merge over a period of time there is no differential between the two
currencies and their market exchange rate equals their bilateral central rate.
Construction of the graph
1. The graph is drawn within a horizontal band corresponding to the maximum 2,25% margin of fluctuation
applying at any given moment to market exchange rates and the bilateral central rates of the EMS currencies,
with the exception of the LIT, which has a maximum authorized fluctuation of 6%.
This band is divided symetrically by a horizontal axis along which the points would be plotted if all currencies
were at their bilateral central rate and there were therefore no fluctuations.
2. The daily market exchange rates of all currencies are compared with the relevant bilateral central rates
and the differentials between the two calculated.
3. The maximum fluctuation between two currencies (with the exeption of the LIT) is shown within the band,
symmetrical with the horizontal axis. The fluctuations of the other currencies in relation to either of the two
currencies in question are shown within the maximum permissible fluctuation.
TABLE II
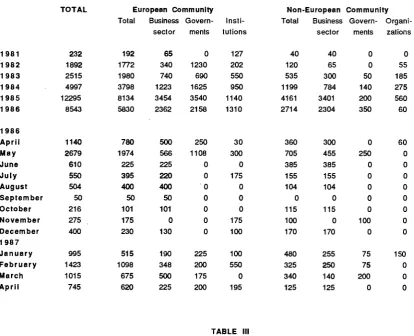
ECU BOND ISSUES (Mio ECU)
TOTAL European Community Total Business Govern-
Insti-sector ments tutions
Non-European Community Total Business Govern-
Organi-sector ments zations
1 9 8 1 1 9 8 2 1 9 8 3 1 9 8 4 1 9 8 5 1 9 8 6
1 9 8 6 A p r i l May June July August September October November December 1 9 8 7 J a n u a r y F e b r u a r y March A p r i l
232 1892 2515 4997 12295 8543 1140 2679 610 550 504 50 216 275 400 995 1423 1015 745 192 1772 1980 3798 8134 5830 780 1974 225 395 400 50 101 175 230 515 1098 675 620 65 340 740 1223 3454 2362 500 566 225 220 400 50 101 0 130 190 348 500 225 0 1230 690 1625 3540 2158 250 1108 0 0 0 0 0 0 0 225 200 175 200 127 202 550 950 1140 1310 30 300 0 175 0 0 0 175 100 100 550 0 195 40 120 535 1199 4161 2714 360 705 385 155 104 0 115 100 170 480 325 340 125 40 65 300 784 3401 2304 300 455 385 155 104 0 115 0 170 255 250 140 125 0 0 50 140 200 350 0 250 0 0 0 0 0 100 0 75 75 200 0 0 55 185 275 560 60 60 0 0 0 0 0 0 0 0 150 0 0 0 TABLE III
INTEREST RATES AND YIELDS OF ECU INVESTMENTS (%)
Deposits Bonds
1 month 3 months 6 months 1 year <5years 5-7years >7years
1 9 8 2 1 9 8 3 1 9 8 4 1 9 8 5 1 9 8 6
1 9 8 6 A p r i l May June July August September October November December 1 9 8 7 J a n u a r y F e b r u a r y March A p r i l
[image:4.595.109.524.102.438.2]TABLE IV
ECU BONDS ISSUES - APRIL
Payment
date
Borrower
(country)
Issued Issue Coupon Term Maturity Yields Lead Listing Notice
(Mio ECU) price (years) % (1) (2)
02/04/87 KBIFIMA
(Belgique /Belgio)
75,00 101,500 7,500 4 02/04/91 7,06 CSFB LX
08/04/B7 EURATOM
(Inst.Com.)
50,00 101,500 7,500 6 08/04/87 7,06 BGL LX
14/04/87 CREDITFONCEFt
(France)
150,00 101,625 7,625 7 14/04/94 7,32 Paribas LX
21/04/87 EUROFIMA
(Europe)
125,00 101,500 7,375 10 03/03/97 7,16 Société
Générale
LX
23/04/87 KINGDOM OF DENMAFIK
(Denmark)
200,00 101,375 7,250 5 23/04/92 6,92 Morgan SI LX
24/04/087 EURATOM
145,00 100,125 7,375 10 24/04/97 7,21 Parabas LX
04/87 REPUBLIC OF ITALY
(Italy)
800,00 100,000 7,750 7 04/94 7.75 Banca Italia Ml N
TABLE V
CONSUMER PRICE INDICES IN NATIONAL
CURRENCY
1980=100
B DK D ELL E F IRL î L NL Ρ UKEUR 12
EMS
1 9 6 0
3 6 , 5 2 2 , 0 4 6 , 7 2 1 , 4 1 3 , 4 2 6 , 6 1 7 , 5 1 8 , 4 4 0 , 8 3 2 , 3 1 1 , 7 1 8 , 6
2 7 , 0 3 2 , 4
1 9 7 0
4 9 , 1 3 9 , 2 6 1 , 0 2 6 , 3 2 4 , 1 3 9 , 9 2 7 , 8 2 7 , 1 5 2 , 6 4 8 , 9 1 8 , 2 2 7 , 7
3 9 , 0 4 4 , 7
1 9 8 1
107,6 111,7 106,3 124,5 114,6 113,4 120,4 117,8 108,1 106,7 120,0 111,9 112,1 111,4
1 9 8 2
117,0 123,0 111,9 150,5 131,1 126,8 141,1 137,2 118,2 112,8 147,3 121,5 124,2 123,0
1 9 8 3
126,0 131,5 115,6 181,4 147,0 139,0 155,8 157,3 128,4 115,9 184,3 127,1 134,8 133,3
1 9 8 4
134,0 139,8 118,4 2 1 4 , 6 163,5 149,2 169,2 174,3 136,7 119,6 2 3 7 , 5 133,4
144,8 142,2
1 9 8 5
140,5 146,4 121,0 256,3 178,0 158,0 178,4 190,3 142,3 122,3 284,1 141,5 153,7 149,9
1 9 8 6
142,3 151,7 120,7 315,5 193,6 162,2 185,2 2 0 1 , 4 142,7 122,7 3 1 7 , 6 146,3 159,2 153,9 0 9 142,8 153,7 120,4 324,4 197,3 162,9 185,8 202,5 142,3 122,3 3 2 0 , 5 147,1 160,0 154,3 10 142,7 154,0 120,0 332,6 198,1 163,3 185,9 203,4 142,5 123,2 322,7 147,3 160,3 154,6
1 9 8 6 11 142,6 154,4 119,9 334,9 197,6 163,5 186,2 204,4 142,5 123,3 325,5 148,5 160,7 154,9 12 142,7 154,3 120,1 337,8 198,5 163,7 186,2 205,8 142,4 123,0 331,1 149,0 161,1 155,1 01 143,3 154,6 120,6 341,5 199,9 165,2 187,3 206,3 142,6 121,3 335,1 149,6 161,9 156,0
1 9 8 7 02 143,6 154,5 120,7 342,7 200,7 165,5 189,6 207,2 142,8 121,6 338,5 150,2 162,4 156,3 03 143,7 155,9 120,7 353,6 201,9 165,8 189,6 208,0 142,8 121,9 343,2 150,5 162,8 156,7
Annual rata of increase
(%)
Β DK D ELL E F IRL
!
L NL Ρ UKEUR 12
EMS
6 1 - 7 0
3,0 6,0 2,7 2,1 6,1 4,1 4,8 4,0 2,6 4,2 4,5 4,1 3,7 3,3
7 1 - 8 0
7,4 9,8 5,1 14,5 15,4 9,7 13,7 14,1 6,7 7,4 18,7 13,8 9,9 8,4
1 9 8 1
7,6 11,7 6,3 24,5 14,6 13,4 20,4 17,8 8,1 6,7 20,0 11,9 12,1 11,4
1 9 8 2
8,7 10,1 5,3 20,9 14,4 11,8 17,2 16,5 9,3 5,7 22,7 8,6 10,8 10,4
1 9 8 3
7,7 6,9 3,3 20,5 12,1 9,6 10,4 14,7 8,6 2,7 25,1 4,6 8,5 8,4
1 9 8 4
6,3 6,3 2,4 18,3 11,2 7,3 8,6 10,8 6,5 3,2 28,9 5,0 7,4 6,7
1 9 8 5
4,9 4,7 2,2 19,4 8,9 5,9 5,4 9,2 4,1 2,3 19,6 6,1 6,1 5,4
1 9 8 6
1,3 3,6 -0,2 23,1 8,8 2,7 3,8 5,8 0,3 0,3 11,8 3,4 3,6 2,7 0 9 0,9 4,6 -0,4 22,8 9,4 2,3 3,1 5,3 -0,3 -0,4 11,8 3,0 3,4 2,3 1 0 0,9 4,5 -0,9 21,9 9,4 2,2 3,2 4,7 -1,0 -0,1 11,4 3,0 3,1 2,0
1 9 8 6
11 0,6 4,3 -1,2 19,8 8,3 2,1 3,2 4,4 -1,2 0,0 10,6 3,5 2,9 1,8 12 0,6 4,3 -1,1 17,0 8,4 2,1 3,2 4,2 -1,5 0,1 10,6 3,7 2,9 1,8 01 0,9 4,8 -0,8 15,5 6,1 3,0 3,4 4,2 -1,1 -0,9 9,8 3,9 2,9 2,1
1 9 8 7 0 2 1,1 4,8 -0,5 16,8 6,0 3,4 3,4 4,3 -0,6 -0,8 9,5 3,9 3,0 2,3 0 3 1,3 5,3 -0,2 16,8 6,2 3,4 3,4 4,2 -0,1 -0,7 9,8 4,0 3,1 2,4
Average mean deviation around the mean
EUR 12 EMS 0,8 1,0 3,5 4,0 3,7 4,4 3,9 4,0 4,2 3,9 3,3 2,8 2,4 2,3 2,7 2,0 2,8 1,9 2,7 1,9 2,6 1,9 2,6 1,8 2,2 2,1 2,2 2,0 2,1 1,9
Average deviation vis-à-vis the minimum
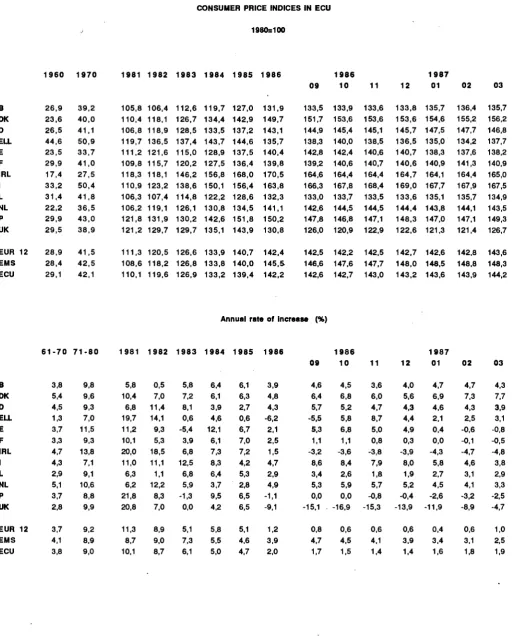
TABLE VI
CONSUMER PRICE INDICES IN ECU
1980=100
Β DK D ELL E F IRL I L NL Ρ UK EUR 12 EMS ECU1 9 6 0
2 6 , 9 23,6 2 6 , 5 44,6 23,5 29,9 17,4 3 3 , 2 31,4 2 2 , 2 2 9 , 9 2 9 , 5
2 8 , 9 28,4 29,1
1 9 7 0
3 9 , 2 4 0 , 0 4 1 , 1 5 0 , 9 3 3 , 7 4 1 , 0 2 7 , 5 50,4 4 1 , 8 3 6 , 5 4 3 , 0 3 8 , 9
4 1 , 5 4 2 , 5 4 2 , 1
1 9 8 1
105,8 110,4 106,8 119,7 111,2 109,8 118,3 110,9 106,3 106,2 121,8 121,2 111,3 108,6 110,1
1 9 8 2
106,4 118,1 118,9 136,5 121,6 115,7 118,1 123,2 107,4 119,1 131,9 129,7 120,5 118,2 119,6
1 9 8 3
112,6 126,7 128,5 137,4 115,0 120,2 146,2 138,6 114,8 126,1 130,2 129,7 126,6 126,8 126,9
1 9 8 4
119,7 134,4 133,5 143,7 128,9 127,5 156,8 150,1 122,2 130,8 142,6 135,1 133,9 133,8 133,2
1 9 8 5
127,0 142,9 137,2 144,6 137,5 136,4 168,0 156,4 128,6 134,5 151,8 143,9 140,7 140,0 139,4
1 9 8 6
131,9 149,7 143,1 135,7 140,4 139,8 170,5 163,8 132,3 141,1 150,2 130,8 142,4 145,& 142,2 0 9 133,5 151,7 144,9 138,3 142,8 139,2 164,6 166,3 133,0 142,6 147,8 126,0 142,5 146,6 142,6
1 9 8 6
10 133,9 153,6 145,4 140,0 142,4 140,6 164,4 167,8 133,7 144,5 146,8 120,9 142,2 147,6 142,7 11 133,6 153,6 145,1 138,5 140,6 140,7 164,4 168,4 133,5 144,5 147,1 122,9 142,5 147,7 143,0 12 133,8 153,6 145,7 136,5 140,7 140,6 164,7 169,0 133,6 144,4 148,3 122,6 142,7 148,0 143,2
1 9 8 7
01 135,7 154,6 147,5 135,0 138,3 140,9 164,1 167,7 135,1 143,8 147,0 121,3 142,6 148,5 143,6 02 136,4 155,2 147,7 134,2 137,6 141,3 164,4 167,9 135,7 144,1 147,1 121,4 142,8 148,8 143,9 03 135,7 156,2 146,8 137,7 138,2 140,9 165,0 167,5 134,9 143,5 149,3 126,7 143,6 148,3 144,2
Annual rata of Increase (%)
Β DK D ELL E F IRL I L NL Ρ UK EUR 12 EMS ECU
6 1 - 7 0
3,8 5,4 4,5 1,3 3,7 3,3 4,7 4,3 2,9 5,1 3,7 2,8 3,7 4,1 3,8
7 1 - 8 0
9,8 9,6 9,3 7,0 11,5 9,3 13,8 7,1 9,1 10,6 8,8 9,9 9,2 8,9 9,0
1 9 8 1
5,8 10,4 6,8 19,7 11,2 10,1 20,0 11,0 6,3 6,2 21,8 20,8 11,3 8,7 10,1
1 9 8 2
0,5 7,0 11,4 14,1 9,3 5,3 18,5 11,1 1,1 12,2 8,3 7,0 8,9 9,0 8,7
1 9 8 3
5,8 7,2 8,1 0,6 -5,4 3,9 6,8 12,5 6,8 5,9 -1,3 0,0 5,1 7,3 6,1
1 9 8 4
6,4 6,1 3,9 4,6 12,1 6,1 7,3 8,3 6,4 3,7 9,5 4,2 5,8 5,5 5,0
1 9 8 5
6,1 6,3 2,7 0,6 6,7 7,0 7,2 4,2 5,3 2,8 6,5 6,5 5,1 4,6 4,7
1 9 8 6
3,9 4,8 4,3 -6,2 2,1 2,5 1,5 4,7 2,9 4,9 -1,1 -9,1 1,2 3,9 2,0 09 4,6 6,4 5,7 -5,5 5,3 1,1 -3,2 8,6 3,4 5,3 0,0 -15,1 .
0,8 4,7 1,7
1 9 8 6
10 4,5 6,8 5,2 5,8 6,8 1,1 -3,6 8,4 2,6 5,9 0,0 -16,9 0,6 4,5 1,5 11 3,6 6,0 4,7 8,7 5,0 0,8 -3,8 7,9 1,8 5,7 -0,8 -15,3 0,6 4,1 1,4 12 4,0 5,6 4,3 4,4 4,9 0,3 -3,9 8,0 1,9 5,2 -0,4 -13,9 0,6 3,9 1,4
1 9 8 7
TABLE VII
ECU EXCHANGE RATES
B/LFR
DM
HFL
DKR
FF
LIT
IRL
UKL
DRA
PTA
ESC
USD
YEN
Yearly averages
1979 40,1651 2,51087 2,74864
1980 40,5979 2,52421 2,76027
1981 41,2946 2,51390 2,77510
1982 44,7115 2,37599 2,76139
1983 45,4380 2,27052 2,53720
1984 45,4420 2,23811 2,52334
1985 44,9136 2,22632 2,51101
1986 43,7978 2,12819 2,40089
7,20911
7,82736
7,92255
8,15687
8,13188
8,14647
8,01876
7,93565
5,82945
5,86895
6,03992
6,43117
6,77078
6,87165
6,79502
6,79976
1138,50
1189,21
1263,18
1323,78
1349,92
1381,38
1447,99
1461,87
0,669482
0,675997
0,691021
0,689605
0,714956
0,725942
0,715167
0,733526
0,646392
0,598488
0,553110
0,560454
0,587014
0,590626
0,588977
0,671542
50,774
59,323
61,624
65,342
78,088
88,340
105,739
137,425
91,967
99,702
102,676
107,558
Ì27.503
126,569
129,165
137,456
67,042
69,552
68,495
78,007
98,689
115,680
130,252
147,088
1,370650
1,392330
1,116450
0,979710
0,890220
0,789030
0,763090
0,984170
300,470
315,044
245,379
243,545
211,354
187,089
180,559
164,997
Monthly averages
8 6 / 0 4
8 6 / 0 5
8 6 / 0 6
8 6 / 0 7
8 6 / 0 8
8 6 / 0 9
8 6 / 1 0
8 6 / 1 1
8 6 / 1 2
8 7 / 0 1
8 7 / 0 2
8 7 / 0 3
8 7 / 0 4
43,9388
43,9301
43,9112
43,8846
43,6119
43,4491
43,2507
43,3336
43,2848
42,8703
42,7250
42,9877
43,0457
2,15537
2,15200
2,14931
2,13200
2,10636
2,09737
2,08328
2,08543
2,08046
2,06451
2,06346
2,07549
2,07747
2,42980 7,95167 6,83253
2,42301 7,96111 6,85609
2,41988 7,96342 6,85191
2,40224 7,97443 6,86300
2,37466 7,92728 6,86613
2,36785 7,93172 6,86813
2,35439 7,84956 6,81955
2,35617 7,86692 6,81993
2,35137 7,86392 6,83173
2,32873 7,82974 6,88127
2,32935 7,79110 6,87287
2,34399 7,81191 6,90747
2,34389 7,83099 6,91869
1476,06
1476,20
1475,09
1463,76
1450,48
1447,98
1441,57
1443,34
1443,16
1462,93
1467,89
1476,28
1482,08
0,709151
0,707099
0,709147
0,712087
0,758357
0,763423
0,764589
0,765296
0,764489
0,772101
0,775082
0,776933
0,777423
0,634113
0,634747
0,637969
0,656263
0,687097
0,698414
0,728993
0,723324
0,727245
0,737941
0,740242
0,710924
0,703822
134,843
134,731
135,326
137,054
137,706
138,947
140,735
143,294
146,629
149,845
151,337
152,166
152,918
136,612
136,753
137,410
136,177
136,982
137,713
138,594
140,126
140,625
143,981
145,359
145,667
145,614
142,412
143,870
145,208
146,961
149,209
150,779
152,837
153,845
155,210
158,473
159,973
159,862
160,708
0,950818
0,964452
0,961605
0,990211
1,021360
1,028050
1,040260
1,029360
1,044540
1,111970
1,129880
1,131730
1,147090
166,136
160,958
161,255
157,062
157,382
158,997
162,464
167,701
169,534
171,862
173,416
171,332
163,882
Dally ratas : April
0 1 / 0 4 0 2 / 0 4 0 3 / 0 4 0 6 / 0 4 0 7 / 0 4 0 8 / 0 4 0 9 / 0 4 1 0 / 0 4 1 3 / 0 4 1 4 / 0 4 1 5 / 0 4 1 6 / 0 4 2 1 / 0 4 2 2 / 0 4 2 3 / 0 4 2 4 / 0 4 2 7 / 0 4 2 8 / 0 4 2 9 / 0 4 3 0 / 0 4
EXPLANATORY NOTES
ECU exchange rates.
The exchange rates for the ECU against the national currencies of the Member States of the Community, the
United States (USD) and Japan (YEN) are shown as monthly averages and daily rates for the latest available
month.
The ECU basket, dating from 17 September 1984, is currently made up as follows:
DM FF HFL BFR LFR LIT DKR IRL UKLa) DRAa) 1ECU= 0,719 + 1,31 + 0,256 + 3,71 + 0,14 + 140 + 0,219 + 0,00871+ 0.OB78 + 1,15
Ecu central rates since 12 January 1987
DM F H R B/LFR LIT DKR IRL UKLa) DRAa) 2,05853 6,90403 2,31943 42,4582 1483,5B 7,85212 0,768411 0,739615 150,792
Weights of EMS currencies in the ECU basket (based on new central rates from 12 January 1987), in % .
DM F HFL BFR + LFR LIT DKR IRL UKLa) DRAa) 100= 34,93 18,97 11,04 9,07 9,44 2,79 1,13 11,87 0,76
a) Does not participate in the exchange mechanism
Consumer price indices in national currency
The consumer price indices in the national currency of each country measure changes in the purchasing power of
one unit of national currency spent in the country concerned.
Two composite indices are calculated, covering all the Member ates of the Community (EUR 12) and the eight
Member States with currencies participating in the European Moratary System exchange rate mechanism (EMS).
These indices are calculated as weighted arithmetic means (chain indices) of the national indices, the weighting
for each Member State being its relative share in the final consumption of households of the group of countries in
question (EUR 12, EMS), expressed in purchasing power standards, at constant prices and purchasing power
parities.
At the foot of the table, the average weighted fluctuations around the mean and the minimum are given for the
same groups of countries, with the same weightings. (These are calculated as weighted averages of the absolute
fluctuations in relation to the mean and the minimum respectively). They show the dept to which price movements
in the Member States in this Community converge.
Consumer price indices in ECU
For each country the index of consumer prices In ECU is calculated by dividing the national consumer price index
by the average movement of the national currency in relation to the ECU during the month. It measures the change
In the purchasing power of one ECU in the country concerned.
Three composite indices are calculated, covering all the Member States of the Community (EUR 12), the eight
Member States participating in the European Monetary System exchange rate mechanism (EMS) and the ten
Member States whose currencies go to make up the ECU (ECU). These indices are calculated as weighted
arithmetic means (chain indices) of the consumer price indices expressed in ECU as mentioned above.
The weightings are defined as follows:
- for the EUR 12 and EMS indices, the relative share of each Member State in the final consumption of
households for the group of countries in question (EUR 12 or EMS), expressed in ECU at current prices and
exchange rates (annual weighting).
ECU bond issues
All ECU-denominated bond issues, both national and international, are covered, together with ECU issues
offering the option of conversion into other currencies. The issues are recorded as at the payment date.
Main source: International Financing Review
Table shows, under the headings:
-Business sector and Governments: national issuers, both private and public.
-Institutions: the European Investment Bank and the Commission of the European Communities (EEC, ECSC,
Euratom).
-Organizations: the specialist institutions of the United Nations, the World Bank, the Council of Europe, etc...
Interest rates and yields on ECU investments
The interest rates for 1 , 3 and 6 month and 1 year deposits are calculated on the basis of the Friday London
market rates (source: Financial Times).
The bonds are classified according to three types of term: under 5 years, from 5 to 7 years and more than 7
years.
The redemption yields of ECU bonds are calculated each Wednesday from a sample of fixed interest bonds,
denominated in ECU and listed on the Luxemburg Stock Exchange (source: Luxemburg Stock Exchange).
The monthly and yearly averages are the unweighted arithmetic averages of these weekly rates and yields.
Venta y suscripciones ■ Salg og abonnement ■ Verkauf und Abonnement ■
Πωλήσεις και συνδρομές
Sales and subscriptions · Vente et abonnements · Vendita e abbonamenti
Verkoop en abonnementen · Venda e assinaturas
BELGIQUE/BELGIË
Moniteur belge/Belgisch Staatsblad
Rue de Louvain 40-42/Leuvensestraat 4 0 - 4 2 1 0 0 0 B r u x e l l e s / 1 0 0 0 Brussel
Tél. 5 1 2 0 0 2 6
CCP/Postrekening 0 0 0 - 2 0 0 5 5 0 2 - 2 7
Sous-dépôts/Agentschappen:
Librairie européenne/ Europese Boekhandel
Rue de la Loi 2 4 4 / W e t s t r a a t 2 4 4 1 0 4 0 B r u x e l l e s / 1 0 4 0 Brussel
CREDOC
Rue de la Montagne 34/Bergstraat 3 4 Bte 1 1 / B u s 1 1
1 0 0 0 B r u x e l l e s / 1 0 0 0 Brussel
DANMARK
Schultz EF-publikationer
Møntergade 19 1 1 1 6 København K Tlf: (01) 14 11 9 5 Girokonto 2 0 0 11 9 5
BR DEUTSCHLAND
Bundesanzeiger V e r l a g Breite Straße
Postfach 10 8 0 0 6 5 0 0 0 Köln 1 Tel. (02 21) 2 0 2 9 - 0 Fernschreiber:
ANZEIGER BONN 8 8 8 2 5 9 5 Telecopierer:
2 0 29 2 7 8
GREECE
G.C. Eleftheroudakis SA International Bookstore 4 Nikis Street
105 63 Athens Tel. 3 2 2 22 55 Telex 2 1 9 4 1 0 ELEF
Sub-agent for Northern Greece:
Molho's Bookstore
The Business Bookshop 10 Tsimiski Street Thessaloniki Tel. 2 7 5 2 7 1 Telex 4 1 2 8 8 5 LIMO
ESPANA
Boletin Oficial del Estado
Trafalgar 2 7 E - 2 8 0 1 0 Madrid Tel. (91) 4 4 6 6 0 0 0
Mundi-Prensa Libros, S.A.
Castello 37 E - 2 8 0 0 1 Madrid
Tel. (91) 4 3 1 3 3 9 9 (Libros) 4 3 1 3 2 2 2 (Suscripciones) 4 3 5 3 6 3 7 (Dirección) Télex 4 9 3 7 0 - M P L I - E
FRANCE
Service de vente en France des publications des Communautés européennes
Journal officiel
2 6 , rue Desaix 7 5 7 3 2 Paris Cedex 15 Tél. (1) 4 5 7 8 6 1 3 9
IRELAND
Government Publications Sales Office
Sun Alliance House Molesworth Street Dublin 2
Tel. 71 0 3 0 9
or by post
Stationery Office
St Martin's House Waterloo Road Dublin 4 Tel. 6 8 9 0 6 6
ITALIA
Licosa Spa
Via Lamarmora, 4 5 Casella postale 5 5 2 5 0 121 Firenze Tel. 57 97 51
Telex 5 7 0 4 6 6 LICOSA I CCP 3 4 3 5 0 9
Subagenti:
Libreria scientifica Lucio de Biasio - AEIOU
Via Meravigli, 16 2 0 123 Milano Tel. 8 0 7 6 79
Libreria Tassi
Via A. Farnese, 2 8 0 0 192 Roma Tel. 31 0 5 9 0
Libreria giuridica
Via 12 Ottobre, 172/R 16 121 Genova Tel. 59 56 9 3
GRAND-DUCHÉ DE LUXEMBOURG
Office des publications officielles des Communautés européennes
2, rue Mercier L - 2 9 8 5 Luxembourg Tél. 4 9 92 81
Télex PUBOF LU 1 3 2 4 b CCP 1 9 1 9 0 - 8 1
CC bancaire BIL 8 - 1 0 9 / 6 0 0 3 / 2 0 0
Messageries Paul Kraus
11, rue Christophe Plantin L - 2 3 3 9 Luxembourg Tél. 4 8 21 31 Télex 2 5 1 5 CCP 4 9 2 4 2 - 6 3
NEDERLAND
Staatsdrukkerij- en uitgeversbedrijf
Christoffel Plantijnstraat Postbus 2 0 0 1 4 2 5 0 0 EA 's-Gravenhage Tel. (070) 78 9 9 11
PORTUGAL
Imprensa Nacional
Av. Francisco Manuel de Melo, 5 Ρ - 1 0 0 0 Lisboa
Tel. 6 5 3 9 9 6
Distribuidora Livros Bertrand Lda. Grupo Bertrand, SARL
Rua das Terras dos Vales, 4-A Apart. 37
P - 2 7 0 0 Amadora CODEX Tel. 4 9 3 9 0 5 0 - 4 9 4 87 8 8 Telex 1 5 7 9 8 BERDIS
UNITED KINGDOM
H M Stationery Office
HMSO Publications Centre 51 Nine Elms Lane London S W 8 5DR Tel. (01) 2 1 1 5 6 56
Sub-agent:
Alan Armstrong & A s s o c i a t e s L t d 72 Park Road
London N W 1 4SH Tel. (01) 7 2 3 3 9 0 2 Telex 2 9 7 6 3 5 AAALTD G
SCHWEIZ/SUISSE/SVIZZERA
Librairie Payot 6, rue Grenus
1211 Genève Tél. 31 8 9 5 0 CCP 1 2 - 2 3 6
UNITED STATES OF AMERICA
European C o m m u n i t y I n f o r m a t i o n
Service
2 1 0 0 M Street. N W Suite 7 0 7
Washington. DC 2 0 0 3 7 Tel. (202) 8 6 2 9 5 0 0
CANADA
Renouf Publishing Co.. Ltd
61 Sparks Street Ottawa
Ontario K I P 5R1
Tel. Toll Free 1 (800) 2 6 7 4 1 6 4 Ottawa Region (613) 2 3 8 8 9 8 5 - 6
Telex 053-4936
JAPAN
K i n o k u n i y a Company Ltd
17-7 Shinjuku 3-Chome Shiniuku-ku
Tokyo 1 6 0 - 9 1 Tel. (03) 3 5 4 0 1 3 1
CACA87005ENC
g!^
OFICINA DE PUBLICACIONES OFICIALES DE LAS COMUNIDADES EUROPEAS KONTORET FOR DE EUROPÆISKE FÆLLESSKABERS OFFICIELLE PUBLIKATIONER AMT FÜR AMTLICHE VERÖFFENTLICHUNGEN DER EUROPÄISCHEN GEMEINSCHAFTEN ΥΠΗΡΕΣΙΑ ΕΠΙΣΗΜΩΝ ΕΚΔΟΣΕΩΝ ΤΩΝ ΕΥΡΩΠΑΪΚΩΝ ΚΟΙΝΟΤΗΤΩΝOFFICE FOR OFFICIAL PUBLICATIONS OF THE EUROPEAN COMMUNITIES OFFICE DES PUBLICATIONS OFFICIELLES DES COMMUNAUTÉS EUROPÉENNES UFFICIO DELLE PUBBLICAZIONI UFFICIALI DELLE COMUNITÀ EUROPEE BUREAU VOOR OFFICIËLE PUBLIKATIES DER EUROPESE GEMEENSCHAPPEN SERVIÇO DAS PUBLICAÇÕES OFICIAIS DAS-COMUNIDADES EUROPEIAS