White Rose Research Online URL for this paper:
http://eprints.whiterose.ac.uk/88691/
Version: Published Version
Article:
Gloor, EU, Barichivich, J, Ziv, G et al. (7 more authors) (2015) Recent Amazon Climate as
background for possible ongoing and future changes of Amazon humid forests. Global
Biogeochemical Cycles, 29 (9). 1384 - 1399. ISSN 0886-6236
https://doi.org/10.1002/2014GB005080
[email protected]
https://eprints.whiterose.ac.uk/
Reuse
Unless indicated otherwise, fulltext items are protected by copyright with all rights reserved. The copyright
exception in section 29 of the Copyright, Designs and Patents Act 1988 allows the making of a single copy
solely for the purpose of non-commercial research or private study within the limits of fair dealing. The
publisher or other rights-holder may allow further reproduction and re-use of this version - refer to the White
Rose Research Online record for this item. Where records identify the publisher as the copyright holder,
users can verify any specific terms of use on the publisher’s website.
Takedown
If you consider content in White Rose Research Online to be in breach of UK law, please notify us by
Recent Amazon climate as background for possible ongoing
and future changes of Amazon humid forests
M. Gloor1, J. Barichivich1,2, G. Ziv1, R. Brienen1, J. Schöngart3, P. Peylin2,
B. Barcante Ladvocat Cintra3, T. Feldpausch4, O. Phillips1, and J. Baker1
1School of Geography, Woodhouse Lane, University of Leeds, Leeds, UK,2LSCE, Saclay, France,3Instituto Nacional de
Pesquisas da Amazonia, Manaus, Brazil,4Geography, College of Life and Environmental Sciences, University of Exeter,
Exeter, UK
Abstract
Recent analyses of Amazon runoff and gridded precipitation data suggest an intensification of the hydrological cycle over the past few decades in the following sense: wet season precipitation and peak river runoff (since∼1980) as well as annual mean precipitation (since∼1990) have increased, while dry season precipitation and minimum runoff have slightly decreased. There has also been an increase in the frequency of anomalously severe floods and droughts. To provide context for the special issue on Amazonia and its forests in a warming climate we expand here on these analyses. The contrasting recent changes in wet and dry season precipitation have continued and are generally consistent with changes in catchment-level peak and minimum river runoff as well as a positive trend of water vapor inflow into the basin. Consistent with the river records, the increased vapor inflow is concentrated to the wet season. Temperature has been rising by 0.7∘C since 1980 with more pronounced warming during dry months. Suggestions for the cause of the observed changes of the hydrological cycle come from patterns in tropical sea surface temperatures (SSTs). Tropical and North Atlantic SSTs have increased rapidly and steadily since 1990, while Pacific SSTs have shifted during the 1990s from a positive Pacific Decadal Oscillation (PDO) phase with warm eastern Pacific temperatures to a negative phase with cold eastern Pacific temperatures. These SST conditions have been shown to be associated with an increase in precipitation over most of the Amazon except the south and southwest. If ongoing changes continue, we expect forests to continue to thrive in those regions where there is an increase in precipitation with the exception of floodplain forests. An increase in flood pulse height and duration could lead to increased mortality at higher levels of the floodplain and, over the long term, to a lateral shift of the zonally stratified floodplain forest communities. Negative effects on forests are mainly expected in the southwest and south, which have become slightly drier and hotter, consistent with tree mortality trends observed at the RAINFOR Amazon forest plot network established in the early 1980s consisting of approximately 150 regularly censused 1ha plots in intact forests located across the whole basin.1. Introduction
The extensive tropical rainforests of Amazonia affect the functioning of the Earth’s climate through the exchange of large amounts of water, energy, and carbon with the atmosphere [e.g.,Gash and Nobre, 1997; Silva-Dias et al., 2002;Keller et al., 2004, 2009]. During the past few decades a large research effort has been devoted to understanding the functioning of Amazonian ecosystems and their responses to deforestation, climate change, and altered fire regimes [e.g.,Gash and Nobre, 1997;Silva-Dias et al., 2002;Keller et al., 2004, 2009; Malhi et al., 2002;Malhi-and-Phillips, 2005;Huntingford et al., 2013;Phillips-and-Lewis, 2014]. As the pressure on the forests from Amazon development continues, and as global temperature keeps increasing as a result of fossil fuel burning, the AMAZONICA (“Amazon integrated Carbon Analysis”) consortium was formed in 2009 to help continue these research efforts. The consortium included seven Brazilian and seven UK research institutions. AMAZONICA combined for the first time basin-wide regular greenhouse gas observations of the lower troposphere [Gatti et al., 2014] with basin-wide regular forest censuses across a widespread 1 ha plot network [e.g.,Phillips and Lewis, 2014], comprehensive forest carbon pool measurements at a few selected sites of the network [Doughty et al., 2015], comprehensive remote sensing estimates of land use change, and fires and vegetation modeling over a period of 4 years, starting in late 2009. The outcomes of the AMAZONICA project are summarized in a special issue of which this article is one part. The purpose of this article is to
RESEARCH ARTICLE
10.1002/2014GB005080
Special Section:
Trends and Determinants of the Amazon Rainforests in a Changing World, A Carbon Cycle Perspective
Key Points:
• Amazon hydrological changes—increasing seasonal amplitude and increase in severe floods and dry conditions • Likely caused by warming of tropical
North Atlantic
• Effect of dry/hot anomalies in forest plot data visible
Supporting Information:
• Figure S1
Correspondence to:
M. Gloor, [email protected]
Citation:
Gloor, M., J. Barichivich, G. Ziv, R. Brienen, J. Schöngart, P. Peylin, B. Barcante Ladvocat Cintra, T. Feldpausch, O. Phillips, and J. Baker (2015), Recent Amazon climate as background for possible ongoing and future changes of Amazon humid forests,
Global Biogeochem. Cycles,
29, doi:10.1002/2014GB005080.
Received 30 DEC 2014 Accepted 18 JUL 2015
Accepted article online 22 JUL 2015
©2015. The Authors.
provide an update of status and recent trends of Amazonian climate as a background for the AMAZONICA studies. We also give a brief outlook on what effects on Amazonian humid forests we may expect in response to observed recent climate patterns and whether there are indeed observed signs of such effects using data from the long-term RAINFOR forest census network [Peacock et al.2007], which have been continued from 2009 to 2014 as part of the AMAZONICA project.
The carbon dynamics of Amazonian rainforests are tightly coupled with variations in the regional hydrological cycle, which is in turn significantly modulated by large-scale climate dynamics like, e.g., El Niño–Southern Oscillation (ENSO). For example, it has been reported that the severe drought in 2005 in the western Amazon has led to an increase in tree mortality in forests affected by the drought [Phillips et al., 2009]. Similarly, during the dry and warm year 2010 there was substantial carbon release to the atmosphere from the Amazon basin, while during the wet and warm year 2011 the carbon balance of the basin was neutral [Gatti et al., 2014].
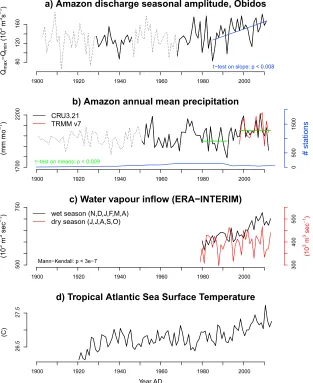
Previous analyses of Amazon River discharge and precipitation data [Gloor et al., 2013] indicate that the hydro-logical cycle of the Amazon basin has become more variable during the past three to four decades, with more frequent extreme floods (e.g., 2008/2009, 2011/2012, and 2013/2014) and strong droughts (e.g., 2005, 2007, and 2010) occurring compared to previous decades. This increase in extreme events is consistent with an upward trend in the seasonal amplitude of Amazon River discharge measured at Óbidos (Figure 1a), which drains 77% of the Amazon basin (in a strict sense) [Callède et al., 2004]. Precipitation amount has also increased over the last two to three decades (Figure 1b). There has been an increase in net annual precipitation due to an increase during the wet season in the northwestern, northern, and central parts of the basin, although there has been a small decrease during the dry season [Gloor et al., 2013]. An important exception is the com-parably small southwestern part of the basin, which overall has become drier and where dry season length has become slightly longer [Marengo et al., 2011;Fu et al., 2013]. In this paper we use the term “intensification of the hydrological cycle” to summarize these combined phenomena: an overall increase in wet season and annual precipitation, an increasing contrast between wet and dry season precipitation as well as between peak and low flows, and an increase in anomalously severe floods and droughts.
In a previous study we had tentatively attributed this intensification, at least partially, to ocean surface warming, specifically rapid warming of the tropical Atlantic over the last few decades (Figure 1d), which we had hypothesized to lead to water vapor increase in air entering the Amazon basin causing an increase in pre-cipitation (Figure 1b). In Figure 1b we have added also estimates from TRMM v7 (Tropical Rainfall Measuring Mission version 7) [Huffman et al., 2007] which cover the past 13 years, as the number of stations included by Climate Research Unit (CRU) has decreased substantially. We have not included Global Precipitation Climatology Project (GPCP) data in Figure 1b [Huffman et al., 2009], because they exhibit a particularly large drop in station numbers in the year 2000 (from 350 to 100).
The proposed mechanism for an increase in annual mean precipitation is broadly consistent with recent sim-ulations of the Climate Model Intercomparison Project 5 analyzed byKitoh et al.[2013], which suggest a future increase of precipitation for the Amazon basin and other tropical monsoonal regions concentrated in the wet season (see, e.g., their Figure 10). Precipitation in these simulations is increasing despite a slight weakening of the atmospheric overturning circulation (Hadley and Walker cells) [Allen and Ingram, 2002]. This is because the apparent increase in air water vapor content as a result of sea surface warming causes an increase in water vapor transport from sea to land which overcompensates the decrease of the air uplifting rate. This mech-anism is generally consistent with the observed pattern of amplified temperature variability over the land surface compared with sea surface temperature variability during the last few decades [Dommenget, 2009]. The latter observation has also been linked to enhanced water vapor import to continents from the oceans with the water vapor enhancing greenhouse warming on land [Compo and Sardeshmukh, 2009;Dommenget, 2009]. We also note that a recent analysis of terrestrial water storage, estimated with remote sensing of gravity anomalies byde Linage et al.[2014], reveals a substantial upward trend in terrestrial water storage in the western and central part of the basin over the past decade. Most recentlyTan et al.[2015] furthermore stressed a general increase in tropical precipitation over the last decades and used remote sensing data to show that the increase is associated with an increase in the frequency of “mesoscale-organized deep convection” events, while the frequency of less organized convection decreased.
Figure 1.(a) Maximum minus minimum monthly discharge at Óbidos gauge station, draining 77% of the Amazon basin (in a strict sense) [Callède et al., 2004]; dotted lines indicate periods when there are no data available at Óbidos and thus have been estimated byCallède et al.[2004] using upstream and downstream hydrographs, (b) annual mean precipitation over Amazon basin and Tocantins catchment combined based on the CRU 3.21 [Harris et al., 2013] climatology and TRMM v7 [Huffman et al., 2007], (c) water vapor inflow into Amazon basin based on ERA-Interim reanalysis [Dee et al., 2011] for wet and dry seasons, and (d) tropical Atlantic sea surface temperatures (5∘S to 20∘N)
calculated from the U.S. National Oceanic and Atmospheric Administration (NOAA) extended reconstructed sea surface temperature (ERSST) record [Smith et al., 2008].
should be ongoing already with drying starting in the east of the basin [White et al., 1999;Cox et al., 2000; Betts et al., 2004;Cox et al., 2008, but seeHuntingford et al., 2013]. The results suggesting an intensification of the Amazon hydrological cycle differ also from several other studies, which suggested a drying of the Amazon (Costa and Foley[1999]: analyzed period 1977–1996;Dai et al.[2009]: 1902–2008;Marengo et al. [2011]: 1925–2005;Trenberth[2011]; andHilker et al.[2014]), although in 2009 Espinoza et al. reported on a decrease of the low stage runoff in the southern subbasins, but a slight increase of the high stage runoff in the northwestern region for the period 1974 to 2004. Nonetheless together these studies have led to the general perception that the Amazon is drying.
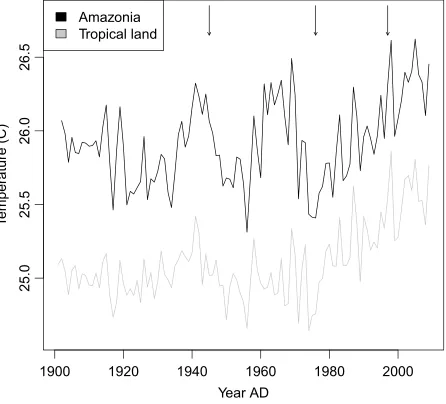
Figure 2.Tropical land temperature 20∘S to 20∘N and Amazon basin temperature. Arrows indicate when IPO/PDO (Interdecadal Pacific Oscillation/Pacific Decadal Oscillation) index changes sign.
important control on interannual variabil-ity of precipitation and runoff over the basin is tropical North Atlantic sea surface temperature (SST) anomalies [Moura and Shukla, 1981; Enfield, 1996; Enfield et al., 1999;Marengo et al., 2008;Yoon and Zheng, 2010]. Basin-wide annual precipitation and total river discharge are anticorrelated with tropical North Atlantic SST anomalies [e.g., Gloor et al., 2013, Figure 1]. The explanation of these authors is that warmer than aver-age tropical North Atlantic SSTs lock in the ITCZ (Intertropical Convergence Zone) more to the north than usual with the shift lead-ing to less overall basin-wide precipitation. Yoon and Zheng [2010] furthermore show that the effect of tropical North Atlantic SST anomalies on Amazon precipitation is concentrated to the Amazon dry season (which they define as July to October), while ENSO primarily affects the wet sea-son (December to April). Studies aiming to improve precipitation forecasting in northeastern Brazil, an important region for agricultural production, have similarly pointed out the role of the ITCZ position for precipitation and the relation between North Atlantic sea surface temperature patterns and the ITCZ [e.g.,Uvo and Nobre, 1989;Uvo et al., 1998].
One particular event with anomalously warm tropical North Atlantic temperatures occurred in 2005. It was paralleled by a strong reduction in precipitation during the end of the wet season in the central westernmost part of the basin [Espinoza Villar et al., 2011].Cox et al.[2008] were able to reproduce Atlantic and Amazon basin temperature and precipitation patterns like the one observed in 2005 in Earth system model simu-lations and found a strong tendency in their simusimu-lations “for the SST conditions associated with the 2005 drought to become more common in the future owing to continuing reductions in reflective aerosol pollution in the Northern Hemisphere.” The SST conditions they refer to are elevated temperatures in the Northern Hemisphere tropical Atlantic. The reduction in reflective aerosol pollution in turn is a consequence of stricter emission regulations in the Northern Hemisphere and has been associated with a recent “global brightening” trend at the surface [Stanhill and Cohen, 2001;Wild et al., 2005, 2009]. The climate model results thus suggest an increase of such drought-promoting conditions in the future and an important role played by atmospheric aerosol load and spatial distribution.
In this paper, we expand first on earlier climate analyses by looking at recent temperature and precipitation changes. Temperature changes are, amongst others, relevant for vegetation because of their effect on satu-ration vapor pressure and water vapor deficit, evaposatu-ration, and soil moisture status. We then analyze these changes in more detail, spatially resolving discharge trends of subbasins of the Amazon. To support our empir-ical findings pointing to a recent intensification of the hydrologempir-ical cycle, we also examine recent trends in water vapor transports into and out of the basin, as well as water vapor content above the Amazon and tropical Atlantic regions. We will further present multidecadal sea surface temperature trends, which give some indi-cations as to what may be behind the observed intensification and thus also of the timescales of the involved phenomena. In the second part of the paper we will discuss what the observed changes may mean for forest vegetation in the nearer future.
2. Recent Amazon Climate Patterns
2.1. Amazon TemperaturesFigure 4.Maximum monthly (blue), annual mean (black), and minimum monthly (red) river discharge of catchments upstream of the gauge stations indicated on the Amazon basin map. Stippled lines indicate boundaries across which we calculated water vapor transports using ERA-Interim reanalysis data [Dee et al.
2011] shown in Figure 1c and Figure 5. Black dots indicate the location of the river height gauge stations; blue dots indicate forest plot census sites of the RAINFOR network.
approximately the 1970s the Amazon seems to have experienced approximately 25 year long swings of warming and subsequent cooling with an amplitude of∼0.5∘C which are absent in the pantropical land record. Similar temperature trends have previously been reported also byVictoria et al.[1998],Malhi and Wright[2004], andCollins et al.[2009] although their analyses end earlier in time.
Spatial maps of temporal trends for CRUTS 3.21 and UDelawarev3.02 (University of Delaware Climate data set version 3.02) climatologies [Willmott and Matsuura, 2013] (Terrestrial air temperature: 1900–2010 gridded monthly time series, provided by the NOAA/Oceanic and Atmospheric Research (OAR)/Earth System Research Laboratory (ESRL) Physical Sciences Division (PSD), Boulder, Colorado, USA, from their website at http://www.esrl.noaa.gov/psd/) in Figure 3, fourth and fifth rows, furthermore suggest that the warming in the Amazon since the midseventies is slightly stronger during the dry season than the wet season. As a result of the strong multidecadal-scale variability the Amazon temperature increase over the last 100 years has been slightly less than for the rest of tropical land in agreement with an earlier temperature trend analysis byMalhi and Wright[2004].
2.2. Spatiotemporal Patterns in Precipitation and River Discharge
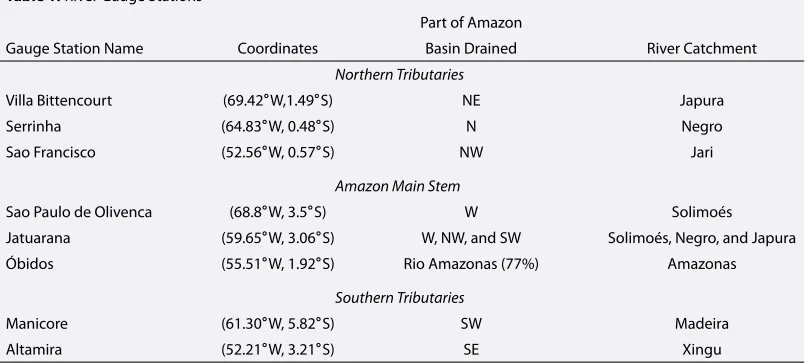
Table 1.River Gauge Stations
Part of Amazon
Gauge Station Name Coordinates Basin Drained River Catchment
Northern Tributaries
Villa Bittencourt (69.42∘W,1.49∘S) NE Japura
Serrinha (64.83∘W, 0.48∘S) N Negro
Sao Francisco (52.56∘W, 0.57∘S) NW Jari
Amazon Main Stem
Sao Paulo de Olivenca (68.8∘W, 3.5∘S) W Solimoés
Jatuarana (59.65∘W, 3.06∘S) W, NW, and SW Solimoés, Negro, and Japura
Óbidos (55.51∘W, 1.92∘S) Rio Amazonas (77%) Amazonas
Southern Tributaries
Manicore (61.30∘W, 5.82∘S) SW Madeira
Altamira (52.21∘W, 3.21∘S) SE Xingu
Meteorological Service) [Schneider et al., 2011] confirm this general pattern despite there being considerable spread among the climatologies (Figure 3). The spread is clearly illustrated by the varying ranges of grid cells with positive versus negative trends depending on the climatologies. It is also apparent that the south and southwest of the basin tend to get rather drier all year round, independent of the climatology used. The reason for the spread across different climatologies is differences in data availability, data selection criteria, and spatial interpolation methodology. The magnitude of the differences reflects the comparably coarse data density and gives a sense of the uncertainty of these fields.
Instead of using precipitation data to determine spatiotemporal precipitation variability, we may inquire what in situ riverine records tell us about recent regional precipitation patterns and whether they support earlier conclusions based on gridded precipitation data derived from a quite sparse station network and the Óbidos Amazon River discharge record alone. The Brazilian government maintains a network of river gauge stations across the Amazon basin with records freely available from http://hidroweb.ana.gov.br/. From the available records, we have identified a set of stations, which cover at least the last 30 years. The selected records mea-sure the drainage of the main subbasins of the Amazon and thus give a sense of the spatial distribution of precipitation (Figure 4). The selected sites and the basins they drain are listed in Table 1. This analysis updates the earlier work ofEspinoza Villar et al.[2009].
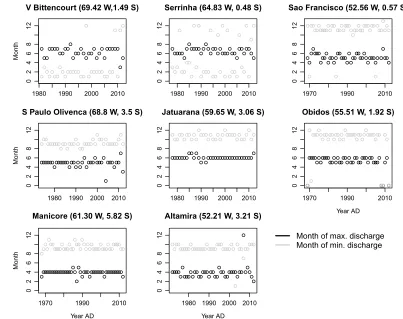
Trends in river stage levels can be caused not only by changes in precipitation amounts upstream of the gauge station but also by changes in the timing of precipitation maxima and minima in upstream subcatchments. If there are changes in timings, then at confluence the discharge from upstream may “interfere” positively or negatively, giving a false impression of net change. Thus, to avoid misinterpretation of observed trends of the Óbidos record, we have evaluated whether there are temporal shifts of maximum and minimum discharge in subcatchments upstream. There is indication of greater variation of months of maximum and minimum dis-charge over the last decade for the Solimões (central western part of Amazon basin), the Tocantins (southeast), and Japura catchments (northwest), but there are no clear trends (Figure A1). Trends in river discharge at the Óbidos gauge station, which drains a large part of the basin, are thus not due to changes in seasonal phasing of precipitation maxima and minima upstream.
We inquired then to what extent the spatiotemporal patterns suggested by precipitation (Figure 3) are con-sistent with subbasin river discharge records (Figure 4). Records from northern and central parts of the basin reveal indeed tendencies toward increased discharge, particularly during the wet season, in contrast to the southwest (Madeira catchment) which shows a decline to the comparably low 1970 values over the past few years. Overall, the subbasin river discharge records are thus quite consistent with the trends seen in gridded precipitation data and the more integrative Óbidos discharge record alone, which shows an increasing contrast between wet and dry season precipitation with a net annual increase in precipitation (Figures 1a and 1b).
Figure 5.(a) Water vapor transport into Amazon basin (across line 2 in Figure 4), (b) water vapor outflow (across line 4 in Figure 4), (c) water vapor transports across lines 1 and 3 in Figure 4, and (d) water vapor content over the Amazon basin, all based on ERA-Interim reanalysis [Dee et al., 2011].
Figure 6.(top) Sea surface temperature trends 1990–2013 based on ERSST [Smith et al., 2008]; (bottom) same as Figure 6 (top) but for 1960–1989.
latitude range: 1.5∘N,…, 31.5∘N and longitude range: 298.5∘E, …, 328.5∘E). This latter trend is also seen in stand-alone remote sensing data [Santer et al., 2007] and is consistent with expectations given recent tropical Atlantic surface warming (Figure 1d).
Sea surface warming trends over recent decades have been particularly large in the tropical and Northern Hemisphere Atlantic (Figures 6 (top) and 6 (bottom)) [Harrison and Carson, 2007] which feed the airstream entering the Amazon basin. This particularly strong warming has been attributed to global warming and variation of the northward transport rates [Robson et al., 2011], which are generally directed northward in the Atlantic and thus tend to warm the Northern Hemisphere Atlantic [e.g.,Gloor et al., 2001].
Sea surface temperatures (SSTs) influence not only water vapor content of the troposphere but also atmo-spheric circulation at large scale. Spatial maps of SST time trends (Figure 6) reveal a distinct PDO pattern (Pacific Decadal Oscillation/Interdecadal Pacific Oscillation) [Zhang et al., 1997;Folland et al., 2002] in the Pacific Ocean. During the late 1990s the PDO has switched from a negative phase with warm tropical eastern Pacific temperatures to a positive phase with cold tropical eastern Pacific temperatures. SST warming/cooling trends associated with the PDO have changed around 1990 (Figure 6). Positive phases of the PDO are asso-ciated with an increase in precipitation in the central and northern parts of the basin and a decrease in the southern parts [Marengo, 2004]. The switch of the PDO to a positive phase in the late 1990s is thus likely a sec-ond reason for the current intensification of the hydrological cycle. The combination of a strong warming of the Atlantic and the switch to a cool state of the tropical eastern Pacific has recently also been highlighted by McGregor et al.[2014] who used data and climate model simulations to demonstrate that the combined effect is an intensification of the Walker circulation characterized by an increase in air upwelling and in precipitation over the Amazon basin. As shown byYoon and Zheng[2010], warmer than usual tropical North Atlantic tem-peratures tend to cause a northward shift of the ITCZ location during the dry season and thus lead to a slight decrease in dry season precipitation in the south of the basin. We have therefore also examined whether there are trends in the ITCZ location during the dry season over the last decades using ERA-Interim near-surface winds. We found a significant although weak northward trend (not shown).
must play a role. Furthermore, since the timescales associated with the PDO and global warming are decadal or longer, they imply decadal or longer timescales for the expected future duration of the intensification.
Besides large-scale changes in the climate system, deforestation may also play some role for observed changes in precipitation, particularly the reduction of precipitation in the south. Removal and replacement of forest vegetation reduces evapotranspiration, the flux of water vapor back from the soils to the atmosphere via forest canopies, and thus causes a decrease in precipitation downwind of the deforested area. This has been examined and the magnitude of the effect estimated by several modeling studies [Salati et al., 1979; Martinelli et al., 1996;Silva Dias et al., 2002;Werth and Avissar, 2002;van der Ent et al., 2010] and more recently also quantitatively assessed with observations by combining surface land cover data measured from space with air-mass trajectories [Spracklen et al., 2012]. There have also been suggestions, although controversial, that forests change atmospheric dynamics at large scale (Makarieva and Gorshkov [2007], but seeAngelini et al.[2011]). Furthermore, deforestation in the Amazon is usually associated with biomass burning which occurs mostly during the dry season. Biomass burning changes precipitation because substantial amounts of aerosols are released which act as condensation nuclei and cause a droplet distribution characterized by comparably small droplets. Small droplets coalesce and precipitate more slowly than larger droplets [Andreae et al., 2004].
Deforestation has been particularly intense in the southwestern and western regions of the basin [e.g., Fearnside, 2005]. The catchment of the Madeira River in particular has experienced strong deforestation, mostly in the Brazilian part of the catchment [Trancoso et al., 2010] but also in the Bolivian part close to the Andes [Mueller et al., 2012]. The riverine record for the Madeira catchment (measured at Manicore, Figure 4 bottom left panel) exhibits a clear downward trend since approximately 1990. Altogether it is thus conceivable that this trend is related to deforestation via either one or both of these mechanisms, although it is probably not possible to “prove” this conclusively with existing data.
3. Possible Implications for Amazon Humid Forests
What may this mean for tropical forest functioning and well-being in the coming decades? in the follow-ing we distfollow-inguish terra firme forests, which cover most of the basin from seasonally flooded forests located along the river main stems. Unfortunately, existing data, which would permit firm conclusions, are sparse, and clearly, more studies are needed. Here we attempt to bring together what we can learn from the limited existing results.
Suggestions for terra firme forest response are provided by results on main controls and limiting factors on growth, and limited observations of recent effects of unusually dry and warm episodes in parts of the basin. Field studies measuring carbon and water fluxes as well as incoming photosynthetically active radiation sug-gest that in the eastern and central parts close to the equator (approximately 5∘S to 5∘N) forests are mostly light limited [Costa et al., 2009;Restrepo-Coupe et al., 2013]. An important reason are deep roots (reaching up to 10 m depth and more [Nepstad et al., 1994]) permitting access to a large “Plant Available Water” pool. Our knowledge about rooting depth throughout the basin is limited. Nonetheless, recent soil surveys of Quesada et al.[2011] reveal that deep roots occur mainly in the region just mentioned where soils are deep, well-developed oxisols (ferralsols) (soil map in Figure 4 and rooting/soil depth in Figure 22 ofQuesada et al. [2011]). This survey also reveals that northwestern, western, and southwestern soils are comparably shallow and so is rooting depth [Quesada et al., 2011, Figures 4 and 22].
Experimental data on drought response exist just for two forest sites in the eastern tropical Amazon, at Caxiuanã National Forest and Tapajós National forest [da Costa et al., 2010;Nepstad et al., 2007]. At these sites soils and rooting depth are deep. Continued imposed forest drought experiments at these sites had, not so surprisingly, only substantial effects after 3 to 4 years [Nepstad et al., 2002,da Costa et al., 2010] with several years of artificial drought affecting primarily the tallest trees.
Based on the controls on terra firme ecosystem functioning just discussed and recent observed climate pat-terns, we would thus expect most negative effects of observed climate patterns in regions which experience some drying trend and which have comparably shallow soils. The candidate regions for such negative effects are thus primarily southwestern and southern parts of the basin. By negative effects we mean effects which may lead to substantial changes in forest functioning and shifts in species composition.
Recent observational (as opposed to experimental) studies of terra firme forest response to the recent strong climate variations in the basin have revealed the following. In 2005 the westernmost part of the Brazilian Amazon received substantially less rain than usual during the wet season (∼25% reduction at the end of the wet season) causing a severe water deficit in the southern part of this region during the dry season [Espinoza Villar et al., 2011;Phillips et al., 2009]. Forest census plot remeasurements before and after the event suggest this has caused an increase in tree mortality [Phillips et al., 2009] but no substantial change in forest growth rates. An analysis of backscatter data from the SeaWinds Scatterometer (operating in the microwave, 13.4 GHz) on the QuickSCAT satellite, interpreted as measuring changes in forest canopies/biomass, suggest changes in canopy biomass, probably by loss of branches (D. Schimel, personal communication, 2014), and that these changes are noticeable until 2010, suggesting quite substantial changes of tree canopies as a consequence of the 2005 drought [Saatchi et al.2013]. The year 2010 was another rather dry year and with elevated temper-atures by up to 1.5∘C compared to the 1981–2010 mean, while 2011 was a wet year with similarly elevated temperatures. Atmospheric greenhouse gas balances for 2010 and 2011 suggest a strong decrease in carbon fixation at the end of the dry season in parts of the basin with also elevated losses due to fires compared to 2011 [Gatti et al., 2014]. These large-scale integrating results are consistent with comprehensive on-ground biometric carbon pool measurements at 14 sites, suggesting similar down regulation of carbon fixation during unusually hot and dry months in parts of the basin which experienced unusually dry conditions [Gatti et al., 2014;Doughty et al., 2015].
To examine whether our expectations of terra firme forest response to recent large-scale climate patterns is supported by observations, we analyzed data of biomass dynamics from the RAINFOR inventory plot network [Peacock et al., 2007] in the Amazon basin with sites shown in Figure 4 (blue dots). As already mentioned this network consists of permanent inventory plots established in forests that lack signs of anthropogenic distur-bance. These plots cover a range of climates—in particular, several of the sites are in regions where we expect negative effects on the forests. Within the plots (usually 1 ha in size), all trees with stem diameter greater than 100 mm were identified and measured repeatedly to record changes in biomass dynamics over time until they die. For each plot, we calculated biomass mortality between censuses as the amount of biomass that is lost on an annual basis—by determining whether trees are alive or dead. Biomass of trees was calculated by applying allometric equations that included diameter, height, and wood density [Feldpausch et al., 2012]. For our purposes we selected those plots (approximately 80) that were monitored for at least 10 years and contained three or more census intervals with at least one interval in the 1990s and one in 2000s similar as inBrienen et al.[2015]. The mean monitoring time for each plot is 21 years, and the mean number of census intervals is 6.5. For this set of plots, we calculated the long-term mortality trends using linear regressions, taking into account “errors inxandy” using the algorithm ofYork et al.[2004]. For errors inx(time) we assumed a uniform distribution for the probability that trees die during a census interval; thus, the uncertainty is�∕√12
where�is the census interval length; for errors iny(mortality) we combine errors from (i) a lack of knowledge
when in a census interval a tree died and thus how much biomass the tree had at time of death, (ii) the uncer-tainty in allometry which we estimate based onFeldpausch et al.[2012], and (iii) errors during field work like missing trees. Mortality time trends estimated for plots located close to one another (distance<5 km) were
Figure 7.Tree mortality trends at RAINFOR forest plot census sites located in the Amazon basin (blue dots in Figure 4) versus precipitation trends at these sites taken from CRUTS 3.21 [Harris et al., 2013].
drying trend. This result is described inBrienen et al.[2015] who hypothesized that it is caused by a lagged demographic effect of past and ongoing growth stimulation on tree turnover times of Amazon rainforests.
A main characteristic of recent changes of the hydrological cycle is an increase in wet season precipitation, not a drying. This raises the obvious question as to what the effects of wetting may be. The general expectation for terra firme forests is that these changes have a near-neutral effect. Possibly, there may be some reduction in productivity as a result of an increase in cloudiness associated with the precipitation increase, and reduc-tion in available sunlight for photosynthesis [Graham et al., 2003]. In contrast to terra firme forests, we expect a stronger direct effect on seasonally flooded forests because the increase in wet season precipitation will cause an increase in the amplitude and duration of the seasonal flood pulse. Seasonally flooded forests are dormant during the flooded period, but an increased flood pulse duration may lead to tree death [Piedade et al., 2013]. Unfortunately, again, existing data on the effect of a prolonged and higher amplitude seasonal flood pulse are very sparse [Piedade et al., 2013]. Nonetheless, based on the work of the same authors some suggestions of expected effects can be derived. Floodplain forest communities are known to exhibit a clear “zonation” par-allel to the river main stem. Trees farther away from the main stem are increasingly less adapted to unusually long flooding periods, and thus, an increase in the peak height of the flood pulse may increase mortality for some species [e.g.,Wittmann et al., 2004]. On a long term an increase in the flood pulse is expected to cause an upward shift of these forest communities, possibly causing also a decline in species richness, because some of the communities may not be able to keep up with the pace of the changes [Wittmann et al., 2004].
Table 2.Data Sets Used in This Study
Variable Data Set Reference
Precipitation CRU 3.21 (Climate Research Unit) Harris et al.[2013]
UDelaware v3.02 Willmott and Matsuura;
see alsoNickl et al.[2010]
GPCP v6 Huffman et al.[2009]
TRMM v7, remote sensing Huffman et al.[2007]
River discharge Agencia Nacional de águas (ANA), Brazil (http://hidroweb.ana.gov.br)
Water vapor ERA-Interim Dee et al.[2011]
Microwave Remote sensing Santer et al.[2007]
Temperature
(a) Land CRU 3.21 Harris et al.[2013]
UDelaware v3.02 Willmott and Matsuura
see alsoNickl et al.[2010]
(b) Sea surface ERSST Smith et al.[2008]
[image:13.612.175.573.513.745.2]4. Summary and Conclusions
We have analyzed precipitation and temperature variation of the Amazon basin over the last few decades using various datasets summarized in Table 2. Riverine records and climatologies show an increase in precip-itation in most of the basin, except the southwest and some of the south. The increase is concentrated in the wet season, while there is a slight reduction in precipitation during the dry season. There is also an increase in the frequency of extreme floods and drier than usual conditions over the same period. The precipitation trends are in agreement with trends of net water vapor transport into the basin, which is increasing, and the increased water vapor inflow is concentrated in the wet season. Climatologies show that the basin has expe-rienced strong warming over approximately the last three and a half decades (since 1980). Spatial maps of the sea surface temperature trend over several decades pre-1990 and post-1990 reveal strong warming in the tropical North Atlantic over the last decades and a switch from a negative to a positive PDO warming/cooling pattern around 1990. Both the implied increased surface pressure differences between tropical North Atlantic and tropical eastern Pacific and the increase in water vapor over the tropical North Atlantic are consistent with the observed intensification of the hydrological cycle [McGregor et al., 2014].
Overall, an increase in precipitation is likely to have a neutral effect on forests (although very large increases in precipitation would likely lead to some decrease in forest productivity [Schuur, 2003])—with the exception of flood plain forests where the increased amplitude of the flood pulse is expected to lead to shifts of the forest communities. Main negative effects of the increasing climate variability on forests will likely be via occasional drier and hotter episodes particularly in those regions which have experienced a slight drying trend, i.e., the southwest and south of the basin. There are indeed indications from regular censuses of a pan-Amazonian forest plot network (RAINFOR) that there is a link between increased tree mortality and hotter/drier conditions.
Appendix A
[image:14.612.164.567.404.723.2]Examination whether changes of the seasonal amplitude of Amazon river discharge observed at Obidos may be due to changes in the seasonality of river discharge of the rivers feeding the Amazon mainstem.
References
Allen, M. R., and W. J. Ingram (2002), Constraints on future changes in the hydrological cycle,Nature,419, 224–228.
Andreae, M. O., D. Rosenfeld, P. Artaxo, A. A. Costa, G. P. Frank, K. M. Longo, and M. A. F. Silva-Dias (2004), Smoking rain clouds over the Amazon,Science,303, 1337–1342.
Angelini, I. M., M. Garstang, R. E. Davis, B. Hayden, D. R. Fitzjarrald, D. R. Legates, S. Greco, S. Macko, and V. Connors (2011), On the coupling between vegetation and the atmosphere,Theor. Appl. Climatol.,105, 243–261, doi:10.1007/s00704-010-0377-5.
Betts, R. A., P. M. Cox, M. Collins, P. P. Harris, C. Huntingford, and C. D. Jones (2004), The role of ecosystem-atmosphere interactions in simulated Amazonian precipitation decrease and forest dieback under global climate warming,Theor. Appl. Climatol.,78, 157–175. Bordi, I., R. De Boni, K. Fraedrich, and A. Sutera (2014), Interannual variability patterns of the world’s total column water content: Amazon
River basin,Theor. Appl. Climatol.,118, 1–15, doi:10.1007/s00704-014-1304-y.
Brienen, R., et al. (2015), Long-term decline of the Amazon carbon sink,Nature,519, 344–348.
Callède, J., J. L. Guyot, J. Ronchail, Y. L’Hote, H. Niel, and E. D. Oliveira (2004), Evolution du débit de l’Amazone á Óbidos de 1903 á 1999,
Hydrol. Sci. J.,49, 85–97.
Collins, J. M., R. R. Chaves, and V. da Silva Marques (2009), Temperature variability over South America,J. Clim.,22, 5854–5869. Compo, G. P., and P. D. Sardeshmukh (2009), Oceanic influences on recent continental warming,Clim. Dyn.,32, 333–342. Costa, M. H., and J. A. Foley (1999), Trends in the hydrologic cycle of the Amazon basin,J. Geophys. Res.,104(D12), 14,189–14,198. Costa, M. H., M. T. Coe, and J.-L. Guyot (2009), Effects of climatic variability and deforestation on surface water regimes, inAmazonia and
Global Change, Geophys. Monogr. Ser., vol. 186, edited by M. Keller et al., pp. 543–553, AGU, Washington, D. C.
Cox, P. M., R. A. Betts, C. D. Jones, S. A. Spall, and I. J. Totterdell (2000), Acceleration of global warming due to carbon-cycle feedbacks in a coupled climate model,Nature,408, 184–187.
Cox, P. M., P. P. Harris, C. Huntingford, R. A. Betts, M. Collins, C. D. Jones, T. E. Jupp, J. A. Marengo, and C. A. Nobre (2008), Increasing risk of Amazonian drought due to decreasing aerosol pollution,Nature,453, 212–215.
da Costa, A. C. L., et al. (2010), Effect of 7 yr of experimental drought on vegetation dynamics and biomass storage of an eastern Amazonian rainforest,New Phytol.,187, 579–591, doi:10.1111/j.1469-8137.2010.03309.x.
Dai, A., T. Qian, K. E. Trenberth, and J. D. Milliman (2009), Changes in continental freshwater discharge from 1948 to 2005,J. Clim.,22, 2773–2792, doi:10.1175/2008JCLI2592.1.
Dee, D. P., et al. (2011), The ERA-Interim reanalysis: Configuration and performance of the data assimilation system,Q. J. R. Meteorol. Soc.,
137, 553–597, doi:10.1002/qj.828.
de Linage, C., J. S. Famiglietti, and J. T. Randerson (2014), Statistical prediction of terrestrial water storage changes in the Amazon basin using tropical Pacific and North Atlantic sea surface temperature anomalies,Hydrol. Earth Syst. Sci.,18, 2089–2102.
Dommenget, D. (2009), The ocean’s role in continental climate variability and change,J. Clim.,22, 4939–4952. Doughty, C. E., et al. (2015), Drought impact on forest carbon dynamics and fluxes in Amazonia,Nature,519, 78–82.
Enfield, D. B. (1996), Relationships of inter-American rainfall to Atlantic and Pacific SST variability,Geophys. Res. Lett.,23, 3305–3308. Enfield, D. B., A. M. Mestas-Nuñez, D. A. Mayer, and L. Cid-Serrano (1999), How ubiquitous is the dipole relationship in tropical Atlantic sea
surface temperatures?,J. Geophys. Res.,104, 7841–7848.
Espinoza Villar, J. C., J. L. Guyot, J. Ronchail, G. Cochonneau, N. P. Filizola, P. Fraizy, D. Labat, E. De Oliveira, J. J. Ordoñez Gálvez, and P. Vauchel (2009), Contrasting regional discharge evolutions in the Amazon basin (1974–2004),J. Hydrol.,375, 297–311.
Espinoza Villar, J. C., J. Ronchail, J. L. Guyot, C. Junquas, P. Vauchel, W. S. Lavado Casimiro, G. Drapeau, and R. Pombosa Loza (2011), Climate variability and extreme drought in the upper Solimões River (Western Amazon basin): Understanding the exceptional 2010 drought,
Geophys. Res. Lett.,38, L13406, doi:10.1029/2011GL047862.
Fearnside, P. M. (2005), Deforestation in Brazilian Amazonia: History, rates, and consequences,Conserv. Biol.,19, 680–688. Feldpausch, T. R., et al. (2012), Tree height integrated into pantropical forest biomass estimates,Biogeosciences,9, 3381–3403.
Folland, C. K., J. A. Renwick, M. J. Salinger, and A. B. Mullan (2002), Relative influences of the Interdecadal Pacific Oscillation and ENSO on the South Pacific Convergence Zone,Geophys. Res. Lett.,29(13), 1643, doi:10.1029/2001GL014201.
Fu, R., et al. (2013), Increased dry-season length over southern Amazonia in recent decades and its implication for future climate projection,
Proc. Natl. Acad. Sci.,110, 18,110–18,115.
Gash, J. H. C., and C. A. Nobre (1997), Climatic effects of Amazonian deforestation: Some results from ABRACOS,Bull. Am. Meteorol. Soc.,78, 823–830.
Gatti, L. V., et al. (2014), Drought sensitivity of Amazonian carbon balance revealed by atmospheric measurements,Nature,506, 76–80, doi:10.1038/nature12957.
Gloor, M., N. Gruber, T. M. C. Hughes, and J. L. Sarmiento (2001), Estimating net air-sea fluxes from ocean bulk data: Methodology and application to the heat cycle,Global Biogeochem. Cycles,15, 767–782.
Gloor, M., R. J. W. Brienen, D. Galbraith, T. R. Feldpausch, J. Schöngart, J.-L. Guyot, J. C. Espinoza, J. Lloyd, and O. L. Phillips (2013), Intensification of the Amazon hydrological cycle over the last two decades,Geophys. Res. Lett.,40, 1729–1733, doi:10.1002/grl.50377. Graham, E. A., S. S. Mulkey, K. Kitajima, N. G. Phillips, and S. J. Wright (2003), Cloud cover limits net CO2uptake and growth of a rainforest
tree during tropical rainy seasons,Proc. Natl. Acad. Sci.,100(2), 572–576.
Harris I., T. J. Jones, T. J. Osborn, and D. H. Lister (2013), Updated high-resolution grids of monthly climatic observations—The CRU TS3.10 Dataset,Int. J. Climatol.,34(3), 623–642, doi:10.1002/joc.3711.
Harrison, D. E., and M. Carson (2007), Is the world ocean warming? Upper-ocean temperature trends: 1950–2000,J. Phys. Oceanogr.,37, 174–187.
Hilker, T., A. I. Lyapustin, C. J. Tucker, F. G. Hall, R. B. Myneni, Y. Wang, J. Bi, Y. Mendes de Moura, and P. J. Sellers (2014), Vegetation dynamics and rainfall sensitivity of the Amazon,Proc. Natl. Acad. Sci.,111(45), 16,041–16,046, doi:10.1073/pnas.1404870111.
Huffman, G. J., R. F. Adler, D. T. Bolvin, G. Gu, E. J. Nelkin, K. P. Bowman, Y. Hong, E. F. Stocker, and D. B. Wolff (2007), The TRMM multi-satellite precipitation analysis: Quasi-global, multi-year, combined-sensor precipitation estimates at fine scale,J. Hydrometeorol.,8, 38–55. Huffman, G. J., R. F. Adler, D. T. Bolvin, and G. Gu (2009), Improving the global precipitation record: GPCP version 2.1,Geophys. Res. Lett.,36,
L17808, doi:10.1029/2009GL040000.
Huntingford, C., et al. (2013), Stability of tropical rainforests under a changing climate,Nat. Geosci.,6, 268–273, doi:10.1038/ngeo1741. Keller, M., et al. (2004), Ecological research in the large-scale biosphere—Atmosphere experiment in Amazonia: Early results,Ecol. Appl.,14,
3–16, doi:10.1890/03-6003.
Keller, M., M. Bustamante, J. Gash, and P. S. Dias (Eds.) (2009),Amazonia and Global Change, AGU, Washington, D. C.
Kennedy, J. J., N. A. Rayner, R. O. Smith, M. Saunby, and D. E. Parker (2011), Reassessing biases and other uncertainties in sea-surface tem-perature observations since 1850: Part 1. Measurement and sampling errors,J. Geophys. Res.,116, D14103, doi:10.1029/2010JD015218.
Acknowledgments
We acknowledge the generosity of climate and river runoff data providers used in this study. Specifically, we acknowledge the Climatic Research Unit, University of East Anglia (data available from http://www.cru.uea.ac.uk/cru/data), the climate scientists preparing the University of Delaware Temperature and Precipitation data which are provided by NOAA/OAR/ESRL PSD, Boulder, Colorado, USA, from their Web site at http://www.esrl.noaa.gov/ psd/, and the Brazilian hydrological service ANA (Agencia Nacional de Aguas, Brasilia/ National Agency for Water, Brazil; data available from http://hidroweb.ana.gov.br/—station codes can be found on http://www2. ana.gov.br/Paginas/servicos/ informacoeshidrologicas/redehidro. aspx; to retrieve data click on “Series Historias” and follow from there). PDO index can be downloaded from http://jisao.washington.edu and ENSO index, e.g., from
Kitoh, A., H. Endo, K. K. Kumar, I. F. A. Cavalcanti, P. Goswami, and T. Zhou (2013), Monsoons in a changing world: A regional perspective in a global context,J. Geophys. Res. Atmos.,118, 3053–3065, doi:10.1002/jgrd.50258.
Makarieva, A. M., and V. G. Gorshkov (2007), Biotic pump of atmospheric moisture as driver of the hydrological cycle on land,Hydrol. Earth Syst. Sci.,11, 1013–1033.
Malhi, Y., and O. L. Phillips (Eds.) (2005),Tropical Forests and Global Atmospheric Change, 356 pp., Oxford Univ. Press, Oxford, U. K. Malhi, Y., and J. A. Wright (2004), Spatial patterns and recent trends in the climate of tropical forest regions,Philos. Trans. R. Soc. B,359,
311–329.
Malhi, Y., et al. (2002), An international network to monitor the structure, composition and dynamics of Amazonian forests (RAINFOR),
J. Veg. Sci.,13(3), 439–450.
Marengo, J. A. (2004), Interdecadal variability and trends of rainfall across the Amazon basin,Theor. Appl. Climatol.,78, 79–96, doi:10.1007/s00704-004-0045-8.
Marengo, J. A., C. A. Nobre, J. Tomasella, M. F. Cardoso, and M. D. Oyama (2008), Hydro-climatic and ecological behaviour of the drought of Amazonia in 2005,Philos. Trans. R. Soc. B,363, 1773–1778, doi:10.1098/rstb.2007.0015.
Marengo, J. A., J. Tomasella, L. M. Alves, W. R. Soares, and D. A. Rodriguez (2011), The drought of 2010 in the context of historical droughts in the Amazon region,Geophys. Res. Lett.,38, L12703, doi:10.1029/2011GL047436.
Martinelli, L., R. L. Victoria, L. S. L. Sternberg, and M. Z. Moreira (1996), Using stable isotopes to determine sources of evaporated water to the atmosphere in the Amazon basin,J. Hydrol.,183, 191–204.
McGregor, S., A. Timmermann, M. F. Stuecker, M. H. England, M. Merrifield, F.-F. Jin, and Y. Chikamoto (2014), Recent Walker circulation strengthening and Pacific cooling amplified by Atlantic warming,Nat. Clim. Change,4, 888–892, doi:10.1038/NCLIMATE2330. Moura, A. D., and J. Shukla (1981), On the dynamics of droughts in northeast Brazil: Observations, theory and numerical experiments with a
general circulation model,Atmos. Sci.,38, 2653–2675.
Mueller, R., D. Mueller, F. Schierhorn, G. Gerold, and P. Pacheco (2012), Proximate causes of deforestation in the Bolivian lowlands: An analysis of spatial dynamics,Reg. Environ. Change,12, 445–459, doi:10.1007/s10113-011-0259-0.
Nepstad, D. C., C. R. de Carvalho, E. A. Davidson, P. H. Jipp, P. A. Lefebvre, G. H. Negreiros, E. D. de Silva, T. A. Stone, S. E. Trumbore, and S. Vieira (1994), The role of deep roots in the hydrological and carbon cycles of Amazonian forest and pasture,Nature,372, 666–669. Nepstad, D. C., et al. (2002), The effects of partial throughfall exclusion on canopy processes, aboveground production, and
biogeochemistry of an Amazon forest,J. Geophys. Res.,107(D20), 8085, doi:10.1029/2001JD000360.
Nepstad, D. C., I. M. Tohver, D. Ray, P. Moutinho, and G. Cardinot (2007), Mortality of large trees and lianas following experimental drought in an Amazon forest,Ecology,88, 2259–2269.
Nickl, E., C. J. Willmott, K. Matsuura, and S. M. Robeson (2010), Changes in annual land-surface precipitation over the twentieth and early twenty-first century,Ann. Assoc. Am. Geogr.,100, 729–739.
Peacock, J., T. R. Baker, S. L. Lewis, G. Lopez-Gonzalez, and O. L. Phillips (2007), The RAINFOR database: Monitoring forest biomass and dynamics,J. Veg. Sci.,18, 535–542.
Phillips, O. L., et al. (2009), Drought sensitivity of the Amazon rainforest,Science,323, 1344–1347.
Phillips, O. L., and S. L. Lewis (2014), Evaluating the tropical forest carbon sink (2014),Global Change Biol.,20, 2039–2041, doi:10.1111/gcb.12423.
Piedade, M. T. F., J. Schoengart, F. Wittmann, P. Parolin, and W. J. Junk (2013), Impactos da Inundacao e Seca na Vegtacao de Areas Alagaveis Amazonicas, inSecas na Amazonia, Causas e Consequencias, edited by L. De Simone Borma and C. A. Nobre, pp. 268–304, Oficina de Textos, Sao Paulo, Brazil.
Quesada, C. A., J. Lloyd, L. O. Anderson, N. M. Fyllas, M. Schwarz, and C. I. Czimczik (2011), Soils of Amazonia with particular reference to the RAINFOR sites,Biogeosciences,8, 1415–1440, doi:10.5194/bg-8-1415-2011.
Restrepo-Coupe, N., et al. (2013), What drives the seasonality of photosynthesis across the Amazon basin? A cross-site analysis of eddy flux tower measurements from the Brasil flux network,Agric. For. Meteorol.,182–183, 128–144.
Robson, J., R. Sutton, K. Lohmann, D. Smith, and M. D. Palmer (2011), Causes of the rapid warming of the North Atlantic Ocean in the mid-1990s,J. Clim.,25, 4116–4134.
Saatchi, S. S., S. Asefi-Najafabady, Y. Malhi, L. E. O. C. Aragao, L. O. Andeerson, R. B. Myneni, and R. Nemani (2013), Persistent effects of a severe drought on Amazoniasn forest canopy,Proc. Natl. Acad. Sci. U.S.A,110, 565–570, doi:10.1073/pnas.1204651110.2013. Salati, E., A. Dall’Olio, E. Matsui, and J. R. Gat (1979), Recycling of water in the Amazon basin: An isotopic study,Water Resour. Res.,15,
1250–1258.
Santer, B. D., et al. (2007), Identification of human-induced changes in atmospheric moisture content,Proc. Natl. Acad. Sci.,104, 15,248–15,253.
Schneider, U., A. Becker, P. Finger, A. Meyer-Christoffer, B. Rudolf, and M. Ziese (2011), GPCC full data reanalysis version 6.0 at 2.5∘: Monthly land-surface precipitation from rain-gauges built on GTS-based and historic data, doi:10.5676/DWD_GPCC/FD_M_V6_05.
Schuur, E. A. G (2003), Productivity and Global Climate revisited: The sensitivity of tropical forest growth to precipitation,Ecology,84(5), 1165–1170.
Silva Dias, M. A. F., et al. (2002), Cloud and rain processes in a biosphere-atmosphere interaction context in the Amazon region,J. Geophys. Res.,107(D20), 8072, doi:10.1029/2001JD000335.
Smith, T. M., R. W. Reynolds, T. C. Peterson, and J. Lawrimote (2008), Improvements to NOAAs historical merged land-ocean surface temperature analysis (1880–2006),J. Clim.,21, 2283–2296.
Spracklen, D. V., S. R. Arnold, and C. M. Taylor (2012), Observations of increased tropical rainfall preceded by air passage over forests,Nature,
489, 282–285.
Stanhill, G., and S. Cohen (2001), Global dimming: A review of the evidence for a widespread and significant reduction in global radiation with discussion of its probable causes and possible agricultural consequences,Agric. For. Meteorol.,107, 255–278.
Tan, J., C. Jakob, W. B. Rossow, and G. Tselioudis (2015), Increases in tropical rainfall driven by changes in frequency of organized deep convection,Nature,519, 451–454.
Trancoso, R., A. Carneiro Filho, J. Tomasella, J. Schietti, B. R. Forsberg, and R. P. Miller (2010), Deforestation and conservation in major watersheds of the Brazilian Amazon,Environ. Conserv.,36, 277–288, doi:10.1017/S0376892909990373.
Trenberth, K. E. (2011), Changes in precipitation with climate change,Clim. Res.,47, 123–138.
Uvo, C. B., C. A. Repelli, S. E. Zebiak, and Y. Kushnir (1998), The relationship between tropical Pacific and Atlantic SST and Northeast Brazil monthly precipitation,J. Clim.,11, 551–562.
van der Ent, R. J., H. H. Savenije, B. Schaefli, and S. S. SteeleDunne (2010), Origin and fate of atmospheric moisture over continents,Water Resour. Res.,46, W09525, doi:10.1029/2010WR009127.
Victoria, R. L., L. A. Martinelly, J. M. Moraes, M. V. Ballister, A. V. Krusche, G. Pellegrino, R. M. B. Almeida, and J. E. Richey (1998), Surface air temperature variations in the Amazon region and its borders during this century,J. Clim.,11, 1105–1110.
Werth, D., and R. Avissar (2002), The local and global effects of Amazon deforestation,J. Geophys. Res.,107(D20), 8087, doi:10.1029/2001JD000717.
White, A., M. G. R. Cannell, and A. D. Friend (1999), Climate change impacts on ecosystems and the terrestrial carbon sink: A new assessment,Global Environ. Change,9, 21–30.
Wild, M., H. Gilgen, A. Roesch, A. Ohmura, C. N. Long, E. G. Dutton, B. Forgan, A. Kallis, V. Russak, and A. Tsvetkov (2005), From dimming to brightening: Decadal changes in solar radiation at Earth´s Surface,Science,308, 847–850.
Wild, M., B. Trüssel, A. Ohmura, C. N. Long, G. König-Langlo, E. G. Dutton, and A. Tsvetkov (2009), Global dimming and brightening: An update beyond 2000,J. Geophys. Res.,114, D00D13, doi:10.1029/2008JD011382.
Willmott, C. J., and K. Matsuura (2013),Terrestrial Air Temperature: 1900–2010 Gridded Monthly Time Series, NOAA/OAR/ESRL PSD, Boulder, Colo. [Available at http://www.esrl.noaa.gov/psd/.]
Wittmann, F., W. J. Junk, and M. T. F. Piedade (2004), The várzea forests in Amazonia: Flooding and the highly dynamic geomorphology interact with natural forest succession,For. Ecol. Manage.,196, 199–212.
Yoon, J.-H., and N. Zheng (2010), An Atlantic influence on Amazon rainfall,Clim. Dyn.,34, 249–264, doi:10.1007/s00382-009-0551-6. York, D., M. L. Martínez, N. M. Evensen, and J. De Basabe Delgado (2004), Unified equations for the slope, intercept, and standard errors of
the best straight line,Am. J. Phys.,72(3), 367–375.


![Figure 5. (a) Water vapor transport into Amazon basin (across line 2 in Figure 4), (b) water vapor outflow (across line 4 inFigure 4), (c) water vapor transports across lines 1 and 3 in Figure 4, and (d) water vapor content over the Amazon basin,all based on ERA-Interim reanalysis [Dee et al., 2011].](https://thumb-us.123doks.com/thumbv2/123dok_us/7882868.184472/9.612.217.532.87.537/transport-outow-infigure-transports-content-amazon-interim-reanalysis.webp)
![Figure 6. (top) Sea surface temperature trends 1990–2013 based on ERSST [Smith et al., 2008]; (bottom) same asFigure 6 (top) but for 1960–1989.](https://thumb-us.123doks.com/thumbv2/123dok_us/7882868.184472/10.612.220.531.90.354/figure-surface-temperature-trends-based-ersst-smith-asfigure.webp)
![Figure 7. Tree mortality trends at RAINFOR forest plot census sites located in the Amazon basin (blue dots in Figure 4)versus precipitation trends at these sites taken from CRUTS 3.21 [Harris et al., 2013].](https://thumb-us.123doks.com/thumbv2/123dok_us/7882868.184472/13.612.175.573.513.745/figure-mortality-rainfor-located-amazon-figure-precipitation-harris.webp)