A Chandra X#Ray Study of
the Globular Cluster M80
The Harvard community has made this
article openly available.
Please share
how
this access benefits you. Your story matters
Citation
Heinke, C. O., J. E. Grindlay, P. D. Edmonds, D. A. Lloyd, S. S. Murray,
H. N. Cohn, and P. M. Lugger. 2003. “A Chandra X#Ray Study of the
Globular Cluster M80.” The Astrophysical Journal 598 (1): 516–26.
https://doi.org/10.1086/378884.
Citable link
http://nrs.harvard.edu/urn-3:HUL.InstRepos:41399888
Terms of Use
This article was downloaded from Harvard University’s DASH
repository, and is made available under the terms and conditions
applicable to Other Posted Material, as set forth at
http://
A CHANDRA X-RAY STUDY OF THE GLOBULAR CLUSTER M80
C. O. Heinke, J. E. Grindlay, P. D. Edmonds, D. A. Lloyd, and S. S. Murray Harvard College Observatory, 60 Garden Street, Cambridge, MA 02138;
[email protected], [email protected], [email protected], [email protected], [email protected]
and
H. N. Cohn and P. M. Lugger
Department of Astronomy, Indiana University, Swain West 319, Bloomington, IN 47405; [email protected], [email protected]
Received 2003 May 22; accepted 2003 August 4
ABSTRACT
We report our analysis of aChandraX-ray observation of the rich globular cluster M80, in which we detect some 19 sources to a limiting 0.5–2.5 keV X-ray luminosity of 71030 ergs s1within the half-mass radius.
X-ray spectra indicate that two of these sources are quiescent low-mass X-ray binaries containing neutron stars. We identify five sources as probable cataclysmic variables (CVs), one of which seems to be heavily absorbed, implying high inclination. The brightest CV may be the X-ray counterpart of nova 1860 T Sco. The concentration of the X-ray sources within the cluster core implies an average mass of 1:20:2 M,
consistent with the binary nature of these systems and very similar to the radial distribution of the blue stragglers in this cluster. The X-ray and blue straggler source populations in M80 are compared to those in the similar globular cluster 47 Tuc.
Subject headings:blue stragglers — globular clusters: individual (NGC 6093) — novae, cataclysmic variables — stars: neutron — X-rays: binaries
1. INTRODUCTION
TheChandra X-Ray Observatoryhas allowed rapid gains in the study of X-ray sources in globular clusters, especially
when combined with the resolution of the Hubble Space
Telescope (HST). Faint X-ray sources had been identified with Einstein (Hertz & Grindlay 1983) and ROSAT (see Verbunt 2001 for a review). A few of these had been identi-fied with bright low-mass X-ray binaries (LMXBs) in quies-cence (qLMXBs; e.g., Verbunt, Elson, & van Paradijs 1984) or with cataclysmic variables (Cool et al. 1995). Recently, Chandra(and to a lesser degreeXMM-Newton) has allowed the identification and detailed study of scores of faint X-ray sources in 47 Tuc (Grindlay et al. 2001a, hereafter GHE01a), NGC 6397 (Grindlay et al. 2001b, hereafter GHE01b),!Cen (Rutledge et al. 2002; Cool, Haggard, & Carlin 2002), NGC 6752 (Pooley et al. 2002b), NGC 6440 (Pooley et al. 2002a), and M28 (Becker et al. 2003), among others. Optical and radio identifications have allowed secure identifications of cataclysmic variables (CVs), chromospherically active binaries (ABs), and millisecond pulsars (MSPs); see Edmonds et al. (2003a, 2003b), Grindlay et al. (2002), and Pooley et al. (2002b) for examples. The spectral and luminosity signatures of qLMXBs, thought to emit thermal radiation from the neu-tron star surface (Brown, Bildsten, & Rutledge 1998), allow them to be identified easily (Rutledge et al. 2002; GHE01b). These advances make it practical to compare significant populations of X-ray sources in different globular clusters, exploring similarities or differences in properties or forma-tion mechanisms (see Pooley et al. 2003; Heinke et al. 2003c).
In this paper, we present newChandraobservations of the globular cluster M80 (NGC 6093). This globular cluster has a small core radius (6>5; Ferraro et al. 1999) and relatively
high central density [logð0Þ ¼4:87, computed using the prescription of Djorgovski 1993], although it is not core-collapsed. The distance to this cluster is estimated at 10:33þ0:80:7 kpc (Brocato et al. 1998), while EðBVÞ ¼
0:170:01 (Harris 1996, revision of 2003 February),1
lead-ing to a neutral hydrogen column (NH) estimate of
NH¼9:4ð0:9Þ 1020 cm2 [using NH=EðBVÞ ¼5:5
1021 cm2, from Predehl & Schmitt 1995 using R¼3:1].
The cluster center is given by Shara & Drissen (1995) as R.A. 16h17m0294, decl.2258033>8 (J2000). Ferraro et al.
(1999, 2003) have noted the unusually large number of cen-trally concentrated blue stragglers in M80, which are thought to have formed through collisions or dynamical hardening of close binaries. M80 is also unusual in having a known nova outburst (nova 1860 T Sco; see Shara &
Drissen 1995). AROSATobservation showed it to have at
least one X-ray source in the core of luminosityLX1032:8
ergs s1(Hakala et al. 1997; Verbunt 2001).
Inx2 we describe our observations and analysis of the
globular cluster M80. We discuss our findings and compare them to 47 Tuc inx3 and provide a summary inx4.
2. M80 OBSERVATIONS AND ANALYSIS
We observed M80 with Chandra for 48.6 ks on 2001
October 6 with the ACIS chip S3 at the focus (the ACIS-S aim point). This back-illuminated chip has a higher sensitiv-ity to soft X-rays (under 4 keV, and especially below 1 keV).
We reduced and analyzed the data using the Chandra
Interactive Analysis of Observations (CIAO)2software. We reprocessed the level 1 event files using the latest gain files
1Available at http://physun.physics.mcmaster.ca/Globular.html. 2Available at http://asc.harvard.edu/ciao/.
#2003. The American Astronomical Society. All rights reserved. Printed in U.S.A.
and without the pixel randomization that is applied in standard data processing and filtered on grade, status, and good time intervals supplied by standard processing. We searched for, but did not find, times of elevated background. We selected an energy band of 0.5–4.5 keV to search for sources with maximum sensitivity while minimizing the background. We ran two wavelet detection algorithms, the
CIAO task wavdetect (Freeman et al. 2002) and the
pwdetect3algorithm (Damiani et al. 1997), on ACIS chip 7,
with similar results. Outside the cluster half-mass radius, we select a detection sensitivity designed to identify a maximum of one spurious source on the S3 chip. In this paper we do not analyze the other four active chips.
2.1. Detection and Colors
In line with analyses of other clusters (e.g., Pooley et al. 2002a, 2002b, 2003), we focus our analysis on the sources
within the cluster half-mass radius (3900; Harris 1996,
updated 2003). This offers an excellent balance between including most cluster sources and excluding background sources. Since globular cluster X-ray sources are generally more massive than the typical cluster star, they tend to con-centrate toward the center of dynamically relaxed clusters such as M80. We expect only 0.8 background active galactic nuclei (AGNs) above five counts in our 0.5–4.5 keV detec-tion band (from Giacconi et al. 2001) within the half-mass radius.
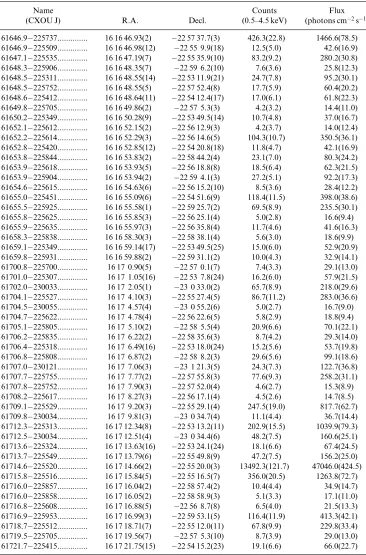
Within the half-mass radius we choose the sensitivity of our detection algorithms to identify no more than one spurious source. However, several sources obvious to the eye remained undetected, so we further increased the sensi-tivity to allow calculation of as many source positions as possible and applied both algorithms in several energy bands. We compiled a list of robust (significance >1.65 , more than three counts, and visually confirmed) source detections to give a final tally of 19 sources within the half-mass radius. These sources, and the extraction regions used for later analysis, are shown in Figure 1, along with the core and half-mass regions (large circles; astrometry is as calcu-lated inx2.2 below). We give these sources shorthand names (e.g., CX12), which we will use for the rest of this paper, ordered with decreasing counts in the 0.5–4.5 keV band. The cluster source names, positions, counts in three bands, and luminosities (calculated as below) are listed in Table 1. Note that excess unresolved emission remains in the core, probably representing numerous undetected sources, of which the brightest may contribute up to seven counts. At least two sources (CX9 and CX14) could be combinations of multiple sources; however, we expect the bulk of the counts in each to be due to a single source.
We used extraction regions of 1>25 radius circles for most
sources, except for fainter sources in the core and near brighter sources where confusion was an issue, where we used 1>0 or 0>75 extraction regions. We extract the counts of our identified sources in four bands; a soft band (0.5–1.5 keV), a hard band (1.5–6 keV), a detection (medium) band
(0.5–4.5 keV), and the ROSAT band (0.5–2.5 keV). We
define an Xcolor (following GHE01a) as 2:5logð0:5–1.5 keV counts/1.5–6 keV counts). Our exposure map is uni-form to within 1% between the locations of different cluster
sources, so we do not make exposure corrections to the observed counts. We extracted counts from a large source-free adjacent background region to estimate the back-ground flux, finding 0.019 counts pixel1in the 0.5–4.5 keV
band, 0.011 counts pixel1 in the 0.5–1.5 keV band, and
0.012 counts pixel1in the 1.5–6 keV band. Since the chance
of having even one background count recorded in any band is less than 25% for our source extraction regions, we do not perform background subtraction on our extracted numbers of counts, although we do extract background spectra for spectral fitting purposes. We derive aperture corrections from the fraction of a CXC point-spread function (derived
using the CIAO toolmkpsffor 1.6 keV, the mean energy of
the core sources) that falls within our extraction circles and apply these to the luminosities below.
We also list the positions, colors, and exposure-corrected photon fluxes of sources outside the half-mass radius of the cluster, but on ACIS chip 7, in Table 2. These are derived using the wavelet detection program pwdetect, with the final detection significance set to 4.5 , leading to an expectation of less than one false source on the S3 chip. A few spurious or multiply detected sources were removed by hand, leaving 52 sources outside the cluster half-mass radius. The density of 10 count sources on the rest of the chip (0.55 arcmin2) indicates that 2.2 sources should be found between 1 and 2 cluster half-mass radii, while 3 are found. (Only 0.7 sources are expected within the mass radius.) Beyond 2 half-mass radii the source numbers are equal to or lower than the mean chip density of 10 count sources. The 1–2
half-mass radii overdensity is not significant at even the 1
level, but we cannot rule out that one or two of these
3Available at
http://www.astropa.unipa.it/progetti_ricerca/PWDetect/.
19
18
17 16
15 14
13
12 11
10 9
8
7 6
5
4 3
2 1
Fig.1.—ChandraACIS-S image of the globular cluster M80. The two larger circles represent the core (inner circle; 6>5) and half-mass (outer circle; 3900) radii of the cluster. The 19 sources within the half-mass radius are labeled (in order of decreasing counts in the 0.5–4.5 keV band), and the extraction regions are overlaid. Additional X-ray emission is visible from the central cluster core from sources unresolved withwavdetect. CXOU J161705.1225805 is also visible at upper left and may be associated with the cluster.
sources are associated with the cluster. Assuming a power-law spectrum with photon index 1.7 and the
clus-ter NH, on the order of 22 background AGNs should be
detected above 10 counts in our band over the entire chip (Giacconi et al. 2001). The 38 sources outside the cluster half-mass radius are thus a significant overdensity, imply-ing a Galactic population of X-ray sources in line with the results of ongoing Galactic plane and bulge surveys (e.g., Grindlay et al. 2003). However, further analysis of these sources is outside the scope of this paper.
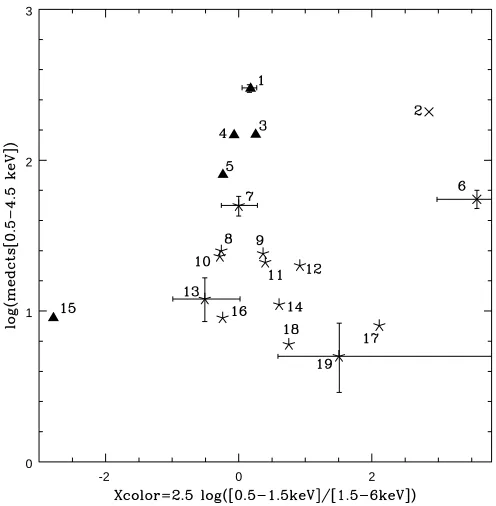
We create two versions of an ‘‘ X-ray color-magnitude diagram ’’ to assist with source classification. In the first version we follow the formalism of GHE01a, assigning the logarithm of the number of counts in the 0.5–4.5 keV band to they-axis and X-ray color (Xcolor) to thex-axis (Fig. 2). This version explicitly uses the observational quantities. In the second version we attempt to correct the color uniformly
for the cluster absorption. We use the Chandra proposal
tool PIMMS4to investigate the effects of an absorbing
col-umn of 9:41020 cm2on the numbers of detected counts
in our chosen bands. We use 0.2 and 0.3 keV blackbody spectra, 1, 5, and 10 keV bremsstrahlung spectra, and power-law spectra with photon index 1 or 2, which cover the range of X-ray spectral types seen in globular clusters (suggesting qLMXBs, CVs, and pulsars respectively; see
references in x 1). We calculate the average difference
[image:4.612.69.546.90.337.2]between the calculated colors and the colors without absorption as 0:3050:025 and calculate new corrected
TABLE 1
X-Ray Sources in M80
Counts
LX
(ergs s1)
Source R.A. Decl. (0.5–4.5) (0.5–1.5) (1.5–6) (0.5–6) (0.5–2.5)
CX1 ... 16 17 02.814(4) 22 58 32.67(4) 299 172 146 6.51032(6%) 3.41032(6%)
CX2 ... 16 17 02.576(2) 22 58 36.48(3) 209 195 14 2.91032(7%) 2.91032(7%)
CX3 ... 16 17 01.597(3) 22 58 27.95(4) 148 86 68 3.31032(8%) 1.91032(9%)
CX4 ... 16 17 02.005(4) 22 58 33.03(5) 147 76 81 3.81032(8%) 2.01032(9%)
CX5 ... 16 17 01.708(4) 22 58 15.34(6) 80 37 46 2.01032(11%) 9.51031(13%)
CX6 ... 16 17 03.569(5) 22 58 25.30(6) 55 54 2 9.11031(13%) 9.11031(13%)
CX7 ... 16 17 02.164(6) 22 58 37.27(5) 50 25 25 1.01032(14%) 5.71031(15%)
CX8 ... 16 17 01.114(5) 22 58 29.33(8) 25 11 14 5.11031(20%) 3.21031(20%)
CX9 ... 16 17 02.401(7) 22 58 32.6(1) 24 14 10 5.01031(20%) 2.81031(22%)
CX10 ... 16 17 00.407(8) 22 58 28.87(7) 23 10 13 4.71031(21%) 2.41031(24%)
CX11 ... 16 17 02.472(8) 22 58 37.86(8) 21 13 9 4.61031(21%) 2.21031(25%)
CX12 ... 16 17 02.565(7) 22 58 45.0(1) 20 14 6 4.11031(22%) 2.71031(22%)
CX13 ... 16 17 01.755(7) 22 58 29.29(9) 12 5 8 2.71031(28%) 1.51031(30%)
CX14 ... 16 17 02.553(8) 22 58 30.5(2) 11 7 4 2.31031(30%) 1.51031(30%)
CX15 ... 16 17 02.100(7) 22 58 31.8(1) 9 1 13 3.51031(27%)* 41030ðþ132
65%Þ*
CX16 ... 16 17 02.119(8) 22 58 19.8(2) 9 4 5 1:81031ðþ46
33%Þ 1:11031ð
þ49
35%Þ
CX17 ... 16 17 02.220(7) 22 58 33.7(2) 8 7 1 1:71031ðþ49
35%Þ 1:11031ð
þ49
35%Þ
CX18 ... 16 17 02.820(7) 22 58 36.0(2) 6 4 2 1:31031ðþ60
40%Þ 81030ð
þ60
40%Þ
CX19 ... 16 17 03.85(1) 22 58 47.1(2) 5 4 1 1:01031ðþ68
43%Þ 71030ð
þ68
43%Þ
Notes.—Units of right ascension are hours, minutes, and seconds, and units of declination are degrees, arcminutes, and arcseconds. Names, positions, counts in three X-ray energy bands (energies given in keV) and estimated luminosities of X-ray sources within the half-mass radius of M80. The errors in parentheses after the position represent the 1uncertainties in the relative positions of the sources, derived fromwavdetect
results. The counts in each band are the numbers of photons within the circular source regions of Fig. 1. Luminosities have been adjusted to account for the percentage of the point spread function included in each region. The luminosities for CX1–CX6 are derived from individual spectral fittings, while the luminosities for CX7–CX19 are derived from fitting their combined (except CX15) spectrum. Luminosity errors (given in percentage) are derived from Poisson or Gehrels statistics of the detected counts in each band. *CX15 probably suffers significant intrinsic absorption, unaccounted for in these luminosities (see text).
4Available at http://asc.harvard.edu/toolkit/pimms.jsp.
-2 0 2
0 1 2 3
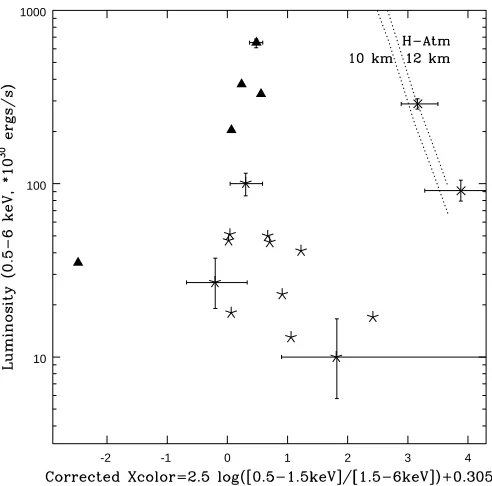
[image:4.612.320.568.421.674.2]colors for our sources. Instead of using counts as they-axis, we use the luminosity in the 0.5–6 keV band, whereChandra has its greatest sensitivity. This provides us with an X-ray CMD that can be compared directly to CMDs of other clusters (Fig. 3).
We compare Figure 3 with the results from 47 Tuc
(GHE01a; Edmonds et al. 2003a, 2003b),!Cen (Rutledge
[image:5.612.123.489.77.632.2]et al. 2002; Cool, Haggard, & Carlin 2002), NGC 6397 (GHE01b), NGC 6752 (Pooley et al. 2002a), NGC 6440 (Pooley et al. 2002b), and M28 (Becker et al. 2003).
TABLE 2
Serendipitous Sources in the M80 Field
Name
(CXOU J) R.A. Decl.
Counts (0.5–4.5 keV)
Flux (photons cm2s1)
161646.9225737... 16 16 46.93(2) 22 57 37.7(3) 426.3(22.8) 1466.6(78.5) 161646.9225509... 16 16 46.98(12) 22 55 9.9(18) 12.5(5.0) 42.6(16.9) 161647.1225535... 16 16 47.19(7) 22 55 35.9(10) 83.2(9.2) 280.2(30.8) 161648.3225906... 16 16 48.35(7) 22 59 6.2(10) 7.6(3.6) 25.8(12.3) 161648.5225311... 16 16 48.55(14) 22 53 11.9(21) 24.7(7.8) 95.2(30.1) 161648.5225752... 16 16 48.55(5) 22 57 52.4(8) 17.7(5.9) 60.4(20.2) 161648.6225412... 16 16 48.64(11) 22 54 12.4(17) 17.0(6.1) 61.8(22.3) 161649.8225705... 16 16 49.86(2) 22 57 5.3(3) 4.2(3.2) 14.4(11.0) 161650.2225349... 16 16 50.28(9) 22 53 49.5(14) 10.7(4.8) 37.0(16.7) 161652.1225612... 16 16 52.15(2) 22 56 12.9(3) 4.2(3.7) 14.0(12.4) 161652.2225614... 16 16 52.29(3) 22 56 14.6(5) 104.3(10.7) 350.5(36.1) 161652.8225420... 16 16 52.85(12) 22 54 20.8(18) 11.8(4.7) 42.1(16.9) 161653.8225844... 16 16 53.83(2) 22 58 44.2(4) 23.1(7.0) 80.3(24.2) 161653.9225618... 16 16 53.93(5) 22 56 18.8(8) 18.5(6.4) 62.3(21.5) 161653.9225904... 16 16 53.94(2) 22 59 4.1(3) 27.2(5.1) 92.2(17.3) 161654.6225615... 16 16 54.63(6) 22 56 15.2(10) 8.5(3.6) 28.4(12.2) 161655.0225451... 16 16 55.09(6) 22 54 51.6(9) 118.4(11.5) 398.0(38.6) 161655.5225925... 16 16 55.58(1) 22 59 25.7(2) 69.5(8.9) 235.5(30.1) 161655.8225625... 16 16 55.85(3) 22 56 25.1(4) 5.0(2.8) 16.6(9.4) 161655.9225635... 16 16 55.97(3) 22 56 35.8(4) 11.7(4.6) 41.6(16.3) 161658.3225838... 16 16 58.30(3) 22 58 38.1(4) 5.6(3.0) 18.6(9.9) 161659.1225349... 16 16 59.14(17) 22 53 49.5(25) 15.0(6.0) 52.9(20.9) 161659.8225931... 16 16 59.88(2) 22 59 31.1(2) 10.0(4.3) 32.9(14.1) 161700.8225700... 16 17 0.90(5) 22 57 0.1(7) 7.4(3.3) 29.1(13.0) 161701.0225307... 16 17 1.05(16) 22 53 7.8(24) 16.2(6.0) 57.9(21.5) 161702.0230033... 16 17 2.05(1) 23 0 33.0(2) 65.7(8.9) 218.0(29.6) 161704.1225527... 16 17 4.10(3) 22 55 27.4(5) 86.7(11.2) 283.0(36.6) 161704.5230055... 16 17 4.57(4) 23 0 55.2(6) 5.0(2.7) 16.7(9.0) 161704.7225622... 16 17 4.78(4) 22 56 22.6(5) 5.8(2.9) 18.8(9.4) 161705.1225805... 16 17 5.10(2) 22 58 5.5(4) 20.9(6.6) 70.1(22.1) 161706.2225835... 16 17 6.22(2) 22 58 35.6(3) 8.7(4.2) 29.3(14.0) 161706.4225318... 16 17 6.49(16) 22 53 18.0(24) 15.2(5.6) 53.7(19.8) 161706.8225808... 16 17 6.87(2) 22 58 8.2(3) 29.6(5.6) 99.1(18.6) 161707.0230121... 16 17 7.06(3) 23 1 21.3(5) 24.3(7.3) 122.7(36.8) 161707.7225755... 16 17 7.77(2) 22 57 55.8(3) 77.6(9.3) 258.2(31.1) 161707.8225752... 16 17 7.90(3) 22 57 52.0(4) 4.6(2.7) 15.3(8.9) 161708.2225617... 16 17 8.27(3) 22 56 17.1(4) 4.5(2.6) 14.7(8.5) 161709.1225529... 16 17 9.20(3) 22 55 29.1(4) 247.5(19.0) 817.7(62.7) 161709.8230034... 16 17 9.81(3) 23 0 34.7(4) 11.1(4.4) 36.7(14.4) 161712.3225313... 16 17 12.34(8) 22 53 13.2(11) 202.9(15.5) 1039.9(79.3) 161712.5230034... 16 17 12.51(4) 23 0 34.4(6) 48.2(7.5) 160.6(25.1) 161713.6225324... 16 17 13.63(16) 22 53 24.1(24) 18.1(6.6) 67.4(24.5) 161713.7225549... 16 17 13.79(6) 22 55 49.8(9) 47.2(7.5) 156.2(25.0) 161714.6225520... 16 17 14.66(2) 22 55 20.0(3) 13492.3(121.7) 47046.0(424.5) 161715.8225516... 16 17 15.84(5) 22 55 16.5(7) 356.0(20.5) 1263.8(72.7) 161716.0225857... 16 17 16.04(2) 22 58 57.4(2) 10.4(4.4) 34.9(14.7) 161716.0225858... 16 17 16.05(2) 22 58 58.9(3) 5.1(3.3) 17.1(11.0) 161716.8225608... 16 17 16.88(5) 22 56 8.7(8) 6.5(4.0) 21.5(13.3) 161716.9225953... 16 17 16.99(3) 22 59 53.1(5) 116.4(11.9) 413.3(42.1) 161718.7225512... 16 17 18.71(7) 22 55 12.0(11) 67.8(9.9) 229.8(33.4) 161719.5225705... 16 17 19.56(7) 22 57 5.3(10) 8.7(3.9) 29.0(13.0) 161721.7225415... 16 17 21.75(15) 22 54 15.2(23) 19.1(6.6) 66.0(22.7)
Notes.—Units of right ascension are hours, minutes, and seconds, and units of declination are degrees, arcminutes, and arcseconds. Sources outside the M80 half-mass radius detected on the S3 chip during the M80 observation. Relative positional errors are given in parentheses on the last quoted digits. Counts in the 0.5–4.5 keV band, photon flux, and errors in both are given by thepwdetecttool.
Quiescent LMXBs have been identified in globular clusters by their blackbody-like spectra and high FX=Fopt values.
CX2 and CX6 have similar colors and luminosities to
qLMXBs identified in 47 Tuc (X5, X7), ! Cen (3), NGC
6397 (U24), and NGC 6440 (CX1) by these means, so we classify them as probable qLMXBs. As a further check on our classification, we plot in Figure 3 theoretical tracks for 10 and 12 km nonmagnetic hydrogen-atmosphere mod-els of Lloyd (2003). These are essentially cooling tracks for neutron stars, since they show how the X-ray color of the qLMXB should change as the luminosity decreases for an NS of fixed radius. Clearly, CX2 and CX6 are in agreement with the predictions of these tracks.
Harder sources (1<Xcolor<1) associated with these clusters above 1032ergs s1seem to be almost entirely CVs
(GHE01a; GHE01b; Pooley et al. 2002a), so we identify CX2, CX3, CX4, and CX5 as probable CVs. Two eclipsing CVs in 47 Tuc (W8 and W15; GHE01a; Edmonds et al.
2003a, 2003b) show Xcolor<1 due to high intrinsic
absorption of the X-rays from the inner disk and/or white dwarfs passing through the edge-on accretion disk. X-ray spectra showing these colors without high intrinsic absorp-tion (from an accreabsorp-tion disk or other gas in the system) are highly implausible. CX15 shows colors and luminosities similar to these systems, so we propose it is also a CV. The remaining sources, belowLX¼1032ergs s1, are similar in
colors and luminosity to both CV and bright AB systems in
47 Tuc,!Cen, NGC 6397, and NGC 6752. Soft MSPs in 47
Tuc and NGC 6752 are uniformly less X-ray luminous than any systems in M80, but the unusual nonthermally emitting MSPs in NGC 6397 (GHE01b) and 47 Tuc (47 Tuc-W; Edmonds et al. 2002b) are as luminous as our faintest sour-ces. (A luminous, young MSP such as PSR B1821-24 in M28 should probably be detected in the current radio
searches of M80 by N. D’Amico et al. We believe such objects to be rare in globular clusters, but we cannot exclude such an object, as our 3.2 s readout time does not allow pul-sation searches at appropriate periods.) Therefore, we regard our remaining sources as probably predominantly CVs, with some ABs and perhaps MSPs mixed in. We iden-tify probable CVs, qLMXBs, and unidentified sources with
~,, and?symbols, respectively, in Figures 2 and 3.
2.2. Astrometry and a Possible Counterpart
TheROSATX-ray source 7, identified by Verbunt (2001) as star HD 146457 (V¼8:46), is clearly detected 4<2 off-axis
as CXOU J161714.6225520. Five other serendipitous
ROSATsources also appear in the Chandrafield of view. No other bright sources are unambiguously identified with SIMBAD objects, so we use HD 146457 to define our
astrometry. We find an offset between theChandra
wavde-tect and pwdetect positions and the Tycho Reference Catalog position of0.002 s, +1>66 (Tycho-Chandra) and
add this offset to our nominal astrometric solution to derive a corrected astrometric solution, which we use for the rest of this paper. The uncertainty in thepwdetect-derived position of HD 146457 is D¼0902, D¼0>3, but our absolute astrometric errors may be slightly increased because of uncertainties in the plate scale and off-axis point-spread function modeling. Analysis of numerous point sources with optical counterparts by Feigelson et al. (2002) and Muno et al. (2003) suggest that typical relative astrometric uncertainties at 40off-axis are of the order of 0>5. The
abso-lute uncertainty ofChandraastrometry is estimated at 0>6 (90% confidence; Aldcroft et al. 2000), making this astrometric correction relatively large.
Although classification by color and luminosity can iden-tify some X-ray sources with certain populations, optical identification of counterparts is necessary to be certain of most classifications. The full task is beyond the scope of this work, but we do consider previously identified possible counterparts. Shara & Drissen (1995) identified two faint blue stars in M80 that are candidate CVs. They identify one at R.A. 16h17m02983, decl. 2258031>3 (J2000, using the
Guide Star Catalog I), as the probable counterpart of nova 1860 T Sco, based on a contemporary determination (Auwers 1862) of the nova position with respect to two bright stars and the cluster center. Shara & Drissen’s pre-ferred extrapolation of the Auwers (1862) nova position (using offsets from bright stars) is R.A. 16h17m02982, decl.
2258032>1. These positions are, respectively, 1>4 and 0>6
away from our position for CX1, the brightest candidate CV in our image. Considering the uncertainties (often 100– 200) in the Guide Star Catalog I and in our astrometric solu-tion above, we suggest that CX1 may be the X-ray counter-part of nova 1860 T Sco. Hakala et al. (1997) provide three arguments against the identification of nova 1860 T Sco
with the (confused) ROSAT M80 X-ray source: the
posi-tional discrepancy, the rather high X-ray luminosity, and the rather high X-ray–to–optical flux ratio. The positional discrepancy is greatly reduced by the resolution of the ROSAT M80 source into numerous sources by Chandra.
The X-ray luminosity of CX1 is only 3:11032 ergs s1
(0.5–2.5 keV), compared to the total cluster LXð0:5
2:5 keVÞ 8:61032ergs s1for theROSATPSPC
obser-vation cited by Hakala et al. (1995). While high, this lumi-nosity is comparable to that of probable CVs in other
-2 -1 0 1 2 3 4
10 100 1000
Fig.3.—Standardized X-ray CMD for the 19 sources in the globular cluster M80.Vertical axis: 0.5–6 keV X-ray luminosity in units of 1030ergs
s1, derived from spectral fitting (see text).Horizontal axis: Xcolor as in
[image:6.612.46.292.52.295.2]globular clusters, e.g., 47 Tuc (GHE01a), NGC 6440 (Poo-ley et al. 2002a), and Terzan 5 (Heinke et al. 2003b). Finally,
the (absorbed 0.5–2.5 keV) X-ray to (uncorrectedV-band)
optical flux ratio (FX=Fopt) of CX1, if it is the counterpart of
nova 1860 T Sco, is 4.5. While somewhat high for field sys-tems, this is consistent with the range ofFX=Foptfound for
CVs in 47 Tuc by Edmonds et al. (2003b), of which the brightest objects may be magnetic DQ Her systems (GHE01a). We note that a fainter undetected CX1 counter-part would increase theFX=Foptratio and that, in any case,
the X-ray and optical flux measurements are not simultane-ous. Thus, we conclude that the association is plausible but
unproven. Further HSTanalysis is in progress to look for
additional X-ray counterpart candidates and improve the Chandra/HSTrelative astrometry.
2.3. Spectral Fitting
For the six brightest sources associated with the cluster (over 50 counts), we extract source (using at least 10 counts bin1) and (off-cluster) background spectra using the CIAO
script psextractand fit the spectra in XSPEC version 11.2
(Arnaud 1996).5 We correct the effective area functions for
the time-dependent low-energy quantum efficiency degrada-tion.6We exclude bins with most photons below 0.3 keV or
above 10 keV. We attempt to fit three models to these spectra, all with photoelectric absorption as a free parameter forced to be equal to or greater than the cluster value (9:41020
cm2). For all analysis in this paper, we use photoelectric
absorption X-ray cross sections of Balucinska-Church & McCammon (1992) in the XSPEC phabs model. Our models are a thermal bremsstrahlung spectrum as associated with CVs, a power-law model, and a hydrogen atmosphere model (Lloyd 2003), as appropriate for qLMXBs containing ther-mal neutron stars withB<1010G, with the radius fixed at 10
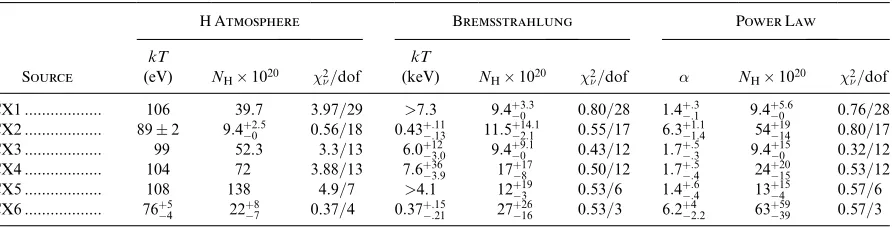
km. The dichotomy between harder and softer sources appa-rent in the X-ray CMDs is also clear in the spectral fitting, with CX2 and CX6 showing good fits to the hydrogen atmo-sphere spectral models, while CX1, CX3, CX4, and CX5 do not. CX2 and CX6 require large values for a power-law pho-ton index (>5) and very small bremsstrahlung temperatures (<0.6 keV), which are not consistent models for any known physical sources at these luminosities. CX1, CX3, CX4, and
CX5 give bremsstrahlung temperatures consistent with7
keV or more, as appropriate for luminous CVs, particularly magnetic CVs (Eracleous, Halpern, & Patterson 1991; Mukai 2001). Mekal models (Liedahl, Osterheld, & Goldstein 1995) give indistinguishable results, given the low metallicity (½Fe=H ¼ 1:75) and high temperatures. This result con-firms our tentative classification of these sources as cataclys-mic variables inx2.1. We note that CX6 requires a higherNH
than the cluster value for any of our models, while the other sources are consistent with the cluster value. Heinke et al.
(2003a) note enhanced NH toward X5 and X7 in 47 Tuc,
presumably from gas inside or surrounding the system. Our preferred spectral fits to these six sources are shown in Figure 4, and results for all three models are listed in Table 3.
For the remaining sources within the half-mass radius (except CX15, which has a very unusual spectrum; seex2.1), we extract a combined spectrum and fit this to derive the mean spectral shape and luminosity/count ratio. We extract a total of 235 counts and fit them with a thermal brems-strahlung model of kT ¼2:3þ0:910:64 keV (for fixed NH¼
9:41020cm2), (2
¼1:45 for 8 dof). A MEKAL fit gives
very similar results, while fits with a power law or blackbody require very different column densities. The power law
requiresNH¼2691020 cm2with a photon index of
2:4þ0:40:3(2
¼1:8 for 8 dof), while the blackbody fit requires
NH¼0þ301020 cm2, much less than the cluster value.
These results indicate that the fainter sources have lower temperatures than the bright CVs, as expected for a mix of active binaries and (perhaps nonmagnetic) CVs, as seen in 47 Tuc (Edmonds et al. 2003a, 2003b). We use the bremsstrahlung spectral fits to derive fluxes. To calculate the luminosities of each of the fainter sources, we multiplied their integrated luminosity by the ratio of each source’s counts to the combined source counts (Table 1). We do this for both the 0.5–2.5 keV band and the 0.5–6 keV band. Derived luminosity errors are simply Poisson or Gehrels errors from the detected counts, without including spectral uncertainties, and are thus underestimates.
2.4. Time Variability
We extracted event files from each detected source within the half-mass radius and tested them using the IRAF vartst to attempt to disprove the hypothesis that the source flux is constant. Two sources (CX1 and CX8) showed variability at the 99% confidence level, according to both the Cramer-von Mises and Kolmogorov-Smirnov
5Available at http://xspec.gsfc.nasa.gov. 6Using the ACISABS model; see
[image:7.612.86.532.609.723.2]http://cxc.harvard.edu/cal/Acis/Cal_prods/qeDeg/.
TABLE 3
Spectral Fits to Brighter M80 Sources
H Atmosphere Bremsstrahlung Power Law
Source
kT
(eV) NH1020 2/dof
kT
(keV) NH1020 2/dof NH1020 2/dof CX1 ... 106 39.7 3.97/29 >7.3 9:4þ3:3
0 0.80/28 1:4þ::31 9:4þ5
:6
0 0.76/28
CX2 ... 892 9:4þ2:5
0 0.56/18 0:43þ::1113 11:5þ14
:1
2:1 0.55/17 6:3þ1
:1
1:4 54þ1914 0.80/17
CX3 ... 99 52.3 3.3/13 6:0þ12
3:0 9:4þ9
:1
0 0.43/12 1:7:þ:35 9:4þ150 0.32/12
CX4 ... 104 72 3.88/13 7:6þ36
3:9 17þ178 0.50/12 1:7þ::54 24þ2015 0.53/12
CX5 ... 108 138 4.9/7 >4.1 12þ19
3 0.53/6 1:4
þ:6
:4 13
þ15
4 0.57/6
CX6 ... 76þ5
4 22
þ8
7 0.37/4 0:37
þ:15
:21 27
þ26
16 0.53/3 6:2
þ4
2:2 63
þ59
39 0.57/3
Notes.—Spectral fits to cluster sources, with background subtraction, in XSPEC. Errors are 90% confidence for a single parameter; spectra are binned with 10 counts bin1. All fits include photoelectric absorption forced to be9:41020cm2, the clusterN
Hderived
from optical studies. Hydrogen atmosphere fits are made with radius fixed to 10 km.
tests (K-S; Daniel 1990). CX4 showed variability at the 90% confidence level in both tests, while no other source showed evidence of variability. We present the light curves from these three sources, plus the (nonvariable) light curve from CX2 (a probable qLMXB) in Figure 5. Clear flares are present in all three of the variable sources. X-ray flaring may be present in either CVs or ABs but is not expected from MSPs. The large flare visi-ble from CX8 is reminiscent of a flare from an AB, but we cannot make any firm statements about these sources from their variability alone. The Cramer-von Mises and K-S tests are naturally far more sensitive to variability from bright sources than faint sources, so the lack of identified variability from faint sources does not indicate that they did not vary during the observation.
2.5. Spatial Distribution of X-Ray Sources
The radial distribution of X-ray sources in a dynamically relaxed cluster allows an estimate of the average mass of the X-ray sources. Heinke et al. (2003c) describe a procedure for estimating the typical qLMXB mass from the spatial dis-tribution of a sample of 20 qLMXBs in seven clusters. This procedure is based on maximum-likelihood fitting of a para-meterized form to the radial profile of the source
distribu-tion. The key parameter is the ratio q¼MX=M of the
source mass to the mass of the typical star that defines the optical core radius. The approach assumes that the spatial distribution of these typical stars is well described by a classic King (1966) model, which is the case for M80 (Ferraro et al. 1999). The radial profile of the source surface
CX3 CX4
CX5
CX1 CX2
CX6
Fig.4.—Energy spectra of six of the brighter sources in M80.Upper panels: Data compared with a nonmagnetic hydrogen atmosphere neutron star model (Lloyd 2003) for CX2 and CX6, and a thermal bremsstrahlung model for CX1, CX3, CX4, and CX5.Lower panels: Contributions to the2statistic for each
density takes the form
SðrÞ ¼S0 1þ
r rc
2
" #ð13qÞ=2
; ð1Þ
whereS0 is an overall normalization andrc is the optical
core radius determined for turnoff-mass stars. For M80, Ferraro et al. (1999) have obtainedrc ¼6>5.
In fitting the radial profile of the source distribution in M80, it is necessary to correct the source sample for back-ground contamination and ensure a uniform completeness limit. We address the latter by using only sources with more than 10 counts, as we are complete to this flux limit from the cluster core out to 4 half-mass radii. The expected number of background sources above 10 counts is 0.7 sources within the half-mass radius, 2.2 between 1rh and 2rh, 3.7 between
2rh and 3rh, and 5.2 between 3rh and 4rh. We correct for
background using the Monte Carlo procedure described by Grindlay et al. (2002). This procedure is carried out as part of the bootstrap resampling experiment that is used to
esti-mate the confidence ranges for the fit parameters. For each of 1000 bootstrap resamplings of the source distribution, a number of background objects is selected from a Poisson distribution with the adopted mean value for the region under consideration. A set of background object positions is then generated with a uniform random distribution over this region, and the sources that are closest to these positions are removed from the sample for that fitting trial.
Since the number of background sources beyond 2rh is
comparable to the total number of sources detected there, we have confined our fits to the region inside of 2rh. The
results are nearly identical for the regions 0 1rh and 0 2rh,
with slightly smaller errors for the former. For this case, we obtain a mass ratio ofq¼1:440:22 (1) with a 90% con-fidence range of 1:2 2:0. For an assumed turnoff mass of approximately M ¼0:8M, the inferred source mass is
MX¼1:20:2 M. The 90% confidence interval extends
up to 1.6M. For comparison, Heinke et al. (2003c) find
q¼1:90:2, corresponding toMX¼1:50:2Mfor the
qLMXB sample. While the difference in inferred mass
CX1 CX2
CX4 CX8
Fig.5.—Light curves for three variable sources in M80, plus the probable qLMXB CX2 for comparison. CX1 and CX8 are found to be variable at or above the 99% level in two variability tests, while CX4 appears to be variable at the 90% level in both tests. All three of the variable sources appear to show flares.
between the M80 source sample and the pure qLMXB sample is not significant, it is in the expected direction if the former is dominated by CVs, which should have generally lower masses than qLMXBs.
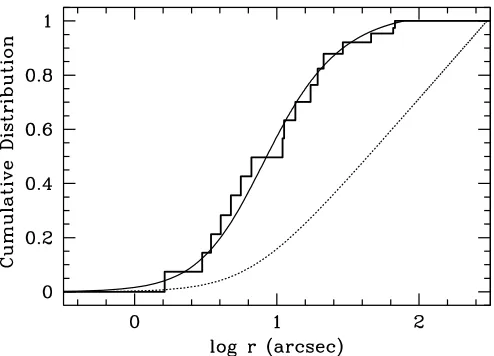
Figure 6 shows the background-corrected cumulative distribution of Chandrasources out to 2rh, along with the
excellent fit provided by equation (1). Also shown is the analytic King model that describes the distribution of the turnoff-mass stars. The strong central concentration of theChandrasources, relative to the turnoff-mass stars, is readily apparent. The source distribution is strikingly simi-lar to the well-determined distribution of 305 blue stragglers in M80 shown in Fig. 3 of Ferraro et al. (1999). Thus, the masses of theChandrasources are likely to be quite similar to those of the blue stragglers.
2.6. Luminosity Function and Unresolved Sources
Pooley et al. (2002b) recently showed significant differen-ces between the luminosity functions of several globular clusters, particularly between those of NGC 6397 and 47 Tuc. Following the method of Johnston & Verbunt (1996),
they derive power-law luminosity functions dN/
LX dlnLX. Johnston & Verbunt (1996) found0:58 for
14 sources in 12 globular clusters, with rather large uncer-tainties, while Pooley et al. (2002b) derives ranging from 0:78þ0:160:17for 47 Tuc to 0:29þ0:110:08for NGC 6397, while NGC 6440 and NGC 6752 show intermediate values. We use the same method to constrain the luminosity function of M80, using a minimum luminosity ofLXð0:52:5Þ ¼1:51031
ergs s1. We find a of 0:65þ0:30
0:20 as our best fit (K-S
probability = 92%), with values ofbetween 0.375 and 1.20 having K-S probabilities greater than 10%. Using the 0.5–6 keV luminosities instead of 0.5–2.5 keV, with a limiting luminosity ofLXð0:5 6Þ ¼2:01031 ergs s1, gives a best
fitof 0:575þ0:230:15(K-S probability = 90%), with an accept-able range from 0.35 to 0.975. These limits are not greatly constraining, but suggest that M80’s overall luminosity function is less similar to that of NGC 6397 than to the other clusters.
We address the issue of unresolved sources in the cluster core, which are clearly visible in Figure 1. We extract a total of 48 counts in the 0.5–1.5 keV band from the core outside our source regions and 37 counts in the 1.5–6 keV band. The background expected in such an area (from measurements offset from the cluster) is five soft counts and four hard counts. The expected contribution from the wings of the known cluster core sources is 23 counts in the soft band and 26 in the hard band. This leaves a total of 209 soft counts
and 78 hard counts for the remaining core sources.
(Excess emission between the core and half-mass radii can-not be determined well because of low statistics.) Visual inspection of images of the core in soft and hard bands gives the impression of additional soft sources up to perhaps six counts, while no undetected hard sources above three counts are apparent.
Although the statistics are insufficient for firm conclu-sions, these observations suggest that M80 has a population of fainter, softer sources than the identified sources. This is similar to the results from 47 Tuc presented by GHE01a and Grindlay et al. (2002). Such faint soft X-ray sources are likely a mixture of active binaries, MSPs, and some CVs (Edmonds et al. 2003a, 2003b). We judge our completeness limits to be roughly LXð0:5 2:5Þ ¼1:51031 and
LXð0:5 6Þ ¼2:01031 ergs s1in the core, with our
detec-tion and completeness limit outside the core a factor of 2 lower. The total 0.5–2.5 keV luminosity of our unresolved M80 core emission may be of the order of 21031ergs s1,
using a 1 keV Raymond-Smith model in PIMMS. We esti-mate that 25% of the core is included in our known-source extraction regions. Generalized King model radial distribu-tions for objects of twice the dominant cluster core mass
(e.g., binaries and neutron stars compared to 0.7 M
cluster stars) tend to distribute half these objects inside one optical core radius (see Lugger, Cohn, & Grindlay 1995; Grindlay et al. 2002; Verbunt 2002). Assuming a similar dis-tribution for undetected M80 sources suggests a total lumi-nosity of fainter sources 2.7 times that detected, e.g., LXð0:5 2:5Þ 51031ergs s1. The population of detected
sources in 47 Tuc from 1030–1031ergs s1is some 68 sources
totaling 2:11032 ergs s1 (GHE01a), with an additional
fainter unresolved emission of71031ergs s1(Grindlay
et al. 2002). The total luminosity of detected and undetected
sources in M80 below 1031ergs s1 (0.5–2.5 keV) may be
71031ergs s1. Therefore, we find that M80 probably has
a population of fainter X-ray sources perhaps 25% as numerous as those in 47 Tuc.
3. DISCUSSION
The rates of close encounters between stars in globular clusters are thought to scale with the square of the central density, the volume of the core, and inversely with the
veloc-ity dispersion, /2
0r 3
c=, or for a King model /1:50 r2c
(Verbunt & Hut 1987; Verbunt 2003). According to this cal-culation, the production of close encounter products in 47 Tuc should be 2.0 times larger than in M80. This calculation does not account for the detailed dynamical history of the cluster, including factors such as mass segregation, core col-lapse, and possible destruction of wide binaries in dense environments. However, the similar central densities
(0 ¼4:76 and 4.87), central concentration parameters
(c2:0), and total inferred masses (M106:1and 106M ;
Pryor & Meylan 1993) for 47 Tuc and M80, respectively,
Fig.6.—Profile fit to the background-corrected M80 source distribution. The histogram is the average of 1000 background-corrected resamplings of the original source distribution. Smooth solid line: Fit of eq. (1) with
q¼1:44.Dotted line: Distribution of the turnoff-mass stars, i.e., eq. (1) with
[image:10.612.46.293.53.231.2]make them a reasonable comparison. We identify three dif-ferences between the two: a larger core in 47 Tuc than M80, a substantial metallicity difference between 47 Tuc and M80
([Fe/H] is 0.76 and 1.75 of solar, respectively;
Harris 1996), and a possibly high tidal destruction rate for M80 in the Galactic potential (Dinescu, Girard, & van Altena 1999; M80’s orbit is somewhat chaotic, which makes this prediction uncertain).
The brighter X-ray population of M80 seems to be quite similar to that of 47 Tuc (GHE01a): each has two qLMXBs and three CVs brighter than 1032ergs s1. This makes M80
somewhat richer than expected, given its smaller core. Differences may appear in the fainter X-ray sources, where
M80 has 16 sources harder than qLMXBs above 1031ergs
s1 while 47 Tuc has 24 (inside its half-mass radius; C. O. Heinke et al. 2003, in preparation; GHE01a’s smaller area of study identified 18). 47 Tuc may have perhaps four times
as much X-ray emission from sources below 1031 ergs s1
and may have a steeper luminosity function (seexx2.5 and 2.6 above). The fainter sources in 47 Tuc are a mixture of ABs, faint CVs, and MSPs (probably 30–40 above LX¼1030 ergs s1; Edmonds et al. 2003b). Given the
exis-tence of two accreting neutron stars in M80, it seems unlikely that M80 is much poorer in MSPs than 47 Tuc, but radio timing surveys now underway may soon constrain the M80 MSP population. Possible subtle differences between the clusters, if confirmed, may be caused by differences in metallicity or dynamical history, including destruction effects. A larger group of globular clusters is compared in Heinke et al. (2003c) and in Pooley et al. (2003) to investi-gate these and other differences and their effects on X-ray source production.
M80 is unusual in having over 300 identified blue straggler stars in its central regions (Ferraro et al. 1999). Ferraro and collaborators claim that stellar density alone cannot explain this large number (citing the much smaller number in 47 Tuc) and suggest that the large blue straggler population in M80 may be due to its dynamical state on the edge of core collapse. At this stage globular clusters are expected to destroy their binary populations to avert core collapse, possibly producing large quantities of blue strag-glers (Fregeau et al. 2003). However, we note that a simi-larly thorough search for blue stragglers over the central several core radii of 47 Tuc has not yet been done. Ferraro et al.’s (1999) observations of M80 included roughly three core radii on the PC chip, and their searches also extended to the WF chips. Ferraro et al. (2001) identified 43 blue
stragglers in just one pointing ofHSTPC images of 47 Tuc (which did not fully cover the core). This included 36 greater
than 0.8 mag in mF218W above the turnoff, comparable in
brightness to the 129 bright blue stragglers identified in M80 by Ferraro et al. (1999). Assuming a radial distribution of blue stragglers in 47 Tuc similar to that in M80 (Ferraro et al. 1999), we may expect some 130 bright blue stragglers in 47 Tuc, similar to the M80 population. Considering the similarity in the X-ray source populations, this suggests that many blue stragglers are produced by the same mechanisms that produce X-ray binaries. Ferraro et al. (2003) indeed find a good correlation between central density and blue straggler specific frequency for most globular clusters they
study, although another formation route (probably
primordial binaries) seems to be required to explain the blue stragglers in low-density environments such as NGC 288 and the outer regions of M3. It will be of interest to see if these other routes also produce X-ray sources.
4. CONCLUSION
The globular cluster M80 has a varied X-ray population similar to that of 47 Tuc (GHE01a), including two soft sources that are probable qLMXBs, numerous hard sources that are probable CVs (including one probable high-inclination system with high extinction), and a sizable popu-lation of fainter X-ray sources. The two bright soft sources fall upon a calculated neutron star cooling track in an X-ray CMD and are spectrally fitted with hydrogen-atmosphere neutron star models. The brightest CV in the cluster may be the X-ray counterpart of the old nova 1860 T Sco. The radial distribution of the X-ray sources above 10 counts indicates an average system mass of 1:20:2 M and is
similar to the distribution of blue stragglers in the cluster. This is consistent with a mix of binaries containing neutron stars and lighter binaries. The overall X-ray population is slightly larger than expected when the cluster parameters are compared to those of 47 Tuc: this may be connected to the cluster’s unusual orbit. The blue straggler population in M80 may be similar to that in 47 Tuc, and we hope that further theoretical and observational studies will probe the connections between these different tracers of binary hardening and exchange.
C. O. H. acknowledges support from Chandra grant
GO2-3059A.
REFERENCES Aldcroft, T. L., Karovska, M., Cresitello-Ditmar, M. L., Cameron, R. A.,
& Markevitch, M. L. 2000, Proc. SPIE, 4012, 650
Arnaud, K. A. 1996, in ASP Conf. Ser. 101, Astronomical Data Analysis Software and Systems V, ed. G. Jacoby & J. Barnes (San Francisco: ASP), 17
Auwers, G. F. 1862, Astron. Nachr., 58, 374
Balucinska-Church, M., & McCammon, D. 1992, ApJ, 400, 699 Becker, W., et al. 2003, ApJ, 585, 494
Brocato, E., Castellani, V., Scotti, G. A., Saviane, I., Piotto, G., & Ferraro, F. R. 1998, A&A, 335, 929
Brown, E. F., Bildsten, L., & Rutledge, R. E. 1998, ApJ, 504, L95 (BBR) Cool, A. M., Grindlay, J. E., Cohn, H. N., Lugger, P. M., & Slavin, S. D.
1995, ApJ, 439, 695
Cool, A. M., Haggard, D., & Carlin, J. L. 2002, in ASP Conf. Ser. 265, Omega Centauri: A Unique Window into Astrophysics, ed. F. van Leeuwen, J. D. Hughes, & G. Piotto (San Francisco: ASP), 277 Damiani, F., Maggio, A., Micela, G., & Sciortino, S. 1997, ApJ, 483, 370 Daniel, W. W. 1990, Applied Nonparametric Statistics (2d ed.;
PWS: Kent)
Dinescu, D. I., Girard, T. M., & van Altena, W. F. 1999, AJ, 117, 1792
Djorgovski, S. 1993, in ASP Conf. Ser. 50, Structure and Dynamics of Globular Clusters, ed. S. G. Djorgovski & G. Maylan (San Francisco: ASP), 373
Edmonds, P. D., Gilliland, R. E., Heinke, C. O., & Grindlay, J. E. 2003a, ApJ, 596, 1177
———. 2003b, ApJ, 596, 1197
Eracleous, M., Halpern, J., & Patterson, J. 1991, ApJ, 382, 290
Feigelson, E. D., Broos, P., Gaffney, J. A., Garmire, G., Hillenbrand, L. A., Pravdo, S. H., Townsley, L., & Tsuboi, Y. 2002, ApJ, 574, 258 Ferraro, F. R., D’Amico, N., Possenti, A., Mignani, R. P., & Paltrinieri, B.
2001, ApJ, 561, 337
Ferraro, F. R., Paltrinieri, B., Rood, R. T., & Dorman, B. 1999, ApJ, 522, 983
Ferraro, F. R., Sills, A., Rood, R. T., Paltrinieri, B., & Buonanno, R. 2003, ApJ, 588, 464
Freeman, P. E., Kashyap, V., Rosner, R., & Lamb, D. Q. 2002, ApJS, 138, 185
Fregeau, J. M., Gu¨rkan, M. A., Joshi, K. J., & Rasio, F. A. 2003, ApJ, 593, 772
Gehrels, N. 1986, ApJ, 303, 336
Giacconi, R., et al. 2001, ApJ, 551, 624
Grindlay, J. E., Camilo, F., Heinke, C. O., Edmonds, P. D., Cohn, H., & Lugger, P. 2002, ApJ, 581, 470
Grindlay, J. E., Heinke, C. O., Edmonds, P. D., & Murray, S. S. 2001a, Science, 292, 2290 (GHE01a)
Grindlay, J. E., Heinke, C. O., Edmonds, P. D., Murray, S. S., & Cool, A. M. 2001b, ApJ, 563, L53 (GHE01b)
Grindlay, J., et al. 2003, Astron. Nachr., 324, 57
Hakala, P. J., Charles, P. A., Johnston, H. M., & Verbunt, F. 1997, MNRAS, 285, 693
Harris, W. E. 1996, AJ, 112, 1487
Heinke, C. O., Edmonds, P. D., Grindlay, J. E., Lloyd, D. A., Cohn, H. N., & Lugger, P. M. 2003b, ApJ, 590, 809
Heinke, C. O., Grindlay, J. E., Lloyd, D. A., & Edmonds, P. D. 2003a, ApJ, 588, 452
Heinke, C. O., Grindlay, J. E., Lugger, P. M., Cohn, H. N., Edmonds, P. D., Lloyd, D. A., & Cool, A. M. 2003c, ApJ, 598, 501
Hertz, P., & Grindlay, J. E. 1983, ApJ, 275, 105 Johnston, H. M., & Verbunt, F. 1996, A&A, 312, 80 King, I. R. 1966, AJ, 71, 64
Liedahl, D. A., Osterheld, A. L., & Goldstein, W. H. 1995, ApJ, 438, L115 Lloyd, D. A. 2003, MNRAS, in press
Lugger, P. M., Cohn, H. N., & Grindlay, J. E. 1995, ApJ, 439, 191
Mukai, K. 2001, preprint (astro-ph/0112048) Muno, M. P., et al. 2003, ApJ, 589, 225 Pooley, D., et al. 2002a, ApJ, 569, 405 ———. 2002b, ApJ, 573, 184 ———. 2003, ApJ, 591, L131
Predehl, P., & Schmitt, J. H. M. M. 1995, A&A, 293, 889
Pryor, C., & Meylan, G. 1993, in ASP Conf. Ser. 50, Structure and Dynamics of Globular Clusters, ed. S. G. Djorgovski & G. Maylan (San Francisco: ASP), 357
Rutledge, R. E., Bildsten, L., Brown, E. F., Pavlov, G. G., & Zavlin, V. E. 2002, ApJ, 578, 405
Shara, M. M., & Drissen, L. 1995, ApJ, 448, 203 Verbunt, F. 2001, A&A, 368, 137
———. 2002, in ASP Conf. Ser. 265, ! Centauri: A Unique Window in Astrophysics, ed. F. van Leeuwen, J. Piotto, & G. Hughes (San Francisco: ASP), 289
———. 2003, in ASP Conf. Ser. 296, New Horizons in Globular Cluster Astronomy, ed. J. Piotto, G. Meylan, S. Djorgovski, & M. Riello (San Francisco: ASP), in press
Verbunt, F., Elson, R., & van Paradijs, J. 1984, MNRAS, 210, 899 Verbunt, F. & Hut, P. 1987, in IAU Symp. 125, Origin and Evolution of