This is a repository copy of Characterization of selected Nigerian biomass for combustion and pyrolysis applications.
White Rose Research Online URL for this paper: http://eprints.whiterose.ac.uk/85456/
Version: Accepted Version
Article:
Akinrinola, FS, Darvell, LI, Jones, JM et al. (2 more authors) (2014) Characterization of selected Nigerian biomass for combustion and pyrolysis applications. Energy and Fuels, 28 (6). 3821 - 3832. ISSN 0887-0624
https://doi.org/10.1021/ef500278e
[email protected] https://eprints.whiterose.ac.uk/ Reuse
Unless indicated otherwise, fulltext items are protected by copyright with all rights reserved. The copyright exception in section 29 of the Copyright, Designs and Patents Act 1988 allows the making of a single copy solely for the purpose of non-commercial research or private study within the limits of fair dealing. The publisher or other rights-holder may allow further reproduction and re-use of this version - refer to the White Rose Research Online record for this item. Where records identify the publisher as the copyright holder, users can verify any specific terms of use on the publisher’s website.
Takedown
If you consider content in White Rose Research Online to be in breach of UK law, please notify us by
1
Characterisation of selected Nigerian Biomass for
Combustion and Pyrolysis Applications
Femi S. Akinrinola1
, Leilani. I. Darvell1
*, Jenny M. Jones1
, Alan Williams2
, and Joseph A.
Fuwape3.
1. Energy Research Institute, 2. ETII, School of Process, Environmental and Materials Engineering, University of Leeds, LS2 9JT. UK. 3. Department of Forestry and Wood
Technology, Federal University of Technology, Akure, Nigeria.
*Author to whom correspondence should be addressed. Telephone: +44(0)1133432498. Fax: 044
113246 7310. E-mail: [email protected]
Abstract
Biomass is the most utilised form of renewable energy, especially in developing nations, and is a possible replacement for fossil fuel in power generation. The most commonly used method for
recovering energy from biomass is combustion. Many countries are exploring the utilisation of
energy crops and indigenous residues to deliver sustainable sources of biomass. For these bio-resources, detailed characterisation of the fuel properties is essential in order to optimise the
2 abundant agricultural residue, palm kernel expellers (PKE) were characterised for their
combustion properties. Standard characterisation methods such as proximate and ultimate
analyses, metals analysis, and ash fusion test were used for this purpose and the results were compared to some UK biomass. In addition, their thermal conversion was assessed by
thermogravimetric analysis and pyrolysis-gas chromatographyÐmass spectrometry. Finally, combustion studies were conducted by suspending single biomass particles in a methane flame to
obtain information on reactivities and combustion characteristics. Results indicate that the ash fractions in the Nigerian woods were low in K, Si, and Ca, resulting in low calculated alkali
indices, hence these fuels are not predicted to cause severe fouling problems. Furthermore, the
analysis of the evolved product during devolatilisation from Py-GC-MS suggests that the content of oil is high in Gmelina. Finally, the results from the single particle combustion experiments
revealed longer char burn out rate for Lophira and Nauclea when compared with those of
Terminalia and Gmelina.
3 1.0 Introduction
Nigeria has large reserves of gas and solid minerals, and the largest oil reserves in Africa.
Consequently the country has a very high dependence on crude oil, which contributes approximately 27% of the gross domestic product [1]. The current electricity generation
capacity, based largely on fossil fuel sources, is at present about 6GW, in a country with an approximate population of 170 million people [1]. Thus, only about 40% of Nigerians are
connected to the national grid [2, 3]. Nigeria also has vast renewable energy resources, comprising mainly hydro, solar, wind and biomass [4] and these remain largely untapped.
At present, bioenergy sources are used by a significant number of people in rural areas to meet their basic energy needs (cooking, lighting and heating), but this is achieved in an inefficient
way, with a negative impact on peopleÕs health as well as on the environment. It is therefore
important to take adequate measures to modernize its supply, conversion and use in a sustainable way. Biomass resources in Nigeria include woods, agricultural wastes, crop residues, sawdust,
wood shavings, bird and animal litter and dung as well as industrial and municipal solid wastes [5]. These were estimated in Mt as 39.1 fuel wood, 11.2 agricultural wastes, 1.8 sawdust, and
4.1 municipal solid wastes [5]. The highest quantity of woody biomass is found in the rain forest in southern Nigeria, and the highest quantities of crop residues is from the guinea savannah in
the north central region of Nigeria. Agricultural residues include cornstalks, rice husk, cassava peels, palm kernel shells, coconut shells and sugarcane bagasse.
Nigeria is a member of the Ònon-Annex 1Ó countries who are signatories to the Kyoto protocol
4 the atmosphere. The success of CDM projects can earn Nigeria carbon credits which can also be
traded to Annex 1 countries who are trying to achieve their emission limits. The World Bank
identified over 750 CDM projects in Nigeria, which, if implemented, could generate 100 million tonnes of carbon emission reductions annually [3]. As a consequence, the Federal government of
Nigeria has initiated four CDMÕs, three of which concern gas flare reduction, recovery and processing, while the fourth is ÒSave 80 Fuel Wood StovesÓ aimed at introducing the
energy-saving and low polluting ÒSave 80Ó wood stove to the Nigerian Market. According to World Energy Council (WEC) [6], the Federal government of Nigeria has also signed a Memorandum
of Understanding (MoU) to develop forest carbon projects in the country, as well as to establish
a carbon centre for the West African region. Several afforestation projects covering several thousand hectares in many States in Nigeria are completed. These have involved establishing
seedling nurseries, and plantation management [7]. Woods in the plantations include Gmelina, Terminalia, teak, eucalyptus, and pine. Tropical rain forest is the major source of timber supply
and energy crops in Nigeria with high plant diversity of over 4,600 plant species. The forest
covers 10% of the countryÕs land area with over 560 tree species at a range of about 30 to 70 species per hectare for trees ≥ 5 cm diameter at breast height (dbh) [8].
Terminalia superba is a tree found in the tropical lowland forest in Nigeria. The tree is planted around April at the beginning of the rainy season, and thrives on rich, well-drained alluvial soils,
although it can also be cultivated on other soil types namely lateritic sands, gravel and clays,
lava, black basaltic clays and crystalline soils. The wood air dries rapidly, degrades slightly and
is lightweight to medium-weight, with a density ranging from 370Ð730 kg/m³ at a moisture content of about 12% [9]. Once the wood is dried, it becomes stable. The chemical composition
5
Nauclea diderrichil is a tree species found in the humid tropical rainforest of Nigeria and is one
of the known trees in the early stage of forestry practice in Nigeria. This tree is one of the few
local trees that records success under plantation management, although the Forest Commission of Nigeria considers Nauclea to be vulnerable and endangered due to the exploitation since the
19th century [10], and this has led to its rarity in natural forests. In order to ensure regeneration of this species, recent attention has been directed towards plantations, and success is recorded in
the Oluwa and Omo forest reserves, with the establishment of about 1,354 ha of Nauclea
plantations [10]. The trees range from 9- 23.6 m in height and the total above ground biomass
varied from 32.5 t ha-1
to 287.5 t ha-1
between 5 and 30 years [11].
Lophira alata is a tree species in the Ochnaceae family. The tree grows to a maximum height and a diameter at breast height (dbh) of 50m and 180cm respectively, and can also be found in
freshwater forest, around the Niger deltaÕs large coastal rivers, mainly Osun, Ogun and Osse [12].
Gmelina arborea is a short rotation coppice, deciduous tree species, belonging to the
verbenaceae family. Gmelina is from India and Burma, but has a natural distribution extending from the Himalayas in Pakistan to Nepal, Cambodia, Vietnam and southern provinces of China
[13]. Gmelina has a life span of 30Ð50 years and grows fast during the first 5Ð6 years [14]. In Nigeria, Gmelina is mostly found in the tropical rain forest, and covers an estimated 112,000ha
[15]. The tree has high biomass yield, ranging from 83.2 t ha-1
(5 years) to 394.9 t ha-1
(21 years) [8]. Gmelina has been shown to tolerate a wide range of conditions with mean annual rainfall
from 1778 to 2286mm and mean annual temperature of 18 to 28¡C [16]. Thus, Gmelina has been considered to be highly favoured in plantations due to its adaptability to a wide range of soil and
6 tolerates, together with its fast growth rate, ease of propagation from seeds and cuttings, good
coppicing and short rotation, has contributed to its success in plantations [14, 15]. A study
conducted by Fuwape and Akindele [14] showed that Gmelina has high heating value and can be used as fuel in the energy supply chain.
Palm Kernel Expeller is an oil palm residue and Nigeria is one of the largest producers of palm oil. Harnessing this enormous agricultural waste for energy utilization to serve as feedstock for
power plants and also for the production of bio-oils is considered important. The fact that they are abundantly available are amongst the economic reasons of employing them as the major
source for renewable energy [17].
While the forest industry for timber is well established in Nigeria, the sawmill residues are under utilised. It has been estimated that the volume of waste wood generated nationwide (in
approximately 2000 sawmills) is 104,000 m3 per day [18]. Clearly, this is an untapped resource. There is very little information in the open literature concerning the fuel properties of woods and
energy crops in Nigeria and this paper aims to characterise some of the plantation and timber
species (Terminalia superba, Nauclea diderrichil, Gmelina arborea, Lophira alata) and one agricultural residue (palm kernel expeller (PKE), for their fuel, pyrolysis and combustion
characteristics. Results are compared with some typical UK energy crops (willow SRC, miscanthus giganteus, eucalyptus) and one UK residue (wheatstraw).
2.0 Experimental Methods
2.1 Materials
Biomass samples were obtained from sawmills in Nigeria and supplied by Quintas Renewable
7 1.1cm. Prior to analysis, the fuels were reduced to smaller particle sizes using a Retsch cutting
mill SM 100, and milled further using the Retsch PM100 planetary ball mill. The milled fraction
was sieved and the particle size less than 600µm was collected and dried overnight in the oven at a temperature of 600
C, before being stored in a desiccator for further analysis.
2.2 Proximate and ultimate analyses
The moisture, volatile and ash contents were determined using the British standards BS EN 14774-1:2009, BS EN 15148:2009 and BS EN 14775:2009, respectively. The reproducibility for
the proximate analyses was ≤ 0.2%. The fixed carbon content was estimated by difference. A
CE instruments Flash EA 1112 Series elemental analyser was used for measuring the C, H and N contents of the fuel samples milled to <600µm. The measurements were performed in duplicate
and a mean value is reported. The oxygen content was obtained by difference. The relative error for the analysis of C was in the range of 0.1−1.8%, but for H and N the relative error was ≤
0.2%. The sulfur content of the samples was below the detection limits.
2.3 High heating values
The high heating values (HHV) of the five Nigerian biomass samples were measured
experimentally in a bomb calorimeter and were compared with values calculated using the
correlation developed by Friedl et al. [19]. The HHV (dry basis) were calculated using the
elemental analysis on a dry basis as follows:
HHV = 3.55C2
8 2.4 Determination of lignocellulosic fractions
The determination of the lignocellulosic fractions were carried out by the IBERS Analytical
Chemistry Laboratory at the University of Aberystwyth. The gravimetric measurements of Neutral Detergent Fibre (NDF), Acid Detergent Fibre (ADF) and Acid detergent Lignin (ADL)
were made using the Gerhardt fibrecap system, which is the improved version of Van SoestÕs methods [20, 21]. The NDF, which is regarded as the total cell wall is the residue, corrected for
ash, left after refluxing for 1 h in a neutral buffered detergent solution [21]. ADF, the ash corrected residue remaining after refluxing the samples in a solution of Cetyl Ammonium
Bromide (CTAB) in 2 M sulphuric acid is a measure of cellulose and lignin only [21]. ADL was
measured by treating ADF with 72% sulphuric acid to solubilise the cellulose to determine crude lignin. Ash was determined in the samples after heating at 600¡C in a muffle furnace for at least
4 h. The concentration of hemicelluloses and cellulose were calculated according to Equations (2) and (3) respectively.
Hemicellulose % = NDF% Ð ADF% (2)
Cellulose %= ADF% Ð ADL% (3)
2.5 Metal analysis
The ash analysis was performed by TES Bretby Ltd, UK. The ash was obtained according to the British standard method BS EN 14775:2009, and was analysed by inductively coupled plasma
9 2.6 Ash fusion test
Ash Fusion Tests (AFT) were performed on all fuels under oxidising conditions. Cylinders of
ash samples were heated, under an air flow rate of 50 ml/min, in a Carbolite Digital Ash Fusion
Furnace with a black and white camera to capture the deformations of the ash cylinder. The
samples were heated to 1600¡C under a controlled heating rate of 7¡C/min, and images were
recorded at temperature intervals of 5¡C for the temperature range of 550−1600¡C. The ash was
prepared as described in section 2.5. Further details of the method can be found in Baxter et al. [22]. The images captured at different temperatures were analysed to determine the shrinkage
temperature, deformation temperature, hemisphere temperature and flow temperature using the European standard DD CEN/TS 15370-1:2006.
2.7 Fuel pyrolysis and char combustion behavior by thermogravimetric analysis (TGA)
The devolatisation and char combustion behavior of the fuels were investigated using a TA
Q5000 Thermogravimetric analyser. For pyrolysis, a typical mass of ~10 mg of sample was heated at rate of 25¡C min−1
to 700o
C in a purge of nitrogen at a flow rate of 50 ml/min. This
was followed by cooling to ~40¡C before heating up again at a rate of 25¡C min−1 to a final temperature of 900o
C under a constant flow of air (50 ml/min) to obtain the char burning profile.
2.8 Single particle combustion
In order to obtain an insight into the combustion behavior of the Nigerian woody biomass at flame temperatures, single biomass particles were combusted in a methane-air flame. The
experiment involved suspending cubed shaped fuel particles (~2x2x2mm) on a steel needle in a
10 concentration of 10.8±0.3 mol%. The needle was kept in place in a ceramic housing and was
covered by a protective water-cooled sheath when first placed in the flame. For the experiment, the protective sheath was retracted to expose the fuel particle to the methane-air flame. A Fuji
HS10 video camera was used to record the images of the combustion at a speed of 33 frames per second (fps). The images recorded were transferred to the computer and analysed.
2.9 Pyrolysis-Gas Chromatography-Mass Spectrometry (Py-GC-MS)
Py-GC-MS analyses were performed on the samples using a CDS 1000 pyroprobe attached to a HP 5890 series II Gas Chromatograph fitted with a Rtx 1701 60m capillary column (0.25 id and
0.25μm film thickness). The oven was held at a temperature of 70o
C for 2 min and then the
temperature was increased at a rate of 20oC min−1 to a final temperature of 250oC, and held for 15 min. Approximately 2 mg of sample were placed in a 20 mm silica tube between two plugs of
quartz wool. The sample was then pyrolysed at a maximum temperature of 600oC with a nominal
ramp rate of 20¡C ms−1 and a final dwell time of 20s. Pyrolysis products were identified from the chromatograms with the assistance of a mass spectral detection library (NIST 05A MS library) and
also by comparisons with values found in Nowakowski et al. [23].
3.0 Results and Discussion
3.1 Proximate and ultimate analyses
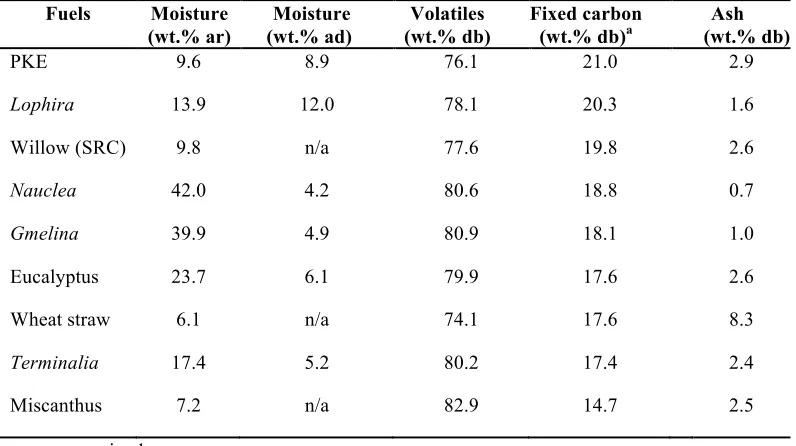
The results from the proximate analysis of the Nigerian fuels are listed in Table 1 and compared to some energy crops and an agricultural residue (wheat straw). The moisture content of
Nauclea was over 40% and therefore required further air-drying at 60oC for 72hr in order to
11 in Table 1. The results show that all the Nigerian woods have lower ash contents than the UK
energy crops included in this study. Gmelina and Nauclea have particularly low ash at ≤ 1.0%.
The fixed carbon contents of the Nigerian woods show a similar range to UK woods- Lophira
and short rotation willow coppice are comparable (20.3 and 19.8 wt.% respectively), while
[image:12.612.67.465.304.527.2]Terminalia, eucalyptus, and wheat straw have lower fixed carbon contents- between 17.4-17.6 wt.%.
Table 1. Proximate analysis of the fuels studied
Fuels Moisture (wt.% ar)
Moisture (wt.% ad)
Volatiles (wt.% db)
Fixed carbon (wt.% db)a
Ash (wt.% db)
PKE 9.6 8.9 76.1 21.0 2.9
Lophira 13.9 12.0 78.1 20.3 1.6
Willow (SRC) 9.8 n/a 77.6 19.8 2.6
Nauclea 42.0 4.2 80.6 18.8 0.7
Gmelina 39.9 4.9 80.9 18.1 1.0
Eucalyptus 23.7 6.1 79.9 17.6 2.6
Wheat straw 6.1 n/a 74.1 17.6 8.3
Terminalia 17.4 5.2 80.2 17.4 2.4
Miscanthus 7.2 n/a 82.9 14.7 2.5
ar, as received
ad, after air drying at 60oC
db, dry basis (after air drying at 60oC)
n/a: not applicable
aCalculated by difference
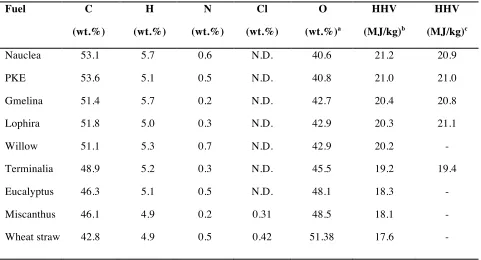
Table 2 shows the ultimate analysis of the fuels. The C content of the Nigerian fuels is comparable to that of willow and it is >50 wt.%, except for Terminalia. PKE and Nauclea
12 which were in the range 19.4-21.1 MJ kg-1
. The experimental HHVs are also listed in Table 2,
and were in good agreement with the calculated values (<4% error). The H content in
miscanthus and wheat straw is low (< 5 wt.%), while the nitrogen content of the fuels is <1%, and range from 0.2 to 0.7%. The fuels with the highest nitrogen contents are Nauclea and
willow (0.6-0.7%). The contents of sulphur and chlorine in all the fuels were below the detection limits, except for miscanthus and wheat straw, which resulted in a chlorine content of
[image:13.612.67.548.330.590.2]0.31 and 0.42 wt.%, respectively.
Table 2. Ultimate analysis and HHV of the fuels on a dry basis (db).
Fuel C
(wt.%) H (wt.%) N (wt.%) Cl (wt.%) O (wt.%)a HHV (MJ/kg)b HHV (MJ/kg)c
Nauclea 53.1 5.7 0.6 N.D. 40.6 21.2 20.9
PKE 53.6 5.1 0.5 N.D. 40.8 21.0 21.0
Gmelina 51.4 5.7 0.2 N.D. 42.7 20.4 20.8
Lophira 51.8 5.0 0.3 N.D. 42.9 20.3 21.1
Willow 51.1 5.3 0.7 N.D. 42.9 20.2 -
Terminalia 48.9 5.2 0.3 N.D. 45.5 19.2 19.4
Eucalyptus 46.3 5.1 0.5 N.D. 48.1 18.3 -
Miscanthus 46.1 4.9 0.2 0.31 48.5 18.1 -
Wheat straw 42.8 4.9 0.5 0.42 51.38 17.6 -
a
Calculated by difference,
b
Calculated using Eq. (1)
c
13 3.2 Slagging and fouling indices
It is known that the occurrence of alkali and alkaline earth metals in the fuel causes slagging and
other forms of fireside deposits [24]. The metal salts in biomass will combine with oxygen to form metal oxides in the ash during combustion, together with chlorides, sulphates and
phosphates. Depending upon the ash characteristics it might form hard deposits on the heat exchanger surfaces and boiler walls. K and Na, together with SiO2 form low melting point ash
mixtures. Thus high alkali content in fuels causes severe slagging on the boiler grate or in the bed and because of its volatility, also results in fouling of convection heat transfer surfaces [24].
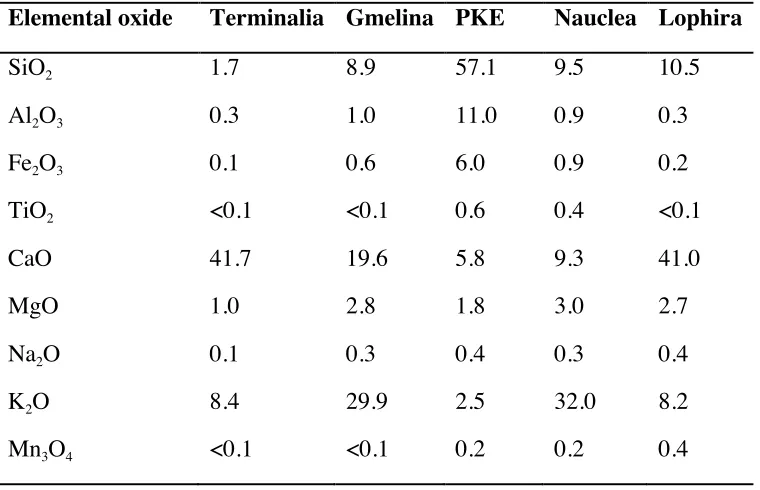
Table 3 lists the main components of the fuels ash. Terminalia and Lophira have high CaO
content, while the most abundant component in the Gmelina and Nauclea ash is K2O.
Therefore, these two pairs of woody biomass are expected to have very different ash melting
[image:14.612.68.448.469.714.2]behavior. In the case of PKE, silica is the main ash component.
Table 3.Ash composition of the fuels (wt. %)
Elemental oxide Terminalia Gmelina PKE Nauclea Lophira
SiO2 1.7 8.9 57.1 9.5 10.5
Al2O3 0.3 1.0 11.0 0.9 0.3
Fe2O3 0.1 0.6 6.0 0.9 0.2
TiO2 <0.1 <0.1 0.6 0.4 <0.1
CaO 41.7 19.6 5.8 9.3 41.0
MgO 1.0 2.8 1.8 3.0 2.7
Na2O 0.1 0.3 0.4 0.3 0.4
K2O 8.4 29.9 2.5 32.0 8.2
14
P2O5 0.7 0.5 0.7 6.4 2.2
SO3 1.5 1.7 1.5 4.1 3.5
The alkali index (AI) presents the quantity of alkali oxide in the fuel per unit of fuel energy (kg alkali GJ-1
). The alkali index is frequently used as a threshold pointer for fouling [24]. The
upper limit for the alkali index is 0.34 kg alkali GJ kg-1
- above this point, fouling is definitely expected to occur [24, 25]. The alkali indices for the fuels studied were calculated using
equation (4) and are shown in Table 4.
AI = kg (K2O + Na2O)/GJ. (4)
The base to acid ratio index is normally used to predict the slagging tendency of a fuel. The base
to acid ratio (Rb/a) is defined as the ratio of the basic metal oxides to the acidic oxides in the ash,
as presented in equation (5) [26].
Rb/a = % (Fe2O3 + CaO + MgO + K2O + Na2O) / %( SiO2 + TiO2 + Al2O3 + P2O5) (5)
Thus as the Rb/a value increases, due to the higher concentration of basic components in the ash,
there is a tendency for lowering of the ash melting point, and therefore increasing its potential for
slagging. The base to acid ratios and base percentage calculated for the Nigerian fuels are also
shown in Table 4. Generally, the intrinsic mineral matter contained in biomass is lower than in coal, although this can be considerably higher in some species of grasses and agricultural
residues [24]. The ash content of the Nigerian fuels are lower or at least comparable to those from the UK energy crops listed in Table 1, and are much lower than wheat straw. From Table
4, it is observed that the alkali index for all the fuels is below the 0.34 GJ kg-1
threshold value and hence these fuels are not predicted to cause severe fouling problems. Gmelina is expected to
15 indicator. Table 4 also shows the base to acid ratios (Rb/a) calculated for the Nigerian fuels.
From the Rb/a in Table 4, we can observe that Terminalia, Gmelina, and Lophira can be expected
to have a higher tendency to form ash deposits in the combustion chamber than Nauclea and PKE. However, the Nigerian PKE presented a lower value for Rb/a in comparison to the value
[image:16.612.66.482.288.363.2]reported for the imported PKE in Darvell et al. [26], which was calculated at 2.93.
Table 4. Slagging and fouling indices
Parameter PKE Lophira Gmelina Terminalia Nauclea
Alkali Index (kg alkali/GJ) 0.04 0.07 0.15 0.10 0.11 Rb/a (including P2O5) 0.24 4.04 5.12 19.00 2.65
Base Percentage (%) 16.5 52.5 53.2 51.3 45.5
3.5 Ash fusion test
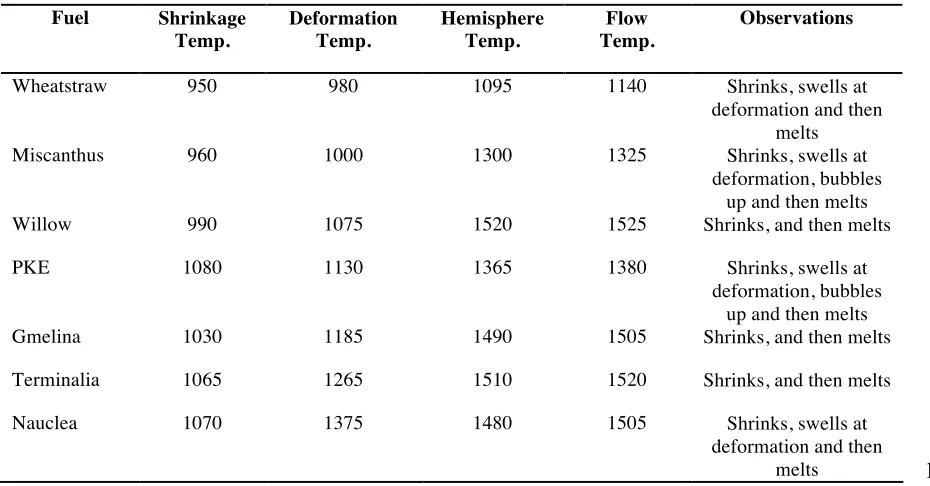
The temperatures for the four ash melting characteristic states: shrinkage, deformation, hemisphere, and melting, were determined for all the samples studied and are listed in Table 5. It is to be noted that these temperatures are determined visually, therefore there is an inherent
error in their estimations. In the case of the estimation of the shrinkage temperature, this error may be larger, since the contrast of the images collected at lower temperatures is poor.
Descriptions of the melting behaviour of the test pieces are also included in Table 5. It was
observed that the ashes from both PKE and miscanthus shrink then swell during the deformation stage, this is followed by bubbling and then melting. Nauclea ash was also observed to swell
upon deformation (before melting). Further comparison of the deformation temperature can be
16 several biomass are seen to pass through a minimum (parabolic curve) when plotted against base
percentage; the minimum being in the range 35-55% basic oxides in the ash. The base
percentage of the Nigerian woods also fall in this range (see Table 4) and thus it can be assumed that, like many other woods and biomass fuels, deposition will require careful monitoring and
control if these fuels are utilized in high temperature combustion systems. However, it is also important to note that the values reported in this paper represent an average composition of the
wood fuels, including the bark component. Clean white wood fuels have much lower ash contents and different ash compositions than those with bark [28, 29]; furthermore there is
variability in ash composition depending on the type of fibre (heartwood, branch wood, top
branches, etc.) [28]. Thus, good fuel quality management is used by most power companies to help alleviate potential fuel deposition problems [30-32] and, based on these results, similar fuel
[image:17.612.66.531.468.711.2]quality management is recommended for the Nigerian energy crops and woods.
Table 5. Ash Fusion Test (AFT) characteristic temperatures (oC)
Fuel Shrinkage Temp.
Deformation Temp.
Hemisphere Temp.
Flow Temp.
Observations
Wheatstraw 950 980 1095 1140 Shrinks, swells at
deformation and then melts
Miscanthus 960 1000 1300 1325 Shrinks, swells at
deformation, bubbles up and then melts
Willow 990 1075 1520 1525 Shrinks, and then melts
PKE 1080 1130 1365 1380 Shrinks, swells at
deformation, bubbles up and then melts
Gmelina 1030 1185 1490 1505 Shrinks, and then melts
Terminalia 1065 1265 1510 1520 Shrinks, and then melts
Nauclea 1070 1375 1480 1505 Shrinks, swells at
17 Fuel Shrinkage
Temp.
Deformation Temp.
Hemisphere Temp.
Flow Temp.
Observations
Eucalyptus 950 1430 1445 1455 Shrinks and then melts
Lophira 1110 1430 1455 1475 Shrinks, and then melts
3.6 TGA Analysis
The devolatilisation and char burning profiles of the UK and Nigerian fuels were used to study
their combustion behaviour. Typical plots of the derivative of the mass loss curve with time
(DTG) obtained during the temperature programmed pyrolysis and char combustion of the fuels
in a thermogravimetric analyser are shown in Figures 1(a)-(e). There is a very small peak
observed at a temperature <100oC on the devolatilisation profile, which is due to moisture
evaporation, whilst the second (main) peak between 200-400oC is due to volatile release. During
this stage the lignocellulosic components decompose at different rates. Often two peaks are seen
corresponding to hemicellulose followed by cellulose decomposition over a narrow temperature
window, as can be observed in the PKE plot (Fig. 1(d)). The DTG curves of Terminalia and
Lophira show a main peak with a shoulder at lower temperatures, which is normally considered
to arise from hemicellulose decomposition due to its less stable structure, while the main peak is
considered to be mainly due to the degradation of cellulose. In contrast, only one peak can be
observed for the devolatilisation of Gmelina and Nauclea (after drying). These observations are
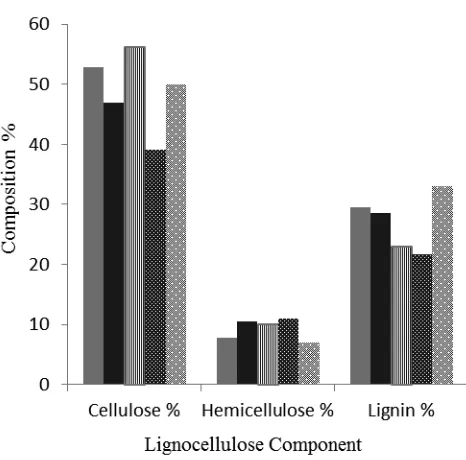
consistent with the comparative amounts of hemicellulose found in the fuels. The lignocellulosic
composition of the Nigerian fuels are shown in Figure 2. It can be observed that the fuels with
higher hemicellulose content, e.g. PKE and Terminalia resulted in a more pronounced
18
decomposition occurs over a wide temperature range because of its cross-linked structure and
aromatic nature, resulting in a much broader peak [33]. It can be noted that very small peaks can
be observed in the DTG plots for Lophira and Terminalia at a temperature range 460-620oC.
These peaks can be attributed to the decomposition of calcium present in the fuels. This was
investigated by TGA pyrolysis studies of the fuels with added CaC2O4 (results not shown), which
confirmed that the occurrence of these peaks in the DTG curves for Terminalia and Lophira
result from the decomposition of CaO, which accounts for ~41% of their ash (see Table 3). The
mass remaining after pyrolysis is the char, which was cooled down before being heated up in air
to obtain the corresponding char burning profile. The char burning profiles have also been
plotted in Figs. 1(a)-(e) for the fuels studied. In these DTG plots, a single peak can be observed
at temperatures ~300-500oC due to the char combustion stage. The peak temperatures for the
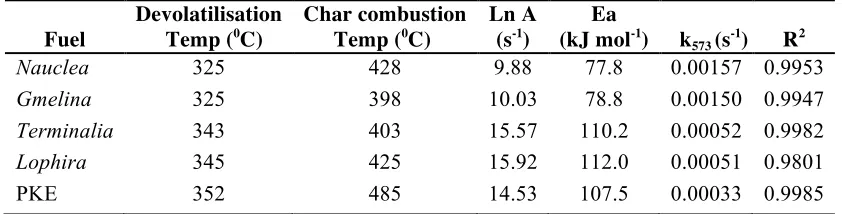
devolatilisation and char combustion stages for all the fuels studied are listed in Table 6. The devolatilisation and char combustion peak temperatures are often used as indicators of fuel
reactivity- the lower the peak temperature, the more reactive the fuel is [34]. The respective peak temperatures for the devolatilisation of Gmelina and Nauclea are lower compared to the
rest of the Nigerian fuels suggesting that these fuels would be the most reactive. Their tendency to pyrolyse faster than the other fuels is likely due to their relatively high potassium content,
since it is known to catalyse pyrolysis reactions [23, 34]. Previous work has shown that the peak temperature for volatile combustion decreases as the potassium content of the fuel increases [23,
34, 35]; still potassium remains a problem in biomass ash as it causes slagging and fouling issues
20 Figure 1. DTG plots for the pyrolysis in nitrogen to 700o
C and subsequent char combustion in air
to 900o
[image:21.612.75.308.149.379.2]C of the fuels, where: (a) Gmelina, (b) Lophira, (c) Nauclea, (d) PKE and (e) Terminalia.
Figure 2. Lignocellulosic composition of the fuels.
The kinetic parameters for the pyrolysis of the fuels were estimated from the TGA mass loss
curves obtained and are listed in Table 6. For this, it was assumed a global first-order reaction
rate [36-41] and the pre-exponential factors A (s-1) and activation energies Ea (kJ/mol) were
calculated according to the reaction rate constant method [41-43]. The correlation coefficients
(R2) are also reported in Table 6. The ranking of the Ea follows the same order with the rate of
reactivity using DTG peak pyrolysis temperature except for PKE, which showed the highest peak
temperature but resulted in a slightly lower activation energy than both Terminalia and Lophira.
For comparison purposes, the pyrolysis reactivities of the fuels were estimated at 573K (k573),
21
value of k at the reference temperature, the more reactive the fuel is [41, 43, 44]. From the data
in Table 6, we can expect that at 573K Nauclea and Gmelina would pyrolyse faster than
Terminalia and Lophira, and that PKE would be the least reactive fuel. As expected, the same
[image:22.612.64.485.248.355.2]order of reactivity is obtained when comparing the peak temperatures for devolatilisation.
Table 6.Kinetic parameters for the devolatilisation of the fuels and DTG peak temperatures.
Fuel
Devolatilisation Temp (0C)
Char combustion Temp (0C)
Ln A (s-1)
Ea
(kJ mol-1) k573 (s -1
) R2
Nauclea 325 428 9.88 77.8 0.00157 0.9953
Gmelina 325 398 10.03 78.8 0.00150 0.9947
Terminalia 343 403 15.57 110.2 0.00052 0.9982
Lophira 345 425 15.92 112.0 0.00051 0.9801
PKE 352 485 14.53 107.5 0.00033 0.9985
3.7 Combustion at flame temperatures
The video images recorded from the single particle combustion in a methane flame experiments
were analysed to gain an insight into the combustion behaviour of the fuels at high heating rates/high temperature, and the following stages could be clearly identified from these images:
ignition, volatile combustion, and char combustion. Consequently, the visual analysis of the images allowed the estimation of the ignition delay, and of the duration of the volatile and char
combustion stages. In this work, the ignition of a fuel particle was assumed once flaming combustion was visible, after exposure to the flame. When the biomass particle enters the flame
it undergoes the process of heating-up, moisture evaporation and then ignition [45, 46]. For the particle size studied here, the ratio of heat convected to the surroundings to heat conducted to the
surface, i.e. the Biot Number, which is affects the heating-up process and the ignition delay, can
22 biomass was oven dried (~5- 12% moisture). Ignition usually marks the beginning of volatile
combustion and the end of moisture release. In combustion processes, the moisture content in the
fuel particle is important because the requirement to dry the particles in the flame before they heat up and ignite causes a delay in the ignition process and can result in lifted or unstable
pulverized fuel flames [47]. The lignocellulosic components of the fuels differ - softwoods have a smaller fraction of hemicellulose and a higher fraction of lignin when compared to hardwoods,
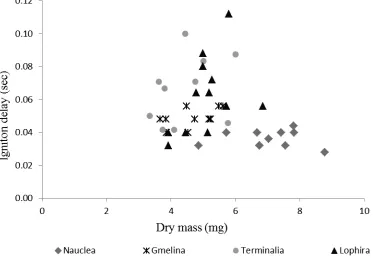
[image:23.612.78.452.311.588.2]and hemicellulose reacts faster at the lowest temperature when compared to cellulose and lignin [48]. A plot of the ignition delay against particle original dry mass is presented in Figure 3.
Figure 3. Plot of the ignition delay against particle dry mass.
From Figure 3, it can be observed that there were differences in the ignition delay of the studied
23 particle mass than Terminalia and Lophira. However, in this case this is probably due to the
chemical composition of Nauclea and Gmelina and both fuels having significantly low moisture
contents when compared with Lophira. Density and thermal conductivity differences of the woods will also influence moisture and volatile diffusion rates as well as heating rates. The
ignition delay of Nauclea, Terminalia, Lophira and Gmelina ranged from 0.03 Ð 0.05s, 0.04 Ð 0.10s, 0.03 Ð 0.11s and 0.04 Ð 0.06s respectively, with error ≤ ± 0.008s due to video frame speed.
The spread in ignition delay arises in part from the difficulty in cutting particles to exactly the same size and also, in part, to the homogeneity of moisture content in individual particles. On
average, Nauclea and Gmelina ignite faster- indicating that these fuels may be more reactive. As
discussed in section 3.6, the temperature of maximum volatile production rate is ~ 20oC lower for Nauclea and Gmelina compared to Terminalia and Lophira (see Table 6).
Video interrogation of the combustion of single particles revealed overlap of volatile (flaming) combustion and char (glowing) combustion in most cases, where char combustion proceeded at
the bottom of the particle while volatile release and combustion occurred from the top of the
particle. Even so, the combustion processes were analysed as independent steps, which are discussed in this section. Volatile combustion was observed as the first stage following ignition,
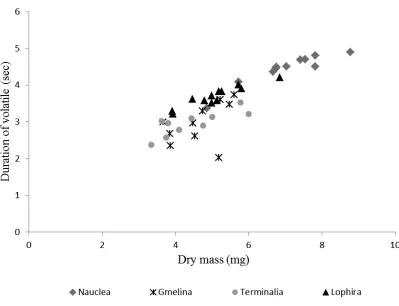
where the particles pyrolysed and volatile organic compounds were released. Figure 4 shows the duration of volatile combustion plotted against the particlesÕ initial dry mass. During this stage,
the particles were seen to undergo devolatilisation and the volatile materials released were combusted resulting in a flame. The volatile content, and therefore its rate of release, differ for
all the fuels due to their composition (see Table 1), and also due to the differences in mass. This accounted for the variation in the duration of devolatilisation/volatile combustion of the fuels.
24 be seen in Figure 4. There is quite a clear distinction between Nauclea and the other fuels, as
similar sized particles are heavier in mass when compared to the other fuels. This resulted in a
relatively lengthier volatile combustion stage (3.37-5.26s). The flame duration for Terminalia,
Lophira and Gmelina ranged from 2.38-3.53s, 3.22-4.21s and 2.02-3.74s, respectively (error ≤ ±
0.008s). Lophira also had slightly longer flame duration than Terminalia, and Gmelina possibly due to slower release of volatile matter and also to variations in wood density. After flaming
combustion, when all volatiles have been released, the volatile flame extinguishes, and oxygen can reach the residual char particle and heterogeneous char combustion commences. This
process continues until the char is eventually reduced to a small mass of ash. It was also
observed that shortly after devolatilisation, the particle started to shrink and then shrinks more rapidly towards the end of the combustion reaction until the residual ash was left attached to the
supporting needle, i.e. the video evidence is consistent with a Òshrinking sphereÓ model for char combustion (Zone II or III) where there is a contribution to the observed combustion rate from
diffusion processes. For this work, the duration of char burnout was estimated from the end of
26 Figure 5. Duration of char burnout versus initial fuel particle dry mass.
From figure 5, it can be seen that the duration for char burnout for Terminalia, and Gmelina were
comparable, and ranged from 7.7-11.9s (error ≤ ± 0.008s), whilst the Lophira and Nauclea
particles showed distinctly longer char burnout stages (9.7-19.1s and 21.6-39.5s respectively). The major factors controlling char burnout are (i) the mass of char remaining after
devolatilisation, (ii) the chemical factors determining the amount of high-temperature volatiles
produced and on the development of char porosity, (iii) the amount of catalytic metals present in the char (iv) the chemical reaction rate of the char combustion, and (v) the diffusion rates.
Lophira and Nauclea have higher fixed carbon contents and higher heating values than the other
27 and porosity may also contribute to differences in char combustion rates. Terminalia, which has
an average wood density of 550 kg m-3
and Gmelina with average wood density of 530 kg m-3
are
classified as medium density woods, while Nauclea (760 kg m-3 average wood density) and
Lophira (with 940 kg m-3
average wood density) are classified as high-density woods. The
higher mass per unit volume as well as possible depletion of amount of catalytic metals present in the resultant chars of could be responsible for the longer burn out rate of Lophira and
NaucleaÕs chars when compared with those of Terminalia and Gmelina; further work will establish the porosity development during devolatilisation and provide added insight into the
observed differences in burnout rates. The slightly higher burnout times observed in Nauclea
compared to Lophira could be due to NaucleaÕs relatively higher elemental carbon content (see Table 2).
3.8 Pyrolysis-Gas Chromatography-Mass Spectrometry
Pyrolysis Gas Chromatography-Mass Spectrometry was used to investigate the different organic
groups in the volatiles released. The technique involves rapid heating of the fuels which results in the release of volatile organic compounds and other volatile components from cellulose,
hemicellulose and lignin in a similar way to flash pyrolysis [49]. The analysis highlights the differences in biomass composition and structure of the fuels. Table 7 shows the selected marker
compounds for oil and lignocellulosic fractions in the Nigerian fuels, including PKE. The chromatograms obtained from the pyrolysisÐGCÐMS of the Nigerian fuels (with assignments to
the main peaks) are presented in figures 6 Ð 10. The main peaks were assigned from the mass spectral detection NIST05A MS library and also from the literature [23, 35]. A wide variation of
28 including long chain fatty acids, are observed in the chromatograms. Figure 11 shows a
comparison of the decomposition products from the Py-GC-MS analyses for the fuels studied
against their dry weight percentage. The peak area percentages were calculated from the chromatograms and normalised per mg of volatile products as detailed in Nowakowski et al.
[23]. The decomposition products are also grouped into their various lignocellulosic components
as shown in Table 7. The peak area percentages were calculated from the chromatograms and quantified as a percentage of the fuel sample dry weight, which are listed in Table 8. The main
products from their pyrolysis are methoxyphenols- originating from the degradation of their
lignin fraction in the temperature ranges from 250-500OC [50, 51]. The fast pyrolysis of the
lignin fraction resulted in monomeric phenolic compounds and oligomers with different degrees
of polymerization- these lignin-derived products are primarily responsible for the high-molecular
weight and viscosity of bio-oils [49]. The conversion process and resultant products in fast
pyrolysis depend on several operating parameters [52]. The most important parameters are the pyrolysis temperatures and heating rates, which determine the final yields of products obtained:
bio-oil, noncondensable gases or char [33, 49, 52-54]. The mineral content in biomass also
affects the quantity and quality of the products yields [53]. The literature suggests that high
contents of monovalent potassium and divalent calcium in fuels are responsible for the lower
organic volatile yield and may promote dehydration of holocellulose and demethoxylation of lignin
units during pyrolysis [33, 49, 52-56]. This is consistent with our findings, since Terminalia,
which has the highest CaO content (41.7 wt.%) records the highest peak area % for lignin products
especially for methoxy-phenols and phenols (see figure 11). Depolymerization is the main
process responsible for the decomposition of holocellulose during fast pyrolysis [56]. Qiang et
29
anhydrosugars (mainly levoglucosan), furans and other products, although the high content of
CaO in the fuel reduces the formation of levoglucosan. The presence of calcium promotes
glucose fragmentation instead of cellulose depolymerisation [56]. Levoglucosan, is often the
main product formed from the depolymerisation reaction of cellulose [56]. Further cellulose
degradation also leads to formation of furan and acids. During the pyrolysis of PKE, most of the
furan compounds form from the dehydration of carbohydrates [57]. Table 8 shows the relative
percentages of the volatile products that originate from the decomposition of the different
lignocellulosic fractions and oil. It can be observed that Gmelina and PKE are the only fuels that
present oily compounds in their volatile fraction. Finally, the volatile yields from the py-GC-MS
experiments (Table 8) are slightly higher than the measured volatile content (Table1). This is
expected, since the pyroprobe is a flash pyrolysis technique that involves the rapid heating of
30
Table 7.Classification of pyrolysis products into lignocellulosic groups [23, 51, 58].
Component Degradation
temperature
Evolved compounds
Hemicellulose 150-350o
C 1,3-Pentadiene,
3-Methyl-1,2-cyclopentanedione,
1-methyl-4-(1-methylethenyl)-cyclohexanol Cellulose 275-350o
C Furan,
2-methyl furfural, 1,2-Cyclopentanedione,
Lignin 250-550o
C 2-methoxylphenol; 2-methoxy-methylphenol; 4-methylphenol; 4-ethyl-2-methoxyphenol;
2-Methoxy-4-vinylphenol; Eugenol; 2,6-dimethoxyphenol; Phenol, 2-methoxy-4-(prop-1-enyl) phenol, 1,2,4-Trimethoxybenzene;
1-(4-hydroxy-3-methoxyphenyl)-ethanone 3',5'-Dimethoxyacetophenone
1-(4-hydroxy-3-methoxyphenyl)-2-propanone 2,6-dimethoxy-4-(prop-2-en-1-yl) phenol Methylparaben; Vanillin.
Extractives 250-550oC Decanoic acid Desaspidinol Hexadecanoic acid 6-Octadecenoic acid,
Table 8. Quantification of volatile yields into lignocellulosic groups (peak area %)
Sample Hemicellulose Cellulose Lignin Extractives
High-heating rate volatile yields
Lophira 2.8 <1 97.2 <1 87.1
Terminalia 11.1 1.1 87.8 <1 82.5
Gmelina 0.6 5.5 81.4 12.5 84.2
PKE <1 25 72.3 2.7 79.6
[image:31.612.66.496.554.684.2]31
0 5 10 15 20 25 30 35 40 45 50 55 60
0 2000000 4000000 6000000 8000000 10000000 12000000 16 15 14 9 10 11 13 12 8 1 2 3 4 5 6 7 A bunda nc e
Retention Time (min)
Figure 6. Py GC-MS chromatogram of Nauclea showing assigned peaks. The main peaks are assigned as follows: 1: 1,3-pentadiene, 2: cyclohexanol, 1-methyl-4-(1-methylethenyl)-, acetate; 3: methoxyphenol; 4: methoxy-4-methylphenol; 5: 4-ethyl-methoxyphenol; 6: 2-methoxy-4-vinylphenol; 7: eugenol; 8: 2,6-dimethoxyphenol; 9: 2-methoxy-4-(1-propenyl) phenol -; 10: 1,2,4-trimethoxybenzene; 11: vanillin; 12: ethanone, 1-(4-hydroxy-3-methoxyphenyl); 13: 3',5'-dimethoxyacetophenone; 14&15: 2,6-dimethoxy-4-(2-propenyl)phenol.
0 5 10 15 20 25 30 35 40 45 50 55 0 2000000 4000000 6000000 8000000 10000000 16 15 14 13 12 11 10 9 8 7 6 5 4 3 2 A bunda nc e
[image:32.612.77.280.102.300.2]Retention Time (min) 1
[image:32.612.89.288.417.609.2]2,6-32 dimethoxyphenol; 11: 2-methoxy-4-(1-propenyl)-phenol; 12: 1,2,4-trimethoxybenzene; 13: vanillin; 14: ethanone, 1-(4-hydroxy-3-methoxyphenyl); 15: 3',5'-dimethoxyacetophenone; 16: 2,6-dimethoxy-4-(2-propenyl)phenol.
0 5 10 15 20 25 30 35 40 45 50 55 60 65 70
0 1000000 2000000 3000000 4000000 5000000 6000000 7000000 8000000 9000000 18 17 16 15 14 13 12 11 10 9 8 7 6 5 4 3 2 A bunda nc e
Retention Time (min) 1
Figure 8. Py GC-MS chromatogram of PKE showing assigned peaks. The main peaks are assigned as follows: 1: furan, methyl-; 2: furfural; 3: phenol; 4: methoxyphenol; 5: 2-methylphenol; 6: 4-2-methylphenol; 7: 2-methoxy-4-2-methylphenol; 8: 4-ethyl-2-methoxyphenol; 9: methoxy-4-vinylphenol; 10: methoxy-3-(propenyl)phenol; 11: 2,6-dimethoxy-phenol; 12: 2-methoxy-4-(1-propenyl)-phenol; 13: 1,2,4-trimethoxybenzene; 14: vanillin; 15: 3',5'-dimethoxyacetophenone; 16: 2,6-dimethoxy-4-(2-propenyl)-phenol; 17: n-hexadecanoic acid; 18: 6-octadecenoic acid.
0 5 10 15 20 25 30 35 40 45 50 55 0 2000000 4000000 6000000 8000000 10000000 16 15 14 13 12 11 10 9 8 7 6 5 4 3 2 Ab u n d a n ce
Retention Time (min)
1
[image:33.612.74.282.120.319.2] [image:33.612.78.285.442.623.2]
33 3',5'-dimethoxyacetophenone; 14: 2-propanone, 1-(4-hydroxy-3-methoxyphenyl)-; 15: 2,6-dimethoxy-4-(2-propenyl)phenol; 16: 2,4-hexadienedioic acid, 3,4-diethyl-dimethyl ester.
0 5 10 15 20 25 30 35 40 45 50 55 60 65 70 0 1000000 2000000 3000000 4000000 5000000 6000000 7000000 8000000 9000000 18 17 16 15 14 13 12 11 10 9 8 7 6 5 4 3 2 Ab u n d a n ce
Retention Time (mins)
[image:34.612.74.283.114.286.2]1
35 Figure 11. Key markers from the Py-GC-MS analysis of the Nigerian fuels.
4.0 Conclusions
Four Nigerian woods: Gmelina, Lophira, Terminalia, and Nauclea, and a residue- palm kernel expeller (PKE) have been characterised and studied for their combustion properties. The fuels
were characterised by proximate and ultimate analysis and compared with some UK energy crops. Additionally, pyrolysis and char burning profiles of the fuels were obtained by
thermogravimetric analysis to assess their combustion properties, and the ash slagging and
fouling propensity of these fuels were also estimated. It was found that the Nigerian fuels studied here have higher carbon contents (49-53% dry basis) than the UK energy crops included
in this study -for comparison purposes. Their higher carbon content resulted in the relatively high (for woody biomass) calorific values of 19-21 MJ kg-1
(dry basis). Ash contents are
relatively low and fall in the range of 0.7-2.2 wt.% (dry basis). The ash compositions are dominated by calcium oxide, potassium oxide and silica. Ash compositions are very different
between the four Nigerian woods with silica contents ranging from 1.7-10.5%, potassium oxide contents ranging from 8.2-32% and calcium oxide contents ranging from 9.3-41.7%. Although
the potassium oxide content in the ash is high, particularly in the case of Gmelina and Nauclea,
36 problems in boilers. The base percentages fall in the range 45-53%, which is the expected range
for low melting ashes, although the ash fusion test results under oxidizing conditions show that
these ashes begin to deform at temperatures above 1200oC (except for Gmelina- at 1185oC). These mixed findings suggest that careful management of fuel quality (such as debarking) and
boiler operation would be advisable for high temperature combustion applications. Analysis from TGA showed differences in the combustion properties of these fuels. The high content of
potassium in Gmelina appears to influence the combustion properties of the fuel, since the peak temperature for volatile combustion is lower than for all other fuels (except wheat straw),
indicating that the fuel is more reactive. The results from the single particle combustion
experiments revealed that Lophira and Nauclea showed relatively longer char burnout stages than Gmelina and Terminalia. This may be due to the differences in wood density. Further
work is needed in order to examine porosity development during char formation and how this impacts on char combustion rates.
Acknowledgments
The authors are grateful to the Energy Programme (Grant EP/H048839/1) for partial financial
support. The Energy Programme is a Research Councils UK cross council initiative led by EPSRC and contributed to by ESRC, NERC, BBSRC and STFC. Akinrinola is also thankful to
the Niger Delta Development Commission (NDDC) Overseas Scholarship Scheme, for partly funding his PhD studies. Special thanks to Quintas Renewable Energy Solutions Limited for
37
References
1. Central Intelligence Agency, C.I.A. The World Factbook. 2012 14/12/2012 [cited 2013 02/01/2013]; Available from: https:// www.cia.gov/library/publications/the-world-factbook/geos/ni.html.
2. Jekayinfa, S.O. and Scholz, V., Potential Availability of Energetically Usable Crop Residues in Nigeria. Energy Sources Part A-recovery Utilization and Environmental Effects, 2009. 31(8): p. 687-697.
3. Fall, L., WEC Regional Forum on Energy Efficiency, ÒRecommendations & Follow-upÓ, 2007: Abuja, Nigeria.
4. Ibitoye, F.I. and Adenikinju, A., Future demand for electricity in Nigeria. Applied Energy, 2007. 84(5): p. 492-504.
5. Sambo, A.S., The challenges of sustainable energy development in nigeria, in Nigerian Society of Engineers Forum2009, Energy Commission of Nigeria: Shehu YarÕAdua Centre, Abuja. p. 1-39.
6. WEC, ÒEnergy Policy Scenario Study to 2050 Ð All Africa DataÓ, Draft report for AfricaÓ, 2010, World Energy Council, WEC
7. FAO, Sustainable Forest Management Programme in African ACP Countries: Experience of Implementing National Forest Programmes in Nigeria. , 2003, Forest Resources and Forestry Development in Nigeria.
8. Onyekwelu, J.C., Mosandl, R., and Stimm, B., Productivity, site evaluation and state of nutrition of Gmelina arborea plantations in Oluwa and Omo forest reserves, Nigeria. Forest Ecology and Management, 2006. 229(1Ð3): p. 214-227.
9. Ola-Adams, B.A., Effects of spacing on biomass distribution and nutrient content of Tectona grandis Linn. f. (teak) and Terminalia superba Engl. & Diels. (afara) in south-western Nigeria. Forest Ecology and Management, 1993. 58(3Ð4): p. 299-319.
10. Onyekwelu, J.C., Growth, biomass yield and biomass functions for plantation-grown Nauclea diderrichii (de wild) in the humid tropical rainforest zone of south-western Nigeria. Bioresource Technology, 2007. 98(14): p. 2679-2687.
11. Fuwape, J.A., Onyekwelu, J.C., and Adekunle, V.A.J., Biomass equations and estimation for Gmelina arborea and Nauclea diderrichii stands in Akure forest reserve. Biomass and Bioenergy, 2001. 21(6): p. 401-405.
12. Oriola, E.O., Forestry for Sustainable Development in NigeriaForestry for Sustainable Development in Nigeria. International Journal of African Studies, 2009: p. 11-16.
13. Adekunle, V.A.J., Alao, A.A., and Adekayode, F.O., Yields and nutrient pools in soils cultivated with Tectona grandis and Gmelina arborea in Nigerian rainforest ecosystem. Journal of the Saudi Society of Agricultural Sciences, 2011. 10(2): p. 127-135.
14. Fuwape, J.A. and Akindele, S.O., Biomass yield and energy value of some fast-growing multipurpose trees in Nigeria. Biomass and Bioenergy, 1997. 12(2): p. 101-106.
15. Onyekwelu, J.C., Above-ground biomass production and biomass equations for even-aged Gmelina arborea (ROXB) plantations in south-western Nigeria. Biomass and Bioenergy, 2004. 26(1): p. 39-46.
even-38
aged Gmelina arborea (ROXB) plantations in south-western Nigeria: Biomass and Bioenergy, 2004, 26, (1), 39Ð46. Fuel and Energy Abstracts, 2004. 45(4): p. 266.
17. Idris, S.S., Rahman, N.A., Ismail, K., Alias, A.B., Rashid, Z.A., and Aris, M.J., Investigation on thermochemical behaviour of low rank Malaysian coal, oil palm biomass and their blends during pyrolysis via thermogravimetric analysis (TGA). Bioresource Technology, 2010. 101(12): p. 4584-4592.
18. Aina, O.M. Wood Waste Utilization for Energy Generation. in Renewable Energy for Developing Countries-2006. 2006. Nigeria.
19. Friedl, A., Padouvas, E., Rotter, H., and Varmuza, K., Prediction of heating values of biomass fuel from elemental composition. Analytica Chimica Acta, 2005. 544(1-2): p.
191-198.
20. Van Soest, P.J., The use of detergents in the analysis of fibrous feeds: II. a rapid method for the determination of fibre and lignin. Journal of the Association of official
Agricultural Chemists, 1963. 46: p. 829-835.
21. Gudka, B., Darvell, L.I., Jones, J.M., Williams, A., Kilgallon, P.J., Simms, N.J., and Laryea-Goldsmith, R., Fuel characteristics of wheat-based Dried Distillers Grains and Solubles (DDGS) for thermal conversion in power plants. Fuel Processing Technology,
2012. 94(1): p. 123-130.
22. Baxter, X.C., Darvell, L.I., Jones, J.M., Barraclough, T., Yates, N.E., and Shield, I., Study of Miscanthus x giganteus ash composition Ð Variation with agronomy and assessment method. Fuel, 2012. 95(0): p. 50-62.
23. Nowakowski, D.J., Woodbridge, C.R., and Jones, J.M., Phosphorus catalysis in the pyrolysis behaviour of biomass. Journal of Analytical and Applied Pyrolysis, 2008.
83(2): p. 197-204.
24. Jenkins, B.M., Baxter, L.L., Miles Jr, T.R., and Miles, T.R., Combustion properties of biomass. Fuel Processing Technology, 1998. 54(1Ð3): p. 17-46.
25. Miles, T.R., Miles Jr, T.R., Baxter, L.L., Bryers, R.W., Jenkins, B.M., and Oden, L.L., Boiler deposits from firing biomass fuels. Biomass and Bioenergy, 1996. 10(2Ð3): p.
125-138.
26. Darvell, L.I., Jones, J.M., Gudka, B., Baxter, X.C., Saddawi, A., Ibrahim, R.H., and A., W., Combustion properties of imported biomass feedstocks for co-firing in the UK, 2010, 18th European biomass congress and exhibition: Lyon, France.
27. Bryers, R.W., Fireside slagging, fouling, and high-temperature corrosion of heat-transfer surface due to impurities in steam-raising fuels. Progress in Energy and Combustion Science, 1996. 22(1): p. 29-120.
28. Vassilev, S.V., Baxter, D., Andersen, L.K., Vassileva, C.G., and Morgan, T.J., An
overview of the organic and inorganic phase composition of biomass. Fuel, 2012. 94(0):
p. 1-33.
29. Werkelin, J., Skrifvars, B.-J., and Hupa, M., Ash-forming elements in four Scandinavian wood species. Part 1: Summer harvest. Biomass and Bioenergy, 2005. 29(6): p. 451-466.
30. Kaltschmitt, M. and Weber, M., Markets for solid biofuels within the EU-15. Biomass and Bioenergy, 2006. 30(11): p. 897-907.
39
32. Kauter, D., Lewandowski, I., and Claupein, W., Quantity and quality of harvestable biomass from Populus short rotation coppice for solid fuel useÑa review of the
physiological basis and management influences. Biomass and Bioenergy, 2003. 24(6): p.
411-427.
33. Fahmi, R., Bridgwater, A.V., Darvell, L.I., Jones, J.M., Yates, N., Thain, S., and Donnison, I.S., The effect of alkali metals on combustion and pyrolysis of Lolium and Festuca grasses, switchgrass and willow. Fuel, 2007. 86(10Ð11): p. 1560-1569.
34. Jones, J.M., Darvell, L.I., Bridgeman, T.G., Pourkashanian, M., and Williams, A., An investigation of the thermal and catalytic behaviour of potassium in biomass combustion. Proceedings of the Combustion Institute, 2007. 31(2): p. 1955-1963.
35. Darvell, L.I., Jones, J.M., Gudka, B., Baxter, X.C., Saddawi, A., Williams, A., and Malmgren, A., Combustion properties of some power station biomass fuels. Fuel, 2010.
89(10): p. 2881-2890.
36. Antal M, J., Varhegyi, G., and Jakab, E., Cellulose pyrolysis kinetics : Revisited. Industrial & engineering chemistry research, 1998. 37(4): p. 1267-1275.
37. Chen, W.-H. and Kuo, P.-C., Isothermal torrefaction kinetics of hemicellulose, cellulose, lignin and xylan using thermogravimetric analysis. Energy, 2011. 36(11): p. 6451-6460.
38. Conesa, J.A., Marcilla, A., Caballero, J.A., and Font, R., Comments on the validity and utility of the different methods for kinetic analysis of thermogravimetric data. Journal of Analytical and Applied Pyrolysis, 2001. 58Ð59(0): p. 617-633.
39. Fisher, T., Hajaligol, M., Waymack, B., and Kellogg, D., Pyrolysis behavior and kinetics of biomass derived materials. Journal of Analytical and Applied Pyrolysis, 2002. 62(2):
p. 331-349.
40. Gil, M.V., Casal, D., Pevida, C., Pis, J.J., and Rubiera, F., Thermal behaviour and kinetics of coal/biomass blends during co-combustion. Bioresource Technology, 2010. 101(14): p. 5601-5608.
41. Saddawi, A., Jones, J.M., Williams, A., and Wójtowicz, M.A., Kinetics of the Thermal Decomposition of Biomass. Energy & Fuels, 2009. 24(2): p. 1274-1282.
42. Saddawi, A., Jones, J.M., Williams, A., and Le Coeur, C., Commodity Fuels from
Biomass through Pretreatment and Torrefaction: Effects of Mineral Content on Torrefied Fuel Characteristics and Quality. Energy & Fuels, 2011.
43. Jones, J.M., Bridgeman, T.G., Darvell, L.I., Gudka, B., Saddawi, A., and Williams, A., Combustion properties of torrefied willow compared with bituminous coals. Fuel Processing Technology, 2012. 101(0): p. 1-9.
44. Miranda, T., Esteban, A., Rojas, S., Montero, I., and Ruiz, A., Combustion Analysis of Different Olive Residues. International Journal of Molecular Sciences, 2008. 9(4): p.
512-525.
45. Gubba, S.R., Ma, L., Pourkashanian, M., and Williams, A., Influence of particle shape and internal thermal gradients of biomass particles on pulverised coal/biomass co-fired flames. Fuel Processing Technology, 2011. 92(11): p. 2185-2195.
46. Yang, Y.B., Sharifi, V.N., Swithenbank, J., Ma, L., Darvell, L.I., Jones, J.M., Pourkashanian, M., and Williams, A., Combustion of a Single Particle of Biomass. Energy & Fuels, 2007. 22(1): p. 306-316.
47. Kanury, A.M., Combustion Characteristics of Biomass Fuels. Combustion Science and Technology, 1994. 97(4-6): p. 469-491.
40
49. Bridgwater A.V, Review of fast pyrolysis of biomass and product upgrading. Biomass and Bioenergy, 2012. 38(0): p. 68-94.
50. AlŽn, R., Kuoppala, E., and Oesch, P., Formation of the main degradation compound groups from wood and its components during pyrolysis. Journal of Analytical and Applied Pyrolysis, 1996. 36(2): p. 137-148.
51. Vamvuka, D., Bio-oil, solid and gaseous biofuels from biomass pyrolysis processesÑAn overview. International Journal of Energy Research, 2011. 35(10): p. 835-862.
52. Azeez, A.M., Meier, D., Odermatt, J.r., and Willner, T., Fast Pyrolysis of African and European Lignocellulosic Biomasses Using Py-GC/MS and Fluidized Bed Reactor. Energy & Fuels, 2010. 24(3): p. 2078-2085.
53. Fahmi, R., Bridgwater, A.V., Donnison, I., Yates, N., and Jones, J.M., The effect of lignin and inorganic species in biomass on pyrolysis oil yields, quality and stability. Fuel, 2008.
87(7): p. 1230-1240.
54. Fahmi, R., Bridgwater, A.V., Thain, S.C., Donnison, I.S., Morris, P.M., and Yates, N., Prediction of Klason lignin and lignin thermal degradation products by PyÐGC/MS in a collection of Lolium and Festuca grasses. Journal of Analytical and Applied Pyrolysis,
2007. 80(1): p. 16-23.
55. Lu, Q., Zhang, Z.-F., Dong, C.-Q., and Zhu, X.-F., Catalytic Upgrading of Biomass Fast Pyrolysis Vapors with Nano Metal Oxides: An Analytical Py-GC/MS Study. Energies,
2010. 3(11): p. 1805-1820.
56. Nowakowski, D.J. and Jones, J.M., Uncatalysed and potassium-catalysed pyrolysis of the cell-wall constituents of biomass and their model compounds. Journal of Analytical and Applied Pyrolysis, 2008. 83(1): p. 12-25.
57. Lu, Q., Xiong, W.-M., Li, W.-Z., Guo, Q.-X., and Zhu, X.-F., Catalytic pyrolysis of
cellulose with sulfated metal oxides: A promising method for obtaining high yield of light furan compounds. Bioresource Technology, 2009. 100(20): p. 4871-4876.
58. Nowakowski, D.J., Jones, J.M., Brydson, R.M.D., and Ross, A.B., Potassium catalysis in the pyrolysis behaviour of short rotation willow coppice. Fuel, 2007. 86(15): p.