1-1-2000
An artificial neural network to predict the effects of
fatigue on the electromyographical signal and
generated torque of knee extensor muscles
Angel Antonio Cordero
Iowa State University
Follow this and additional works at:https://lib.dr.iastate.edu/rtd Part of theEngineering Commons
This Thesis is brought to you for free and open access by the Iowa State University Capstones, Theses and Dissertations at Iowa State University Digital Repository. It has been accepted for inclusion in Retrospective Theses and Dissertations by an authorized administrator of Iowa State University Digital Repository. For more information, please [email protected].
Recommended Citation
Cordero, Angel Antonio, "An artificial neural network to predict the effects of fatigue on the electromyographical signal and generated torque of knee extensor muscles" (2000).Retrospective Theses and Dissertations. 17714.
signal and generated torque of knee extensor muscles
by
Angel Antonio Cordero
A thesis submitted to the graduate faculty
in partial fulfillment of the requirements for the degree of
MASTER OF SCIENCE
Major: Biomedical Engineering
Major Professor: Dr. Patrick Patterson
Iowa State University
Ames, Iowa
2000
Graduate College Iowa State University
This is to certify that the Master's thesis of
Angel Antonio Cordero
has met the thesis requirements of Iowa State University
Signatures have been redacted for privacy
TABLE OF CONTENTS
ABSTRACT ... V
CHAPTER 1. INTRODUCTION ... 1
CHAPTER 2. SKELETAL MUSCLES AND FIBERS ... 5
Sliding Filament Theory ... 5
Muscle Metabolism ... 8
Muscle Fiber Types ... 10
Fatigue ... : ... 12
Muscle Activity ... 12
CHAPTER 3. JOINT BIOMECHANICS ... 16
Levers ... 16
Force-Velocity Relationship ... 20
Muscle Moment/Torque ... 21
Torque/Position Relationship ... 23
Estimation of Muscle Tension ... 25
CHAPTER 4. ELECTROMYOGRAPHY BASICS ... 28
EMG Signal Detection ... 28
EMG Signal Characteristics ... 30
EMG Signal Analysis ... 33
EMG Signal and Force ... 35
CHAPTER 5. METHODS AND PROCEDURES ... 40
Neural Network Theory ... 40
Experimental Procedure ... 4 7 CHAPTER 6. RESULTS ... 50
Changes in the EMG Signal ... 50
Changes in Generated Torque ... 52
Quantification of Fatigue ... 54
Artificial Neural Network Training ... 57
CHAPTER 7. DISCUSSION ... 62
Effects of Simplified Fatigue Assumption ... 63
Possible Applications ... 65
Recommendations for Future Research ... 66
APPENDIX - Qnet SETTINGS ... 68
Network Design···:··· .. ··· .. ··· .. ··· 68
Network Parameters ... 70
Network Training ... 71
REFERENCES ... 73
ACKNOWLEDGMENTS ... 77
ABSTRACT
Human movement is dictated by muscle contractions and the forces muscles produce
around joints. A complete understanding of human movement requires an understanding of
forces generated by contracting muscles and their effects on joints. Essential to muscle
contraction is the transmission of electrical impulses from the cerebral cortex, down the
spinal chord, finally reaching the motor neurons.
A muscle's electromyographical (EMG) signal has been used extensively to provide
insight into the dynamics of muscle behavior. Specifically, EMG signal detection has proven
the most useful in applications that involve the indication of muscle activation, the
determination of muscular fatigue, and the relationship between the EMG signal and muscle
force. However, since there has been no consistent use of EMG signal detection, the use of
EMG signal analysis for the determination of muscle force has not been widely explored.
Also, unwanted frequencies from neighboring muscles, electrical fields, and the equipment
used to detect the EMG signal itself corrupt the signal of interest. This makes it very difficult
to isolate a specific muscle and study its EMG signal-to-force relationship.
The purpose of this study is to correlate a contracting muscle's EMG signal with the
generated torque and an estimate of the muscle's fatigue using an artificial neural network.
An artificial neural network is a form of artificial intelligence software that is able to learn
and detect patterns in order to generalize and classify data. Artificial neural networks have
the advantage that they are designed to .mimic a natural neural network.
Using EMG signals and torque data collected from four human subjects while they
linearly with time. It was assumed that subjects experienced a maximum fatigue equal to the percent drop in the peak torque values generated at the beginning and ending of the
experiment. The data collected from one of the subjects was used to train an artificial neural network. The network training method used a backpropagation training algorithm. Data from the remaining subjects were used to test the neural network.
CHAPTER 1. INTRODUCTION
Human movement is dictated by muscle contractions and the forces muscles produce
around joints. A complete understanding of human movement requires an understanding of forces generated by contracting muscles and their effects on joints. The sliding filament theory has been a widely accepted explanation of the muscle contraction mechanism.
Biomechanics is a broad field that combines the knowledge from "biology, physiology, physics, engineering, and medicine" to understand the forces involved in human movement
(Low and Reed, 1996).
Since the force generated by a muscle cannot be measured directly, it has to be derived by calculating the torque around a joint by performing a biomechanical analysis (Hoff and Van Den Berg, 1977). Using results and approximations obtained from
biomechanical analyses researchers have been able to design computer models that simulate
contracting muscles. Model simulations have proven useful in order to determine forces on
joints during certain movements without having to perform any type of invasive procedures
(Hoy et al., 1990). Biomechanical methods of determining muscle force are limited in that
the results obtained are specific to a particular task and cannot be generalized for a variety of
movements.
The purpose of this study is to determine if an artificial neural network can be used to
predict a contracting muscle's EMG signal, or generated torque based on an estimated fatigue
value. An artificial neural network is a sophisticated software that is able to learn and detect
patterns in order to generalize and classify data. Artificial neural networks have the
advantage that they are designed to mimic a natural neural network. Much the same way an infant's brain is thought to "make connections" between neurons as the child's brain
develops, an artificial neural network has the ability to reinforce connections between its
artificial neurons as it learns to recognize patterns.
One of the potential applications of this study is in the area of functional electrical
stimulation (FES), in which muscle tissue is made to contract via the application of an
external current. The potential uses of FES are most promising in the field of rehabilitation,
promising results for victims of spinal cord injuries (SCI). FES has recently been used to enhance the respiration of SCI patients by stimulating to the abdominal muscles involved in
respiration (Stanic et al., 2000). Other recent research has been able to restore some of the function of paralyzed limbs in cats (Strange and Hoffer, 1999). Still others have been able to restore limited use of hand and arm movement to SGI victims using the EEG signal from the
cerebral cortex (Lauer et al., 1999; Johnson et al., 1999, Chase, 2000).
Similarly to FES, a myoelectric prosthesis uses detected EMG signal from nearby muscles to control the movement of prosthetic limbs. However, as muscles begin to fatigue changes in the EMG signal make the control of such prostheses more difficult. Therefore,
the role that fatigue plays in a contracting muscle will also be considered in this study.
Essential to muscle contraction is the transmission of electrical impulses from the
cerebral cortex, down the spinal chord, finally reaching the motor neurons. The fact that muscles contract in response to electrical impulses has also been widely published (Jones and
Barker, 1996; Marieb, 1995; Gowitzke and Milner, 1988; Hamill and Knutzen, 1995).
Researchers have been able to detect these electrical impulses since 1849 when Du
Bois-Reymond detected the first electromyographical (EMG) signal (Basmajian and De Luca,
1985).
EMG has been used extensively to provide insight into the dynamics of muscle
behavior. Specifically, EMG signal detection has proven the most useful in applications that involve the indication of muscle activation, the determination of muscular fatigue, and the relationship between the EMG signal and muscle force (De Luca, 1997). Some researchers have even used EMG signal in the detection and diagnosis of muscle disease (Pattichis et aL,
1995). Perhaps one of the most intriguing aspects ofEMG signal is that with proper detection and processing techniques it is possible to relate a signal's amplitude to the
generated muscle force. Thus providing a non-invasive method for determining individual
muscle force. However, since there has been no consistent use ofEMG signal detection, the use of EMG signal analysis for the determination of muscle force has not been widely
explored (Basmajian and De Luca, 1985; De Luca, 1997).
Another factor that complicates the use of EMG to predict muscle force is the fact
electrical fields, and the equipment used to detect the EMG signal itself corrupt the signal of
interest. This makes it very difficult to isolate a specific muscle and study its EMG
signal-to-force relationship. Some researchers (Hoff and Van Den Berg, 1981 a-f) have attempted to relate the two by constructing a model of a muscle.
In this study four human subjects will be asked to perform maximal-effort
contractions using an isokinetic dynamometer by extending and flexing the knee joint for a
two-minute period. This will generate moments (torque) about the knee joint due to the
contractions of the "thigh" muscle group (quadriceps). As the subjects are generating
moments about the knee, the EMG signal will be recorded using surface electrodes placed
over the knee extensor muscles (vastus medialis).
By observing how the generated peak torque decreased with time for each subject, it
is evident that a linear relation can be used to predict how torque changes with respect to
time. Even though a better fit between torque and time was possible with a third-order
polynomial fit, a linear relation was used because of limitations in handling the large
amounts of data. Therefore, it was assumed that subjects experienced a maximum fatigue
equal to the percent drop in the peak torque values generated at the beginning and ending of
the experiment. Using the data collected from one of the subjects, an artificial neural
network was trained using a backpropagation training algorithm. Data from the remaining
were used to test the neural network.
An artificial neural network is being used in this research to emulate its real-life
counterpart in order to understand the relationships between the EMG signal and muscle
force. Artificial neural networks have been used in conjunction with EMG and
electroencephalogram (EEG) signals to understand many physiological phenomena. Some
researchers have attempted to relate muscle force and fiber size to the EMG signal (Akazawa
and Kato, 1990). Others have trained artificial neural networks to break down patterns in the
EMG spectra (Joutsiniemi et al., 1995).
One of the potential applications of this study is in the area of functional electrical
stimulation (FES), in which muscle tissue is made to contract via the application of an
external current. The potential uses of FES are most promising in the field of rehabilitation,
promising results for victims of spinal cord injuries (SCI). FES has recently been used to
enhance the respiration of SCI patients by stimulating to the abdominal muscles involved in
respiration (Stanic et al., 2000). Other recent research has been able to restore some of the
function of paralyzed limbs in cats (Strange and Hoffer, 1999). Still others have been able to
restore limited use of hand and arm movement to SGI victims using the EEG signal from the
cerebral cortex (Lauer et al., 1999; Johnson et al., 1999, Chase, 2000).
Similar to FES, a myoelectric prosthesis uses detected EMG signal from nearby
muscles to control the movement of prosthetic limbs. However, as muscles begin to fatigue changes in the EMG signal make the control of such prostheses more difficult. Therefore,
the role that fatigue plays in a contracting muscle will also be considered in this study.
Since this study covers a wide variety of fields, some basic information on the
anatomy of muscles and muscle fibers along with the mechanisms for contractions are given
in Chapter 2. Chapter 3 deals with the broad subject ofbiomechanics. In Chapter 4 basic
information about the science of electromyography is presented. Chapter 5 presents some basic neural network theory along with experimental protocol carried out in the study.
CHAPTER 2. SKELETAL MUSCLES AND FIBERS
Motion of the extremities is caused when muscles contract. The way muscles contract is still somewhat of a mystery, however, the Sliding Filament Theory first proposed by Hugh Huxley in 1954 is the most widely used and accepted explanation of muscle
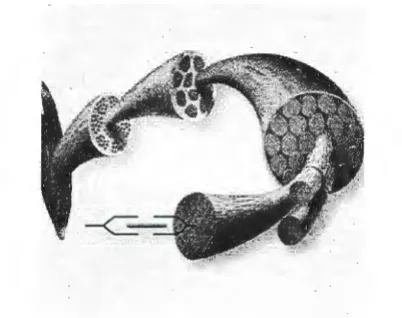
[image:12.565.177.378.243.402.2]contraction. A muscle can be thought of as an organ with various subdivisions. Figure 2.1 shows a computer rendered image of how a muscle organ is organized.
Figure 2.1. Organization of a muscle organ. The Dynamic Human, Version 2. 0, CD ROM, 1998.
Sliding Filament Theory
A skeletal muscle is made of several groups of fascicle. Each fascicle is a wrapping of many individual muscle fibers. The fibers themselves are individual cells, however each cell (fiber) is relatively large by cell standards. A typical muscle cell (fiber), shown in Figure 2.2, can be 10-1 00µm in diameter and (up to ten times the diameter of an average body cell). Their lengths can extend to several centimeters. A closer look at each fiber reveals that these are themselves composed of a hundreds to thousands of myofibrils.
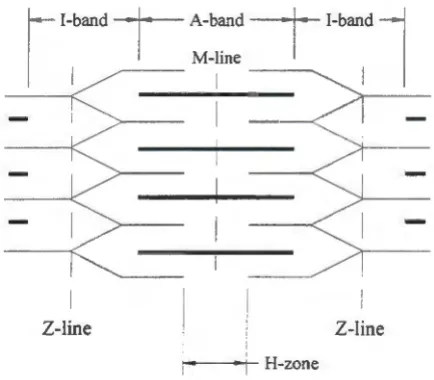
muscle fiber. A repeating pattern of alternating dark and light bands is evident along the
length of each myofibril. These bands are made up of both thick and thin filaments.
The dark regions of the myofibrils are known as the A-bands, while the light regions
as the I-bands. Areas where both the thick and thin filaments overlap are the dark bands,
A-bands; while only thin filaments are present in the I-bands.
Light
I-Bands
r
I-band+-
A-b~d-+--
I-band7
1I
M-lmeI
1
~ - -
1
- - ~
1
Z-line
LJ
Z-line [image:13.565.167.384.442.632.2]1 H-zone
I-bands have a midline called the Z-line. The distance between Z-lines is referred to
as the sarcomeres. Z-lines are the junction between sarcomeres. Also there is an area at the
midline of the A-bands that is noticeably clearer than the rest of the A-band called the
H-zone. There are no thin elements in the H-zone of a relaxed muscle fiber, therefore only a
thick elements is seen in the H-zone.
Once stimulated by an electrical impulse from the central nervous system, sarcomeres
are exposed to calcium, Ca+2, ion. This ion causes the thick filament to bind to the areas of
the thin filament and pull the thin filaments in towards the H-zone. To reset the thick
filament an adenosine triphosphate (ATP) molecule is required. However, as long as there
exists an electrical stimulus, calcium ion will continue to be present in the sarcomeres, and
the thick element will continue to bind and pull inward on the thin element, requiring even
more ATP.
The net effects of this contraction are: a shortening of the sarcomere unit, Z-lines
come closer together, and the disappearance of the H-zone as thin and thick filaments slide
past each other. This action keeps repeating itself as long as either the electrical signal
continues to cause calcium to be present in the sarcomeres, or as long as ATP is present to
continue to reset the thick filaments. Once the electrical stimulation ceases, the myofibril
returns to its relaxed position.
The electrical stimulation from the nervous system is what initiates the entire
contraction process. These electrical signals, or nerve impulses, travel along motor neurons
from the central nervous system. Extensions from these motor neurons, called axons, reach
each muscle fiber by penetrating the muscle. It is at the neuromuscular junction where the
release of a neurotransmitter (acetylcholine) is detected by local receptors. Once
acetylcholine is detected, Ca+2 is allowed to enter the muscle fiber from the surrounding
extracellular fluid.
Axons from the motor neuron reach each muscle fiber. A motor unit is a motor
neuron and all the muscle fibers it supplies. Therefore, muscle fibers are able to be
stimulated individually depending on the strength of the electrical stimulation. When a
motor neuron transmits an electrical signal (fires) all the muscle fibers supplied by that
small number of motor units. On the other hand, large muscles with less precise movements
have a large number of motor neurons.
The stronger a nerve impulse (voltage of the electrical signal through the motor
neuron), the greater the number of muscle cells that are activated. This phenomenon is called
recruitment. A greater muscle force, would require the recruitment of a greater number of
muscle fibers, which would require a stronger nerve impulse. Recruitment can be easily
simulated in vitro in a laboratory setting by stimulating a muscle with shocks of increasing
voltage.
Muscle Metabolism
As mentioned above, adenosine triphosphate (ATP) is needed by muscle fibers to
continue contraction. ATP provides the energy necessary for myofibrils to reset to the higher
energy state and continue contraction if necessary. Initially, ATP is found locally in the
muscles fibers themselves, however, a very small amount is stored here. Since the amount of
ATP stored in the muscle is small it is exhausted in roughly 5 seconds after the contraction
begins. In most cases, this is barely enough ATP to initiate contractions. Therefore, the
body must find ways to continuously supply this energy source to contracting muscles.
The three mechanisms the body has to produce ATP are: 1) the chemical reaction
between creatine phosphate and adenosine diphosphate, 2) aerobic respiration, and 3)
anaerobic glycolysis.
Once vigorous muscular activity begins ATP stores in the muscle fibers are quickly
depleted. At this point the muscle relies on creatine phosphate (CP) molecule that is stored
in the muscle fiber to produce ATP. CP is stored in the muscle fibers in substantial
quantities. It reacts with adenosine diphosphate (ADP), a by product of ATP consumption,
to form creatine and ATP:
Creatine phosphate+ ADP• creatine + ATP (2.1)
This reaction takes place very rapidly. The result is that the initial levels of ATP in
the muscle fibers are virtually unchanged during the initial period of contraction. Even
has a short duration. CP reserves are normally exhausted within 15-20 seconds and they are
replenished during periods of inactivity when ATP reserves are also being replenished. It is
believed that this pathway provides energy to activities that last a few seconds and require a
large amount of power, such as weight lifting or sprinting.
A more significant amount of ATP is generated during aerobic respiration. This
mechanism requires oxygen. Oxygen and free fatty acids combine in the cell mitochondria
to produce ATP. However, as the intensity of the exercise increases, glucose (sugar) from
the bloodstream is used to produce ATP. A chemical process known as oxidative
phosphorylation breaks down the bonds of glucose and produces water, carbon dioxide, and
large amounts of ATP:
Glucose + oxygen • carbon dioxide + water+ ATP (2.2)
The carbon dioxide diffuses into the bloodstream and is carried into the lungs where it
is removed from the body. Because this process takes place in the cell's mitochondria and
requires a large amount of chemical reactions, it is a relatively slow process. This aerobic
pathway is what fuels prolonged sustained activities, such as jogging and marathon running
where endurance is the goal.
Anaerobic glycolysis, on the other hand, does not require oxygen. It involves
breaking down glucose to pyruvic acid by using glycogen (found initially in the muscle).
Some of the energy that is released from this reaction is used to form ATP. Normally, the
pyruvic acid formed is used by the aerobic mechanism to produced still more ATP and this is
sometimes considered part of the aerobic pathway. However, ifrigorous contractions
continue, the oxygen supplied by the aerobic mechanism is not enough. Under such
conditions of oxygen shortage the accumulated pyruvic acid is converted to lactic acid and
this becomes the end product (rather than water and carbon dioxide).
Eventually, after a rest period of approximately 30-40 minutes, the lactic acid in the
muscle fibers is absorbed into the bloodstream and converted back to pyruvic acid by the
liver cells. This anaerobic process is an adequate source of ATP in the absence of oxygen.
However, the accumulation of lactic acid contributes to muscle fatigue and is associated with
the muscle soreness felt after rigorous exercise. Moderately sustained activities, such as
Muscle fibers will always initially use stored resources of ATP and CP. Once these
reserves have been exhausted, the anaerobic mechanism appears to initially take over
temporarily while the aerobic mechanism gets started. Once aerobic respiration reaches an
efficient level of ATP production it takes over for the remainder of the activity, unless the
activity is so strenuous that it cannot supply enough oxygen to meet the demand.
Aerobic endurance is the length of time a muscle can continue using the aerobic
pathway. The anaerobic threshold is the point at which a muscle begins to use anaerobic
glycolysis. Well-trained athletes can maintain ATP demands below the anaerobic threshold
for long periods of time. This is desirable in athletics since muscles operating at peak levels
using the anaerobic mechanism will fatigue after 1-2 minutes.
Muscle Fiber Types
Even though skeletal muscle fibers contract using the mechanism (sliding filament
theory), use ATP as fuel, and use one of the three metabolic pathways discussed above to
synthesize ATP, not all muscle fibers are alike. There exist different and distinct muscle
fiber types. Based on their size and endurance, fibers are classified as either: slow-twitch
fibers, fast-twitch fibers, or intermediate fast-twitch fibers.
Slow-twitch fibers are thin cells. They contract slowly and have a dark red color.
Their dark red color is due to their plentiful blood supply, which makes oxygen more
available to them. Because of their abundant supply of blood and oxygen, these cells
synthesize ATP through the aerobic mechanism. Therefore, these cells are efficient users of
fat. Because they meet almost all of their energy demands through the aerobic pathway,
these cells have a high resistance to fatigue and can contract for longer periods of time.
However, since red fibers are thin, they cannot generate much power.
Fast-twitch fibers are larger (a diameter about twice as large of that ofred fibers),
contract rapidly, and are pale in color. The pale color of these cells is due to the lack of
blood and oxygen supply, which is evident by the lack of capillaries. This means that these
cells depend on the anaerobic glycolysis pathway to generate ATP. However, since this
result these muscle cells have a low endurance. On the other hand, because of their larger
diameter, white cells have a large number of contractile elements and can, therefore, contract
powerfully.
Intermediate fast-twitch cells have a diameter that is between that of the previous two
cells. Like the fast-twitch cells they contract rapidly, but are more like slow-twitch cells in
that they are highly dependent on oxygen. They are fatigue resistant (though not as fatigue
resistant as slow-twitch cells), and can contract with greater force than red cells (though not
as forcibly as fast-twitch cells).
Although most muscles contain a mixture of the three fiber types, some muscles have
a predominance of one of the three fiber types. People also have mixture of the three muscle
fiber types, even though some also appear to have predominance of one. For example,
sprinters tend to be more muscular, or bigger, than do long-distance runners. The sprinter is
required to develop great speed and power over a short period of time. Therefore, sprinters
train their muscles to more effectively use the white fast-twitch muscle fibers. The long
distance runner is more concerned about endurance. Therefore, marathon runners train their
muscles to more effectively utilize the red slow-twitch fibers.
Even though the muscle fiber type proportions people have are determined
genetically. One can cause changes in all muscle types through exercise and training. By
jogging, biking, or swimming consistently, one can cause the capillaries surrounding muscle
fibers and mitochondria to increase in number. Even though these changes affect all fiber
types, they affect the red slow-twitch fibers the most. The same can be said for resistance
training, where muscle force, not endurance, is important. Lifting heavy weights consistently
will cause all muscle fiber types to increase in size, but the more dramatic size increases will
be observed in the white fast-twitch fibers (Marieb, 1995; Hamill and Knutzen, 1995).
Of course, one's athletic capabilities are, to a large extent, determined by which type
of fibers is most predominant. However, through training and exercise, one can develop
specific training goals and a specific set of muscle fibers better suited for those desired
Fatigue
Everyone is likely to have experienced some degree of fatigue during exercise, or
athletic activity. Some might have even voluntarily stopped an activity because such a high
level of fatigue, or exhaustion, has been reached. In fact, it is one's ability to continue an
activity in spite of such exhaustion that often times sets the best athletes apart. However,
muscle fatigue is different from this form of psychological fatigue. Muscle fatigue sets in
when the mechanisms described above fail to satisfy the ATP demand to continue a
contraction. Muscle fatigue is characterized by an inability to continue muscle contractions.
Any vigorous exercise causes significant changes in muscle cell chemistry. At a
minimum local stores of ATP and CP have been depleted. If the anaerobic glycolysis system
was used for an extended period of time, there will be some lactic acid accumulated. This
lactic acid is removed through the bloodstream and converted to pyruvic acid and eventually
back to ATP and CP. Also the presence of lactic acid in the blood stream lowers blood pH.
This causes the respiratory centers in the brain to increase respiration rate.
The increase in respiration rate is the body's attempt to provide the necessary oxygen
in order to return the muscular cell chemistry back to its original status. This phenomenon is
referred to as "repaying" the oxygen dept. Oxygen debt is defined as the additional amount
of oxygen required by the body to restore the muscle cells' original chemistry.
Finally, even though humans are arguably "well-built machines," we are not
perpetual motion machines. Roughly about 20% of the energy generated is actually used to
produce work in contracting muscles. The rest is lost in the form of heat, which causes body
temperature to increase. As a consequence of exercise and increased body temperature,
sweat is generated in an effort to cool the skin surface.
Muscle Activity
At a gross level a muscle contraction is not observed until a threshold electrical
stimulus, known simply as threshold stimulus, is reached. Beyond this point muscles will
have been recruited. This point is known as the maximal stimulus. Increasing the electrical
stimulus beyond the maximal stimulus will not increase the strength of the contraction.
The muscle response to a single threshold stimulus is called a muscle twitch. During
a twitch the muscle quickly contracts and then relaxes. The strength of a twitch is dependent
on the number of motor units activated, which is itself dependent on the strength of the
electrical impulse. A myogram of a twitch, shown in Figure 2.4, reveals three phases: 1) a
latent, or refractory, period of a few milliseconds following the electrical stimulation; 2) a
period of contraction; and 3) a period ofrelaxation which lasts anywhere between ten 10-100
ms.
LJ
20 40 60 Time(ms) 80 100 - ~ 140Latent Period of
period ~c~o_ntr_a_c_ti_on--i-~
[image:20.566.129.418.287.498.2]-~ Period of relaxation 1
Figure 2.4. Phases of the muscle twitch (Marieb, 1995).
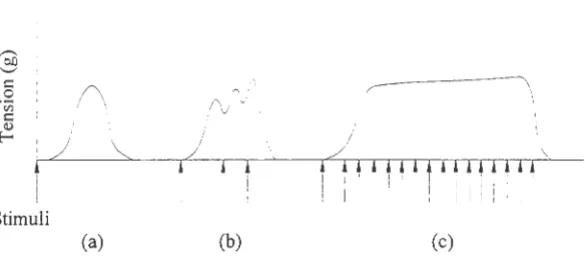
Figure 2.5 demonstrates what happens when successive impulses are received by the
muscle fiber before the initial twitch, Figure 2.5(a), is over. If the muscle receives a second
stimulus before the period of relaxation is complete, a second twitch will be stronger than the
first one as shown in Figure 2.5(b ). This is because the motor units activated by the first
impulse have not relaxed and a second impulse would recruit more motor units. However, if
a second stimulus is received before the refractory period of the first stimuli is over, the
the relaxation period between contractions will become shorter until eventually it disappears and the muscle is continuously contracted. This state is known as tetanus and it corresponds to having all motor units in the muscle activated. Complete tetanus is shown in Figure 2.5(c).
Stimuli
[image:21.565.121.414.198.334.2](a) (b) (c)
Figure 2.5. (a) Twitch. (b) Wave summation. (c) Tetanus (Marieb, 1995).
Even though a muscle contraction is a tendency by the muscle to pull its ends toward the center (belly) of the muscle, not all muscle contractions cause a shortening of the muscle. Muscles can contract in one of three ways:
1) Concentrically. The muscle shortens as it contracts. This type of contraction generally causes an acceleration of a body part, or an external load, in the
direction of the contraction. During a concentric contraction the muscle does positive work. Lifting a book is a common example of a concentric contraction by the biceps.
2) Isometrically. This is a static contraction in which the muscle neither shortens; nor lengthens. During an isometric contraction, muscle tension (force) may continue to increase, but no change in the muscle length is seen. Holding a load while carrying it is an example of an isometric contraction.
Human movement requires muscle to contract in each of the contraction types listed
above. However, successful human movement must have a balanced coordination among
muscles. For example, think of the smooth motion required to lift and drink from a full cup
of hot coffee. As the bicep of the upper arm contracts concentrically to lift the cup of coffee,
the triceps are contracting eccentrically to slow the motion. As one is drinking from the cup
the arm is held in place and both the biceps and triceps are contracting isometrically.
Once the drink is taken, the cup is lowered back to the table and the roles of the
biceps and triceps are reversed. The triceps are now contracting concentrically extending the
lower arm to lower the cup, while the biceps are contracting eccentrically providing control
to the motion. This kind of muscle coordination is required of all physical activities.
This type of coordination between muscles illustrates the different types of roles
assumed by muscles to produce and control movement. A muscle that causes movement is
often times referred to as the agonist, or prime mover. In the example above the biceps
brachia assumed were the agonist during the lifting of the cup of coffee. Muscles that oppose
the movement, such as the triceps during the lifting, are called the antagonist. When the
agonists are active, the antagonists are often stretched. In addition to agonist and antagonist
muscles, other muscles are needed to reduce unwanted movement, such as rotation
(synergists), or to immobilize a joint (fixators).
The force a muscle exerts on an external object, such as a load, is often times referred
to as muscle tension. Note that since muscle tension and force have the same mathematical
CHAPTER 3. JOINT BIOMECHANICS
The contractions discussed in the previous chapter at the cellular level have a net
effect of causing contraction in the muscle. Contractions of skeletal muscle are most often
characterized by a generation of a force, or tension, that tends to pull its ends towards its
center. Like all forces, muscle tension can be measured. However, its measurement on
living tissue, such as a human subject, is not a practical task. The measurement of generated
muscle tension requires a laboratory environment and must be done in vitro. Therefore,
researchers often focus on measuring the net effects of muscle tension on the skeletal system
and the external environment upon which they act.
Muscles act in coordination to produce tension upon contraction. This tension is used
either to generate, or to control movement. However, muscle contraction by itself is not
sufficient to cause movement. As mentioned above, a muscle contraction has to occur in
coordination with those of otper muscles in order to produce movement. More importantly,
in many cases, these contractions have to transfer their tensions to the adjacent bones of the
skeletal system.
Bones of the skeletal system rotate around joints in response to skeletal muscle
contractions. This rotation is caused by the moment (tendency to rotate) the muscle tension
generates at the point where the muscle's tendon is attached to the bone, insertion point. It is
precisely this moment, or tendency to cause rotation, that researchers can easily measure in
human subjects. From the knowledge of the generated moment, researchers can estimate
muscle tension. Since bones rotate in much the same way mechanical levers do, it is
necessary to understand some basics of levers and their mechanics.
Levers
Most of the movement that is generated by skeletal muscles involves the use of
leverage. A lever is a rigid body that moves on (rotates about) a fixed point, or fulcrum.
Levers usually involve an externally applied force, known as load, and a resistance to the
often times an external force applied at an extremity, while the effort is the muscle's
generated tension. Joints in the body, such as an elbow or a knee, are fulcrums. An
important parameter of levers is the moment arm.
The moment arm of a lever is defined as the perpendicular distance between the point
of application of the force ( either load or effort) and the fulcrum, or joint. Moment arm is an
important parameter since the greater the moment arm, the greater the effect of the force will
be. In other words moment arm can be thought of as a "magnification factor" of forces. A
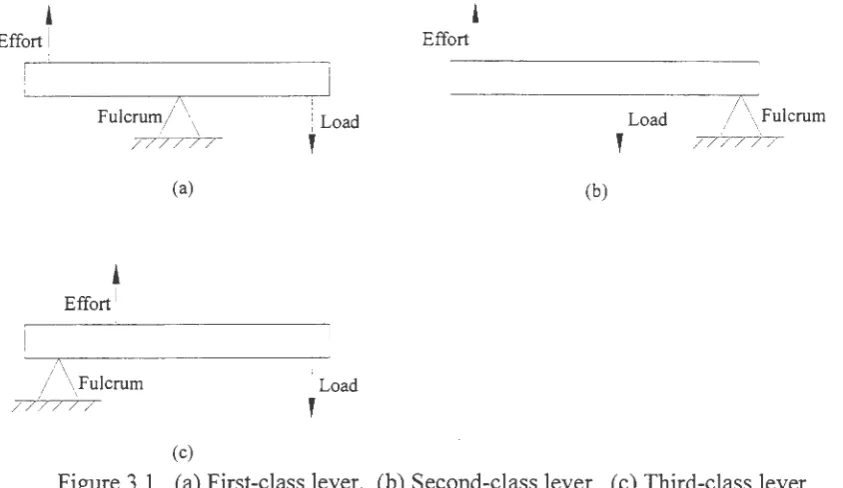
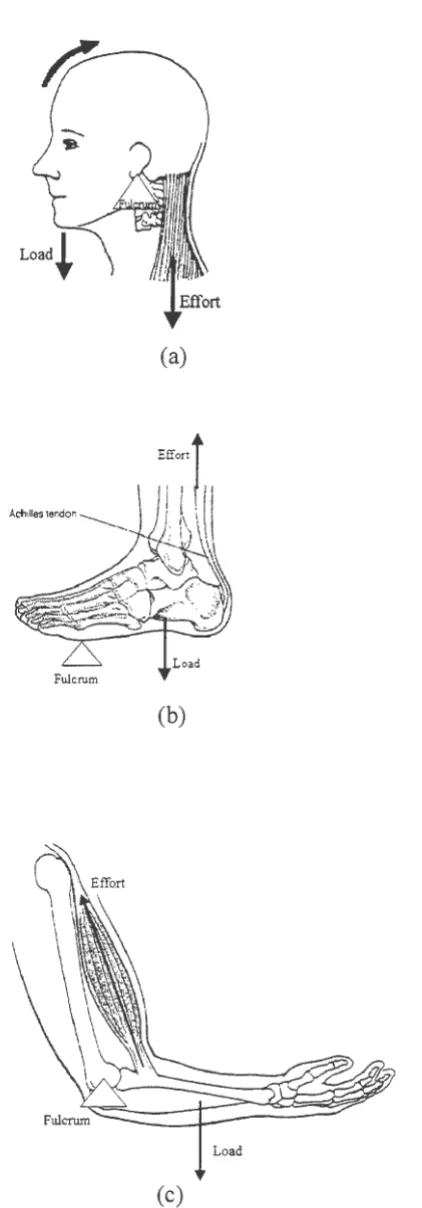
lever can be classified into one of three classes: first-, second-, and third-class levers. Figure
3 .1 shows examples of each of these lever classes.
Effort
t
I
Fulcrum
/\
/ / / / / /
(a)
Effort!
/\
Fulcrum
/ / / / / /
(c)
I Load
'
I Load
'
'
Effort Ir--'- - - --
-~---.
l
-10-a d- -
7-,c--'\
Fulcrum' /77777
[image:24.564.54.476.274.518.2](b)
Figure 3 .1. ( a) First-class lever. (b) Second-class lever. ( c) Third-class lever.
A first-class lever is one in which the fulcrum is always located in between the load
and the effort. First-class levers can operate at either a mechanical advantage or a
mechanical disadvantage. A lever is said to operate at a mechanical advantage if the moment
arm of the effort force (the distance between the effort and the fulcrum) is greater than that of
the load. First-class levers tend to cause motion in the direction opposite of the applied force.
For example, an upward applied effort force will cause the load force (located at the opposite
In a second-class lever the load is located in between the fulcrum and the effort. This
type of lever always operates at a mechanical advantage, since the effort force is always
further away from the fulcrum than the load. The effort force, therefore, can be significantly
less than the load and still effectively oppose the effects of the load. However, these types of
levers loose efficiency when it comes to linear motion. Significant linear movement at effort
end of the lever will yield less linear movement at the point where the load is applied. Also,
since both the effort and load forces are located on the same side of the fulcrum, the motion
generated at both the effort and the load locations will be in the same directions.
As opposed to a second-class lever, the third-class lever will always operate at a
mechanical disadvantage. This is because the effort is always located between the load and
the fulcrum, thus having a shorter moment arm than the effort. Unfortunately, mechanically
speaking, a vast majority of the levers in our body are of the third class variety. As an
example, the insertion point of the biceps brachii is located approximately 2 centimeters from
the fulcrum of the lower arm (elbow joint). A majority of the external loads experienced by
the lower arm are applied at the hands. Therefore, in order to effectively counter the effects
(moments) of the external loads the biceps brachii must generate a tension significantly
larger than that of the external load.
However, the loss in mechanical advantage that third-class levers have is offset by
their efficiency in generating linear motion. Continuing with the biceps brachii example,
these do not have to move their end of the lower arm as much to generate a specified amount
of linear motion at the end of the hand. A third-class lever will also have both the point of
the effort force and load force moving in the same direction since these two forces are also
located on the same side of the fulcrum.
Examples of how these types of levers are found in the body are shown in Figure 3.2.
A majority oflevers found in the body are of the third-class variety, where a speed is gained
at the expense of a mechanical advantage. Second-class levers are the least common in the
(a)
Fulcrum
(b)
Load
[image:26.565.189.400.62.666.2](c)
Force-Velocity Relationship
In the previous section the relationship between force and velocity was alluded to
indirectly when discussing how each of the lever types caused motion at the points of
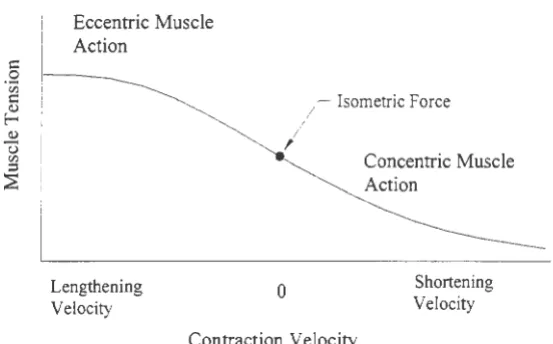
application of the effort and load forces. As it turns out the tension a muscle can generate is
dependent on the velocity it is required to contract and the contraction type. This relationship
is shown graphically in Figure 3.3, below.
Eccentric Muscle Action
I
I
;
I
Isometric ForceLengthening
Velocity 0
Contraction Velocity
Concentric Muscle Action
[image:27.565.127.404.281.453.2]Shortening Velocity
Figure 3.3. Relationship between muscle force, velocity and type of contraction (Hamill and
Knutzen, 1995).
As one would expect, the amount of force a muscle can generate during a concentric
contraction is greater if the muscle were allowed to contract slowly. The greater the tension
a muscle is required to generate during a concentric, the slower it will need to contract.
Anyone who has ever had to lift a heavy object off the floor most likely already intuitively
knows this fact. For eccentric contractions, the opposite is true. Our fastest muscle
contractions can be generated eccentrically.
As muscles are eccentrically stretched by an externally applied load, ligaments,
connective tissue, and other non-contractile elements of the muscle resist the external motion
the tension muscles are able to generate is much greater during an eccentric contraction than
for any other contraction.
Anyone that has had to lower a very heavy object will also know that it will be
lowered rapidly. Yet the muscle tension generated during this rapid eccentric contraction
was probably very close to the maximum tension that can be generated by the muscle.
Therefore, any object that can be lifted can also be lowered very safely.
The dependency of force on velocity will play an important role in this study. In
order to control the results, subjects will perform flexion and extensions of the knee at a
constant angular velocity. The velocity selected will be one of the determining factors in the
amount of tension that can be generated by the muscles involved. Since muscle tension, or
force, cannot be measured directly, torque, or moment, will be measured instead. This will
give us an idea of how much force the muscles are generating.
Muscle Moment/Torque
As mentioned above, the measurement of muscle tension is a difficult task.
Therefore, in order to gain a better understanding of the forces generated by the muscles
involved in a certain contraction, researchers often times focus their efforts in measuring the
moment generated by these muscles. Having quantified the moment generated by the
muscles during a contraction, researchers can estimate the amount of force generated by the
contractions. Since moments are essential in biomechanical analysis, a review of these is in
order.
Moments, or torques, can be thought of as a tendency towards rotation by a rigid
body about some point. The stronger a moment is, the stronger will be the tendency by that
rigid body to rotate. The forces that cause moments are applied at a distance from the point
of rotation. Also, a moment is a vector, therefore it has a magnitude and a direction.
The magnitude of a moment is obtained by multiplying the magnitude of the force
causing it by that force's perpendicular distance to the point ofrotation. In a system of
forces, when more than one force is being applied to a rigid body, the moment is simply the
rotation ( clockwise or counter-clockwise). Moments causing rotation in opposite directions
oppose each other and are therefore subtracted from one another.
In biomechanics the rigid bodies studied are often times the bones. The points of
rotation are joints, such as a knee or an elbow. Therefore, these are often the points about
which moments are calculated. Forces that cause moments in our bodies are either tensions
generated by our muscles and/or any external forces due to any externally applied load.
It is also worth noting that in many circumstances, especially in a dynamic analysis,
the moment generated about a joint is not only dependent on the positions of the forces but
also on the orientation of the rigid body. As the rigid body, such as an arm or a leg, moves
through its range of motion, the moments generated at each joint will change. This is true
even though the external forces stay constant.
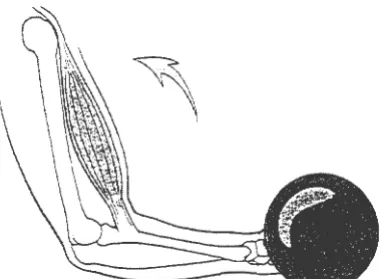
For example, consider someone lifting a ten-pound barbell as shown below in Figure
3.4. As the lower arm moves through its range of motion, the moment at the elbow generated
by the ten-pound weight and the weight of the arm itself will change. The moment at the
elbow changes with respect to the orientation of the lower arm. This orientation can be
measured and expressed as an angle, 0, with respect to an arbitrary reference position. As the
moment at the elbow is constantly changing through the lower arm's range of motion, so is
the force generated by the biceps brachii. These changes in muscle force make it difficult to
[image:29.566.173.364.497.637.2]measure muscle force directly.
Figure 3.4. Illustration of muscle torque as lower arm moves through its range of motion
Fortunately, in a dynamic analysis muscle forces are the only changing forces.
Therefore, it is not too difficult to perform a dynamic analysis and obtain a
position-dependent expression for muscle force. Position-position-dependent expressions are currently used to
simulate muscle behavior and estimate generated forces. However, the forces obtained
through dynamic analyses are limited in that parameters, such as joint center of rotation,
body weight and its center of mass, can only be approximated.
Torque/Position Relationship
As was shown by the above example, the moment generated by a muscle is dependent
on the orientation of the body part. Since moment generated at the joint is dependent on the
muscle position and on muscle force, the muscle force is also dependent on position.
At a cellular level, the dependency of muscle tension on position can be studied by
analyzing the amount of pre-~xisting stretch in the muscle fibers when contraction begins.
Recall that muscle fibers contract by sliding thin and thick filaments past each other. For
fibers there exist an optimal length at which the tension generated during contraction will be
maximum. The dependency of muscle tension on initial length is shown in Figure 3.5.
"O B
[image:30.568.114.395.464.641.2]~
...
V c:: V c., c:: 0 ·;;; c:: V f-u ·.: C ..., A V E 0 ..:'.; Lo Initial Fiber LengthFigure 3.5. Relationship between isometric muscle tension and initial fiber length (Hamill
The optimal sarcomere length, L0, occurs when the muscle is slightly stretched. This enables the thin and thick filaments to slide past almost their entire lengths. This condition is
shown in point B of Figure 3.5. However, if the sarcomeres are too stretched (as in point C
of Figure 3.5), such that there is no initial overlap between filaments, contraction will not
occur.
Similarly, the more contracted the sarcomeres are prior to contraction (as is the case
in point A of Figure 3 .5), the less filament length is available for filaments to slide past each
other. This will cause the muscle force generated to be less than what it would be if it were
slightly stretched. If the sarcomeres are too contracted, very little contraction will take place
and very little force will be generated in this case.
Just as muscle tension can be maximized by initial fiber length, the torque generated
at the joint can also be maximized by initial joint position. For example, consider the elbow
joint of Figure 3.4 once again. When a joint, such as the elbow, is fully extended the muscles
around the joint will be less capable of generating a torque than if the joint were slightly
flexed. This is because a majority of the tension generated by the biceps brachii is
transmitted along the axis of the bones of the lower arm and serves to compress the elbow
joint when it is fully extended.
A similar event happens when the elbow is flexed. The moment generated by the
triceps brachii is minimized in this case also. Just like in the case when the elbow is
extended, a majority of the tension generated by the triceps brachii is exerted through the axis
of the lower arm and compresses the elbow joint. This component of the tension will not
cause any rotation, and therefore no moment will be generated.
For the elbow joint, as well as for all other joints, there is a point between full
extension and full flexion where the moment at that joint generated by the muscles is
maximized. This orientation will vary from joint to joint and from individual to individual.
For the elbow joint the angle at which the moment is maximized is roughly 90° - 95°
(Marieb, 1995; Low, 1996).
The dependency between torque and angular orientation can be used to generate a
graph in which generated torque is plotted against angular position. For each angle of the
angular position is rarely linear. However, a graph such as this one can be a very useful tool
in determining the maximum torque at joints.
In this study a graph of generated torque versus position, generated via computer, will
be used only to confirm that the subjects' knee extends and flexes through the range of
motion. The velocity of contraction will be controlled using an isokinetic dynomometer.
Estimation of Muscle Tension
In order to fully understand human movement it is very important to be able to
quantify muscle force. A specific quantitative knowledge of muscle tension would give
insight into each muscle's contribution to movement. However, direct muscle tension
measurements cannot be done without invasive procedures. Therefore, most methods of
estimating muscle tension involve the calculation of torque, or moment, generated by the
muscle group at a joint.
One method of measuring muscle tension involves lifting known weights (Low,
1996). In order to ensure reproducibility, care must be taken in the placement of the weights
and ensure that these are placed in the same location each time. The use of machines that use
levers and pulleys make it easier for researchers to ensure experimental reproducibility.
Additional frictional forces between the moving parts of the machine are introduced and
must be accounted for. Also this method is limited to a specific movement and large muscle
groups.
Devices for measuring tension, such as springs, have also been used effectively by
researchers. Springs can offer a direct measurement of muscle tension simply by resisting
motion or contraction. Springs used in this fashion will have a known stiffness that allows
easy calculation tension, or force, calculations based on the amount of stretch. Many
dynamometers (force-measuring devices) used today use springs. Like in the use of weights,
springs must be applied consistently to yield reliable results. However, they can be used on a
wider range of motion and muscle groups (Low, 1996).
Other devices use pressure to measure force. Some of these devices are held against
reliable results through piezo-electric or displacement transducers. Accuracy from such
devices is also limited to the placement of the devices. Force plates also work on the same
principle.
Using computers and electric motors, more complex, yet accurate, isokinetic (same
velocity) dynomometers have been successfully used to estimate torque at a given joint.
With isokinetic dynomometers researchers can control a subject's contraction velocity and
range of motion. By holding the angular velocity of joint movement constant, the
dynomometer can accurately calculate the forces at the joint. By being able to connect to a
computer, the dynamic changes in joint moment and forces can be easily plotted against
position and velocity. Some of the more modem dynamometers are even capable of
measuring eccentric contractions as well as concentric and isometric.
With the acquired knowledge obtained from measuring torque, models that rely on
mathematical expressions to predict and explain muscle behavior under a variety of
circumstances can be developed. These models are often used to estimate muscle forces. In
an effort to better estimate the generated muscle force, some researchers have attempted to
improve existing models by better accounting for the contributions to muscle force made by
tendons and other non-contractile muscle elements (Hoy et al., 1988).
A unique method that does not involve the measurement of torque but involves the
measurement of muscular activity is the use of electromyography (EMG). EMG measures
the electrical activity of motor units as they are activated with electrical signals from the
central nervous system. Signals are amplified, processed, and recorded for analysis. Even
though the use of EMG signals has been used to accurately quantify muscle activity, it has
not been successfully used to quantify muscle force, or even torque around a joint.
A. L. Hoff and Jw. and Den Berg (1981) used EMG data to develop an electrical equivalent
of a muscle model developed by A. V. Hill in 1938. This model, the Hill Muscle Model,
used an analog system of resistors and amplifiers arranged in series and parallel to simulate
the effects of the various components ( contractile and non-contractile elements) of
contracting muscle. The results published in a series of four papers were only limited to the
EMG is limited by the fact that often times electrical signals not present in the
muscles under study appear in the recording in the form of noise. For this reason filters must
be used when recording EMG data. However, it is not possible to completely eliminate all of
the noise present without loosing some of the actual data. Using Fourier analysis method it is
possible to separate the various frequencies present in the recorded signal and thus analyze
the various signal sources.
Even with all its difficulties and limitations, EMG analysis is one of the most reliable
and accurate measurements of muscle activity. The biggest advantage to using EMG
analysis is that the researchers can accurately estimate the number of motor units activated
CHAPTER 4. ELECTROMYOGRAPHY BASICS
At the cellular level, muscle contractions occur once fibers are stimulated by an
electrical impulse transmitted through the motor neuron. These electrical impulses can be
detected, recorded, and analyzed through the use of electrodes and recording devices such as
a computer, magnetic tape, or trace paper. The primary focus of electromyography (EMG) is
the study of muscle function by measuring and quantifying electrical impulses. An EMG
signal is the sum total of all the electrical impulses detected and recorded from the muscle
tissue.
EMG Signal Detection
The detection of the EMG signal is done through electrodes that are placed near the
muscle, or muscle group, of interest. Even though electrodes come in a wide variety of
shapes and sizes, there are only three types of electrodes:
1) surface electrodes
2) needle electrodes
3) wire electrodes
As their name suggests, surface electrodes are placed on the surface of the skin
through some form of adhesive. An electrolytic gel is often times used to enhance the
skin-electrode interface and thus the electrical conduction properties of this junction. Surface
electrodes work best for studying muscles close to the skin, surface muscles. They are easy
to use and often times present no discomfort.
Fatty tissue between the skin and the muscle, hairs found on the skin, oil, dirt, and
other impurities, may interfere with the surface electrodes' ability to pick up EMG signal.
For this reason care must be taken to thoroughly clean the skin surface where the electrodes
will be placed.
Another limitation of surface electrodes is that they sometimes pick up electrical
signals from muscles that surround the muscles being investigated. This phenomenon, called
be completely eliminated, its effects on the EMG signal may be reduced by electrode
placement, or the use of a different type of electrode.
Needle electrodes are placed underneath the skin in closer proximity to the muscle
under study. These are essentially hypodermic needles adapted with wires to sense the
electrical impulses generated at the muscle area. Needle electrodes are good at eliminating
unwanted cross-talk from the EMG signal. They are small enough that they can be used to
detect impulses from individual motor units as they contract. They can also be repositioned
rather easily once inserted. This allows investigators to study different regions of the muscle,
or simply improve signal quality (Basmajian and DeLuca, 1985).
The small detection area provided by needle electrodes can be a problem if a larger
muscle is being studied. Pain and discomfort (at least initially) are, of course, another major
drawback.
Like needle electrodes, wire electrodes are also placed underneath the skin. Wires are
guided underneath the skin through a cannula, which is later removed. Wire electrodes give
the same advantages of needle electrodes, with the additional advantage of being able to
analyze much deeper muscles. Once inserted they are barely noticeable and do not limit
movement in any way (Bamajian and DeLuca, 1985). Of course, care must be taken to
properly sterilize both needle and wire electrodes.
The voltage from the muscle electrical impulses is relatively small (measured in
millivolts - mV). For this reason it is necessary to amplify the EMG signal. Some surface
electrodes are pre-amplified (active electrodes), while others are not (passive electrodes).
Often times the amplifier used will be a differential amplifier, which compares the muscle
signal to that of a site with minimal electrical activity. The signal common to both sites is
rejected and the difference is amplified.
Finally, when recording EMG signals it is often necessary to eliminate unwanted
signals from sources other than the muscle under study. Unfortunately, this unwanted signal,
called noise (cross-talk is a form of noise), cannot be completely eliminated. However, by
knowing the sources of noise, one can eliminate much of the noise present in the EMG signal
through the use of filters while leaving the muscle's signal unchanged. Common sources of
Since much of this external noise has a frequency of 60 Hz, it can be easily
eliminated through the use of a filter that filters out such frequency. Low frequencies can
also be introduced by movement of the electrodes relative to the skin or muscle. A majority
of the electrical activity of interest in an EMG signal occurs at frequencies between 20
Hz-300 Hz.
Three types of filters exist: 1) pass, 2) low-pass, and 3) notch filters. A
high-pass filter will filter out all the low frequencies while not affecting the higher frequencies.
Conversely, a low-pass filter will filter out the higher frequencies. A notch filter will have an
upper- and a lower-bound and will not change any signals with frequencies between these
bounds.
EMG Signal Characteristics
Once an electrical impulse reaches the motor units, the muscle fibers depolarize in
each direction. This depolarization, which triggers the sliding of muscle filaments, generates
an electric field in the vicinity of the muscle fibers that appears to travel along the length of
the motor unit. Once it reaches the vicinity of the detection electrodes, this traveling electric
wave is detected as the EMG signal.
The EMG signal is a complex signal that includes the electrical waveforms of a
multitude of motor units. Since the depolarization of muscle fibers overlap with each other,
the signal detected by the electrodes is a superposition of individual action potentials. This
signal from separate motor units is called the motor unit action potential (MUAP). In order
to maintain a muscle contraction, the motor units must be continuously activated. This
causes a sequence of MUAPs, called the motor unit action potential train (MU APT).
Therefore, the EMG signal is composed of a variety ofMUAPTs from a variety of motor
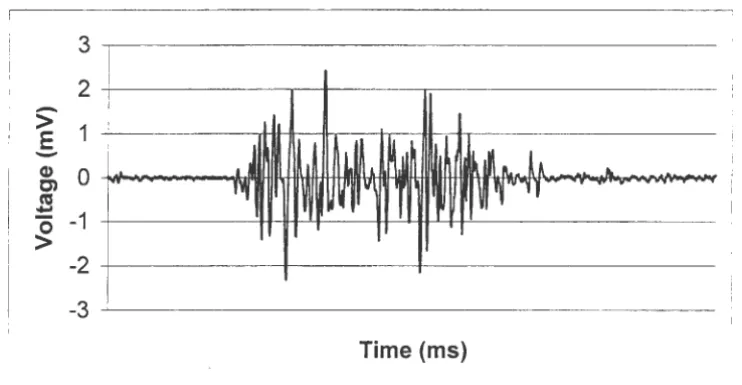
units detected simultaneously by the detection electrodes. Figure 4.1, below shows a typical
EMG signal.
A number of factors within the muscle itself affect the EMG signal. Among these
intrinsic factors is the number motor units activated with the contractions. As was seen
motor units activated in a muscle contraction, one can increase the tension generated by the
muscle. This increase in tension is manifested in an EMG signal by an increase in amplitude.
However, even though the amplitude of the EMG signal may be increasing, it doesn't
necessarily indicate an increase in muscle tension.
3
2
->
1E
-
(1)0
en co :!:::: -1
0
>
-2
-3
[image:38.567.92.463.183.375.2]Time (ms)
Figure 4.1. Typical EMG signal, the sum total of a muscle's electrical activity.
As the muscle begins to fatigue for a given force, more muscle fibers will be recruited
to assist in the contraction (see Skeletal Muscles and Fibers, above). This increase in number
of muscle fibers, and therefore motor units, will also manifest itself in an increase of EMG
amplitude even though the tension generated by the entire muscle remains unchanged.
Therefore, the EMO amplitude is an indication of the number of motor units detected.
Another intrinsic factor that has an effect on EMG is the motor unit firing rate
(sometimes known as rate coding). When a motor unit is activated by a nerve impulse, it
produces a certain tension. The amount of time needed to produce this tension is rather short
(see Figure 2.4). However, as mentioned in Chapter 2, the motor unit needs a certain amount
of time to relax, which is much longer then the amount of time to reach the tension by
comparison. If a second triggering impulse received by the motor unit before the period of
relaxation is over, the muscle fiber will contract further and with greater force.
If the motor unit continues to receive triggering signals before it is able to completely
reached. Once the maximum tension is reached a state of constant contraction, tetanus, is
observed. Further stimulation beyond this point will no longer cause further contraction, but
will only serve to maintain a constant tetanus (see Figure 2.5). This effect is manifested in
the EMG signal as a greater number ofMUAPTs.
Finally, the velocity with which the depolarization wave travels through the muscle
fibers, the conduction velocity, will have an effect on the frequency of the EMG signal.
Larger muscles, with larger muscle fibers, will have greater conduction velocities. Also, as
the muscle fatigues and lactic acid begins to accumulate, the muscle environment will
become more acidic ( of lower pH). This will tend to slow down the conduction velocity of
the depolarization wave. Temperature also alters the conduction velocity, with higher
temperatures producing greater conduction velocities. Specifically, a higher conduction
velocity will show up on an EMG recording as a higher frequency signal and vice-versa.
Some external factors that affect the EMG signal were already mentioned above.
These include: electrode types, equipment used, and ambient noise. Electrode placement is
an important extrinsic factor. Depending on the specific muscle under study, the electrodes
should be placed midway from the innervation zone and the distal tendon (De Luca, 1997).
The amount of tissue between the muscle and the electrode will often times act as a low-pass
filter (see above).
For surface differential electrodes, the distance between electrodes also plays an
important factor in the frequency of the EMG signal detected. The further apart the
electrodes are from each other, the longer it will talce the depolarization wave to travel the
inter-electrode distance. This will have the effect of decreasing the signal frequency. It will
also increase the detection area and therefore the possibility of cross-talk.
Finally, any relative movement between the electrode and the active motor units,
motion artifact, will also have an effect on the MUAP's shape. This type of relative
movement will sometimes alter the detection volume and may also increase the
inter-electrode distance of surface inter-electrodes. Even though it is often times impossible to
completely eliminate the relative movement between motor units and the electrode, one
EMG Signal Analysis
An understanding of the electrical impulses that trigger muscle contractions, and
therefore motor control, would not be possible without the development of mathematical
models. The best way to develop mathematical models that describe motor control is
through mathematically modeling an EMG signal. This has been done to a considerable
extent by a variety of researchers. A majority of the mathematical models available relate the
randomness of the MUAP's firing rate as a function oftime (Basmajian and De Luca, 1985).
However, a simpler approach has been to model the EMG signal as a simple superposition
(summation) of individual MUAPTs.
A generalized expression for an EMG signal, m(t), based on the sum of the individual
MUAPTs, ui(t), is given by:
n
m(t)
=
I u;(t). (4.1)i=l
In this expression then is the total number of detected MUAPTs detected in the EMG signal.
Notice that the expression for the EMG signal is a function oftime, t. This expression proves
to be convenient since most EMG recordings are done as functions of time.
Since an EMG signal is initially obtained by plotting voltage versus time, we are able
to see how the signal changes with respect to time. This plot of voltage against time is often
referred to as the time domain of the signal and any subsequent analysis of the signal with
respect to time is called a time domain analysis ( or an analysis in the time domain).
When the EMG signal is plotted in the time domain, one is able to see that the
amplitude of the signal varies randomly as with time. Due to this random nature of the EMG
signal, the average value is zero. Therefore, the calculation of the average of an EMG signal
would not yield any useful information. In order to overcome this problem, the EMG signal
is often times recorded by displaying only positive values. This is known as rectification.
EMG signal rectification is done in either one of two ways: half-, or full-wave
rectification. During a half-wave rectification of the EMG signal, only the signal's positive
values are plotted against time. A full-wave rectification is accomplished by inverting all the