Abstract
:
Cloud platform and data centers rely on forecasting for predicting future workload accuracy. Forecasting information facilitate appropriate virtualization in provisioning infrastructure in cost-effective manner. Forecasting accuracy relies on underlying algorithm performance merit based on data fed in the network. Data analyst faces problem of timely identification of discontinuities in data forecasting. Discontinuity is referred as abrupt time-series pattern change for performance persists which cannot be recur. Data analyst must identify the non-sequences in the data performance before proposing forecast method and retain forecasting model data performance at the time of data synchronization. In existing numerous approaches and tools are available for anomaly detection in data. However, still automated tools for anomaly detection do not exist for anomaly detection in data centre. This paper introduces a unsupervised fast regression (UFR) model for discontinuity data detection in large and small data centers. UFR model combines concept of regression where data are converted in to binary form for data discontinuity detection. The proposed approach facilitates cloud providers and data center analysts automatically detect data discontinuity. Performance evaluation of proposed approach with existing approach exhibited significant performance in terms of discontinuities identification with increased accuracy.Keywords:-Unsupervised fast regression (UFR), Malicious Activity, Security, Discontinuity
I. INTRODUCTION
In recent years, cloud infrastructure requires cost-effective and appropriate virtualization concept for implemented workload size, type and service request. Estimation of infrastructure based on specified set of service request and specific period leads to resource wastage, increased cost and under-utilization. In this scenario, future workload prediction is also not acceptable due to under-estimation factor which degrades quality of service and leads to client Service-Level Agreement (SLA) violation. On the off chance that when SLA necessity is met it will lessens infrastructure cost, prerequisite of server farm administrator for indicated length for anticipated workload.
Revised Manuscript Received on June 05, 2019
J. Dillibabu, Research scholar Bharathiyar University, Coimbatore,Tamilnadu,India.
K. Nirmala, Associate Professor, Quaid-E-Millath Government college for women, Chennai, India.
The goal of short-term forecasting is exact expectation of not so distant future workload, for example, for one to two hours dependent on ongoing execution history of server farm. Short-term forecasting is used by server farm administrator for dynamic arrangement of assignment in server farm explicitly for load balancing. Exact forecasting in short-term allows close ideal provisioning for improving utility of infrastructure accessibility. Forecasting in long term involves necessary capability planning for ensuring cloud infrastructure support and evolution based on client requirement. In present era, world without Internet is not possible to ensure security in cloud is designed for network security [1]. To overcome cyber security issues in computer network intrusion system is developed for network comparison parameters in terms of CIA (Confidentiality, Integrity and Availability) or computer network security parameters. NIST presented a definition for intrusion detection as “In a computer, it is a process to monitor the event or to analyze possible incidents occurring in the system which are imminent violation threats against security policies”. Generally cloud is a type of software which detects malicious or discontinuities in the network automatically [2]. In recent years, development of efficient cloud is merging research area due to virtualization higher dimension and dynamic environment with higher sample size. Generally, intrusion detection is observed as identification and classification of distinct characteristics between malicious and traffic data pattern [3].
Cloud operates with two distinct characteristics of matching patterns and statistical anomalies. In this pattern matching scheme is based on signature - based on cloud to detect discontinuities in cloud database. This model used audit logs to detect incidents based on audit logs and with knowledge of discontinuities alarm of signature data base. Major drawback of pattern matching is identification of discontinuities with signature in cloud database. In case of statistical anomaly system pattern is normal behavior as stored in cloud database. In wireless network system actions are monitored continuously to detect variation in the performance of network for detection of discontinuities. Anomaly detection has main advantage of detection of unknown discontinuities even this technique consider unusual pattern as discontinuities which means false positive is higher in this technique . Malicious intrusion or discontinuities on computer break the computer security in-terms of
integrity, availability and confidentiality. To protect
Supervised UFR (UFR Fast Regression)
Machine Learning Algorithm for Enhancing
Performance of Intrusion Detection System
computer and network traditional techniques data encryption, firewalls and authentication mechanism are used. Cloud system with conventional technique provides no sufficient protection against security threats. Hence cloud system is incorporated in hardware as software product for automatic examination of threat detection in training network [4]. Cloud requires fields such as IP address, optional field and flags in comparison with other field packets. Machine Learning (ML) algorithm similar to those of human learning approach which acquires knowledge from previous knowledge. Knowledge acquisition of some task is obtained through learning process. Human brain learn from the experience based on this machine learning algorithm are developed. In recent researches numerous ML has been proposed based on the learning process it is classified as supervised, non-supervised learning approach and reinforcement learning approach [5].
For robust cloud development drawback in conventional technique lead to development of computational technique for intelligence is presented in Bayesian networks, fuzzy logic, ANN, decision trees, fuzzy logic, PCA etc. were extensively used [6]. In this machine learning approach, performance of SVM (Support Vector Machine) exhibits effective performance in terms of efficiency, robustness, risk minimization and generalization ability etc. [7,8]. Even this
SVM machine learning approach lacks in
performance-centric with subset selection, imbalanced virtualization and optimization parameter [9]. To overcome this limitation of SVM in recent work Meta - heuristic technique is developed [10].
A. Contribution of Work
This paper introduces a UFR Fast Regression Classifier for discontinuities or malicious activity detection in cloud system. For analysis this research uses CIC cloud 2017 virtualization. The foremost advantage of this virtualization is redundant data are minimal hence accuracy of malicious detection is increased. Collected virtualization is fed into MATLAB and evaluated with proposed UFR mechanism. In proposed UFR scheme UFR classifier and regression classifier are combined for discontinuities identification and classification. Comparative analysis of proposed UFR scheme with existing approach exhibits significant performance in-terms of discontinuities identification with reduced computational cost.
B. Preliminaries of work
In this section presented about selected virtualization for discontinuities classification and identification. Cloud system virtualization CIC cloud 2017are used for cloud discontinuities identification in the network.
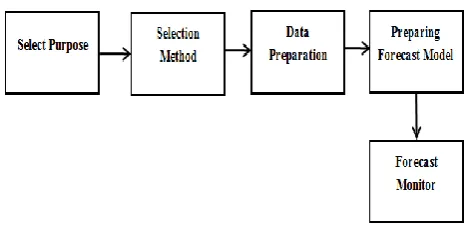
STEPS INVOLVED IN FORCASTING
The data analyst will gather the major important information from the receiver or from the end user about the purpose of forecast. The forecaster collects initial information from the receiver. i.e., a) purpose of forecast (e.g., operations are intrigued to consider the normal volume of workload on a day by day to week by week reason for effective and load balancing arrangement of machines, while, showcasing and deals are progressively worried about customers development, arranging workforce levels, scheduling just as purchasing) and b) time forecast about horizon (in terms of time durations).
C. Technique Selection
In light of developmental the predictive and inspiration driving requester, the master picks an appropriate strategy (e.g., moving midpoints with exponential smoothing for momentary estimates and example conditions for long haul gauges). Consistently, the investigator uses more than one anticipating strategy for getting autonomous estimates. If the picked methods around produce a comparative exactness, by then that extension of trust in results; contrast among figure shows that the specialists need to come back to the strategy. D .Data Preparation
[image:2.595.304.539.584.697.2]For investigators it is the basic and expensive predictive ventures. unfortunate forecasts can result from in sufficient information planning. Here, examiners sterilize and preprocess the information for making it fitting for the methods used to forecast which are picked in the preceding advance. At the season of sanitation missing, insignificant, unfilled and incorrect execution counter factors are dealt with [11,12,13]. Counter information is missing when an exhibition screen don't record an event of act counter. A counter is unfilled when an asset can't begin the vital administration. From that point the examiners preprocess the information using their procedure composed contents to total execution counters crosswise over different subsystems of server farm to infer client saw counters [14] like transaction reaction time, client hold up time, inactivity and distinguished throughput. These qualities catch the client interaction with their framework as the in-transaction/request/job moves through the different subsystems in a server farm. Also, preprocessing readies the information in the particular configuration required by the picked forecasting procedures. Along these lines, the information are preprocessed (i.e., extrapolate, standardize and scale) by the examiner accordingly.
E. Prepare Forecast
To build up a predictive model in arranged time series training data, the expert used to choose estimating procedure. It has low blunder rate, i.e., its anticipated qualities are closer to the continuous series esteem, without either under or over fitting. Investigator tunes the parameters of the figure systems a few times to locate the best type of the model that fulfills the requestor's estimate objective.
Figure 1: Steps in forecasting F. Monitor Forecast:
favors a gauge for a pre-planned term before sending it in the generation. The forecaster checks presumptions, differentiate the predicted qualities (exchange volume, asset usage, or workload of machines) to the genuine qualities experiential as in the data center, and sees whether any inside or outer occasion influences the conjecture results. When the model to conjecture is given over to the requestor, a frequent observing point for the prediction is set up (i.e., month to month, quarterly or at regular intervals) for finding any proof of real contrast between the genuine and anticipated outcomes and to recognize any deviation factors enjoyed is progressions. Any variety more noteworthy than the most extreme is examined and forecast model is either acclimated to oblige the variance or retrained for the brokenness.
II. PROPOSED APPROACH
This part shows the suggestion to overcome the challenges examined in the past part and demonstrate the real strides of the projected methodology. It detail the means as pursues:
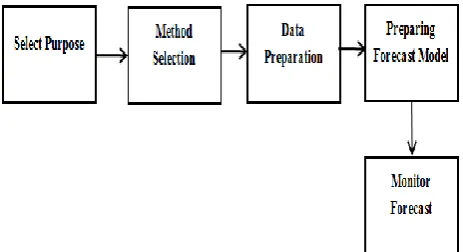
A. Data Preparation
From the production environment thus the performance logs are acquired. (i.e., data center) In this proposed method it is not adequate for direct analysis. Performance logs must be clean for noise, e.g., empty counter variables or missing counter data. For dealing this type of problem (incomplete data), record-wise deletion is employed. When the ith
surveillance for a counter ‘T’ is misplaced, list-wise deletes
[image:3.595.58.290.555.681.2]the relating ith examination of all the counter variables. Fractional void counter variables and counter variables that have over 2% of the misplaced information are consequently expelled amid the purification procedure. With mean-focusing, the normal of each execution counter factor is figured and afterward subtracted from its comparing counter information. Every scaled variable at that point has an equal (unit) variance, i.e., every factor with a mean of 0 and Standard deviation of 1.
Figure 2: Steps in discontinuity identification B. Anomaly Detection
Any endeavor made to perceive the purposes behind anomalous information encounters both the trouble to have a go at characterizing an altogether different arrangement of unexpected patterns in information as per at least one general qualities just as the trouble to pick thresholds which sensibly
recognize typical change in genuine information, and perhaps abrupt anomalous precedents in that practically identical information. Marginal cases may be somewhat discretionarily set apart as either anomalous, or not anomalous, with such optional naming conceivably essentially influencing coming about desire. A couple of strategies, like relapse, endeavor to predict future outcomes from just information the seen to date
however others (like Fast Fourier Transform
investigation)search for examples inside the preparation data, so as to anticipate up and coming outcomes. When trying to recognize oddities in most recent execution data for which future execution data isn't accessible at present, at that point recognizing a transitory peculiarity and a more drawn out term intermittence is beyond the realm of imagination. In any case, we can follow the operation mean and dissimilarity inside the watched data, and assume that watched qualities surpassing some difference of the fluctuation from the mean or ongoing windowed data failing the t-test are anomalous. When working with training data, we discover discontinuities by expecting that discontinuities can't be particularly shown by a low solicitation polynomial function. Given a demonstration counter time arrangement data {v[t]}, we harsh the arrangement by the quadratic function f(t) = c+bt+at2 that confines the least squared blunder (LSE).It expect that the
series containing unexpected amazing changes,
discontinuities or oddities won't very much fit by this approximation and therefore LSE might be bigger.
To find precisely where troubles emerge in fitting this model to the performance counter data, we start by demonstrating the performance counter's n data focuses as n successive quadratics find which has coordinates {c = v[ti], with the end goal that a = b = 0} and accordingly LSE=0. A voracious algorithm specifically replaces sets of progressive quadratics demonstrating neighboring data by a single quadratic until our performance counter time series is displayed by a single quadratic. At each progression choice is made with the end goal that the expansion in the absolute LSE is limited. Supplanting with a similar increment in LSE are chosen by allocating need to those new quadratics having littler |ai|, at that point |bi|, and after that if essential modeling shorter subsequences. At each progression the two information indicates that come a finish of a subsequence when are blended offer an expense related with them which is just the complete increment in LSE of the subsequence they formally have a place with when this subsequence is demonstrated by a quadratic spanning the more drawn out now consolidated pair of subsequences. Inputs can be standardized (having mean μ=0, and change Ϭ2=1) whenever cost on various inputs must be practically identical.
C. Discontinuity Identification
This progression in the proposed methodology shift through discontinuities among all anomalies recognized in the past advance and comprises of the sub-steps as referenced below. D. Distribution Comparison
After the anomaly change period has passed, performance counter value returns back to
expansion or decline in the value of the performance counter persists after the progress period as appeared in Fig.1 (a, b). This sub-step of our approach thinks about the distribution of the performance counter when the period of anomaly progress. Wilcoxon rank-sum test [15] is employed for comparing the two distributions. We pick this test since it is non-parametric and does not require the information to be regularly disseminated. We directed Shapiro – Wilk test of normality to affirm that our information got from both mechanical and an open source framework (examined in area IV) is not typically appropriated. Wilcoxon rank-sum test at the significance level of 1% (i.e., 0.01), ρ-value < 0.001 shows that the invalid hypothesis (H0) (i.e., two distributions are same) is rejected; at that point the presence of a brokenness is finished up.
E. Measuring Discontinuity:
At the point when an anomaly period is long, i.e., ranges over half a month (e.g., moderate dispersion of a memory spill) to a month (when an as of late included component is expelled or a hotfix is moved back when a relating patch is prepared), the estimation of execution counter will come back to the equilibrium state mirroring the ordinary conduct of the system under comparing load. Notwithstanding, there exists slight variety among the conveyance of counter when the time of long progress either in view of persist impact of an anomaly or counter extrapolation rate, similar to month to month improvement in workload volume and CPU utilization. For all intents and purposes, examiners don't consider such a moment contrast between the circulations as a distinction, paying little heed to the distinction being statistically huge. F. Proposed UFR
This paper suggests a novel classifier method for improving accuracy and presentation of cloud network. The proposed UFR combines the existing UFR and UFR classifier. In this UFR t is used for identification of discontinuities and data set classification while UFR is for conversion of data in to 0’s and 1’s for improving accuracy. General step in proposed UFR is
Generally, UFR belongs to ensemble classifier for prediction of strong classifier from weak classifier. Through training data strong classifier are identified and correct the errors based on binary classification. UFR algorithm is generally a class of machine learning technique for identification of weak learner. This resolves classification problem and improve the classification accuracy. Most preferable algorithm used with UFR algorithm is decision tree at various levels.
The equation considered in this research for UFR classifier is
t t t tH
sign
h x
Classification accuracy of the cloud in this research combined UFR (LR) with UFR Classifier. For TLR binary classification and multiclass classification are used. In LR prediction of fitting data for occurrence is based on Logistics function. Logistics function value ranges from 0 and 1 in case if value is above 0.5 than automatically it is considered as 0 .
1
( )
1
Txh x
g
e
Above mentioned logistics equation is modified in order to achieve sigmoidal functio
Above mentioned logistics equation is modified in order to
achieve sigmoidal function to cope with UFR classifier to
minimize computational time. The mathematical formulation
is mentioned as follows:
T
y
x
The above equation is basic linear equation model for
UFR for obtaining sigmoidal function in linear function for
basic sigmoidal function with linit (-∞, ∞) is
1
1
1
x
x x
e
e
e
Taking probability values for regression
0 1 1 2 2
...
k kP
a
a x
a x
a x
0 1 1 2 2...
1
k kP
b
b x
b x
b x
P
log
log
1
T
P
x
P
After Applying natural exponential property
log
1
j jP
b x
P
Where
j j
P
b x
hence for UFR equation
exp
1 exp
j j
j j
b x
P
b x
To improve
To improve the act of the projected UFR algorithm computational time and accuracy chain rule property and maximum like elihood property is combined, the chain rule property and maximum like Elihood property used in this research are started as follows:
'
'
'
F x
F g x g x
After applying above property and simplification we obtained
equation as,
1
P
P k
P k
Maximum likelihood estimation for P is,
1
1
;
ln
n
i i
l
x
f x
n
log
ilog 1
i iP
P k
P k
Removal of negative term offers,
i
P
P
Now,
P
a
0
a x
1 1
a x
2 2
...
a x
k k
P
iHence the final equation for proposed UFR algorithm is,
1N
i t t j
H
Sigmoid
P h x
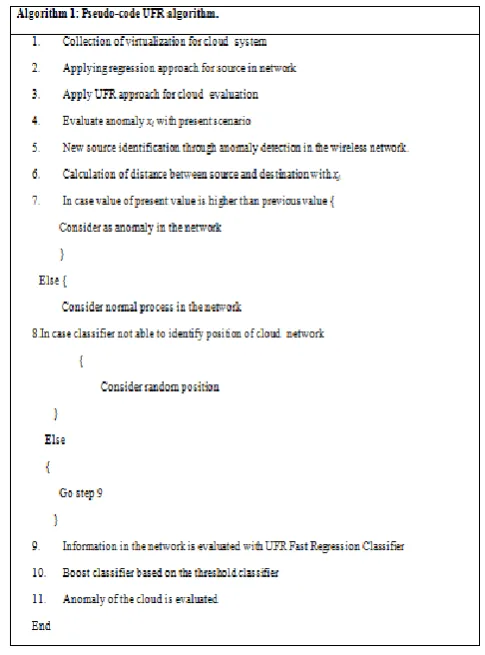
The algorithm involved in UFR are presented as follows:
[image:5.595.305.548.51.379.2]In the above algorithm the statistical analysis of CIC cloud 2017 virtualization is used based on likelihood model. Simulation performance of collected CIC cloud 2017 virtualization is examined using MATLAB simulator with Intel(R) 7700 whose clock speed is 3.60 GHz and processor with 8 GB memory. In the collected virtualization 66% were used for pre-processing which is training and 34% were used for testing. Evaluating anomaly in the cloud system is evaluated through generated rules. In the generated rules for machine learning algorithm flag value higher than 0 than it is anomaly else it is not anomaly.
In case flag has been set ‘0’ for long time than it is considered as normal activity. Else if flag value 1 is set than it is considered as anomaly activity. Through the appropriate rule normal and anomaly activity has been evaluated based on the regression mechanism.
G. Experimental Results Analysis
The projected UFR is evaluated by considering following evaluation metrics which are described in this section. The major critical factor in evaluation metrics is confusion matrix. Classification of any machine learning process have significant error rate for correctly classification instance. Accuracy of classification is defined as correctly classified instance as shown in equation (1) as follows:
(
TP TN
)
Accuracy
TP TN
FP
FN
(2)
Where True positive esteem is depicted as TP; TN is True Negative; False Positive as FP and False Negative as FN. By and large, TP is otherwise called affectability. For any grouping case true positive esteem must be high subsequently
TP rate is portrayed in equation
(2):
TP Rate
TruePositive
ActualPositive
(3)
FP demonstrates the quantity of positive value depicted as positive. For compelling classifier FP rate ought to be negligible as signified in equation (3):
FalsePositive
FP Rate
ActualNegatives
(4)
Another calculates considered this examination is accuracy or positive predictive value (PPV). This is utilized for estimating the quality and precision of the classifier as appeared equation (4):
Pr
(
)
True Positive
ecision
True Positive
False Positive
(5)
Culmination of the classifier is estimated utilizing review which present genuine hit of proposed UFR algorithm. In light of the significant occasion likelihood this esteem determined. Review esteem sway on FN which implies insignificant review prompts increment in FN in Eq. (5):
Re
(
)
True Positive
call
True Positive
False Positive
(6)
To ascertain the accuracy of order Tradeoff esteem for grouping accuracy tradeoff focuses for information of same classed are assessed for assessing class accuracy of each class through after condition:
Pr
Re
2
Pr
Re
ecision
call
F
measure
ecision
call
The normal execution of the classifier is portrayed as ROC-Area for Conceivable cost ratio distinguishing proof among FP and FN. At the point when ROC region is 1 then it is known as flawless forecast rate. In view of the ROC esteem variety arrangement is assessed.
H. Analysis using UFR
[image:6.595.304.550.442.600.2]The primary functionality of UFR classifier is to evaluate the discontinuities in the cloud. The selected virtualization contains 153026 instances with 12 features. Among 12 features Performance of proposed UFR classifier is comparatively examined with (1-5)NN, For every traffic in the network, performance of UFR classifier is evaluated based on traffic instance, suspicious, unknown, victim class, normal and discontinuities. Through MATLAB training data were analyzed with 172839 instances. Simulated results for the proposed UFR scheme are evaluated based on the classification instances discontinuities, victim and normal. Training data of UFR classifier with training data provides average accuracy of 99% when compared with existing approach k-nn provides maximum accuracy of 98.6%. Almost our proposed UFR achieves average accuracy near to 100%. However, 100% accuracy is not possible in conventional technique this is due to virtualization collected for random sampling instances with selection of biased instance. Virtualization analysis increased based on neighbour numbers. For classification accuracy feature selection is adopted for feature selection. Evaluation metrics ROC and FAR are used for virtualization evaluation.
[image:6.595.303.552.443.834.2]I. FINDINGS
In existing machine learning algorithm uses different virtualization which differs from Intrusion detection virtualization. Fewer existing machine learning algorithm are Support Vector Machine (SVM), Gaussian Naive Bayes and random forest. In this paper developed a machine learning algorithm for intrusion detection virtualization. Simulation is performed in MATLAB with system configuration Intel Core ™ i5 processor which operates in frequency of 2.60GHz and 4GB RAM memory. The proposed UFR algorithm combines both UFR model and UFR classifier for Intrusion detection system virtualization.
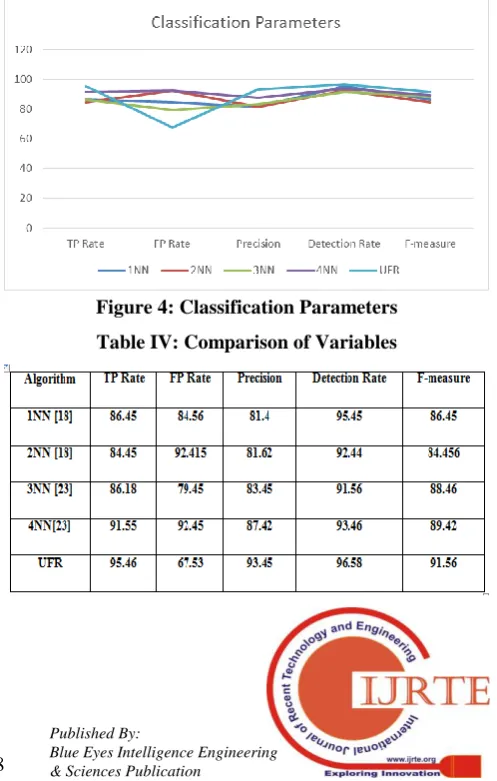
Simulation performance of proposed algorithm is comparatively examined with existing machine learning algorithm such as C4.5, Decision Stump, Random Tree, Random Forest, NB Tree, AD Tree and Simple Chart. Comparative analysis of proposed algorithm with existing approach exhibited significant performance in comparison with existing approaches. Performance measure of proposed approach is comparatively studied in terms of TP, TN, FP and FN to measure efficiency of proposed approach. UFR approach has minimal incorrectly classification instances of 11 with higher classification rate of 99 which is significantly higher than other existing algorithm. Through this it can be concluded that proposed approach effectively classifies the discontinuities in the Intrusion Detection System. In other hand, comparison of proposed UFR algorithm with 1NN, 2NN, 3NN and 4NN neural network TP, FP, Precision rate, Recall and F-measure are idle of 1 which is superior to other existing approach. On the whole it is observed that proposed UFR algorithm exhibits significant performance.
III. CONCLUSION AND FUTURE ENHANCEMENT
Cloud infrastructure requires cost-effective and appropriate virtualization concept for implemented workload size, type and service request. This paper proposed a unsupervised fast regression (UFR) model for discontinuity data detection in large and small data centers. UFR model combines concept of regression where data are converted in to binary form for data discontinuity detection. The proposed approach facilitates cloud providers and data center analysts automatically detect data discontinuity. Performance evaluation of proposed approach exhibited recall value of 91.56% and precision of 93.45%.
REFERENCES
A. Bondi, "Automating the analysis of load test results to assess the scalability and stability of a component," in cmg-conference-, 2007,pp. 133.
2. Raman.M, et al., “A hypergraph and arithmetic residue-based probabilistic neural network for classification in intrusion detection systems”. (2017) Neural networks, 92, 89-97.
3. Yang, et al., “Adaptive fuzzy interpolation”. Ieee transactions on fuzzy systems, (2011). 19(6), 1107-1126.
4. Villalba, l. J. G., et al., “Anomaly-based network intrusion detection system”. Ieee latin america transactions, (2015). 13(3), 850-855. 5. T. Dasu, et al.,” exploratory data mining and data cleaning”. John
wiley & sons, 2003.
6. Lin, s. et al., “Particle swarm optimization for parameter determination and feature selection of support vector machines”. Expert systems with applications, (2008). 35(4), 1817-1824.
7. Onyeji, et al., “Cyber security and critical energy infrastructure”. The electricity journal, (2014),27(2), 52-60.
8. Tang,et al., “Feature selection for classification: a review”. Data classification: algorithms and applications, (2014). 37.
9. Goswami, et al., “Feature selection: a practitioner view”. International journal of information technology and computer science (ijitcs), (2014). 6(11), 66.
10. Ambusaidi, m. et al.,”Building an intrusion detection system using a filter-based feature selection algorithm”. Ieee transactions on computers, (2016).65(10), 2986-2998.
11. H. Malik, et al.,"Automatic comparison of load tests to support the performance analysis of large enterprise systems," in 14th european conference on software maintenance and reengineering, madraid, spain, 32-2010, pp. 222-231.
12. Z. M. Jiang, "Automated analysis of load testing results," in proceedings of the 19th international symposium on software testing and analysis, 42-2010, pp. 143-146.
13. K.C.Foo, et al.,, "Mining performance regression testing repositories for automated performance analysis," in 10th international conference on quality software, 45-2010, pp. 32-41.
A. Bondi, "Automating the analysis of load test results to assess the scalability and stability of a component," in cmg-conference-, 2007,pp. 133.
14. Onyeji, i., et al.,(2014). “Cyber security and critical energy infrastructure”. The electricity journal, 27(2), 52-60.