International Journal of Innovative Technology and Exploring Engineering (IJITEE)
ISSN: 2278-3075, Volume-8 Issue-8, June, 2019
Software Engineering Innovative Risk Analysis in
Matrix Tool
ShankarNayak Bhukya, Suresh Pabboju
Abstract: The purpose of the research is to propose a framework for quantitative risk analysis for more optimal solutions by analyzing risk duringnecessities engineering segment of SDLC. The following two cases are consider for my research proposed work
I. RISK IDENTIFICATION
Here result analysis is done considering two cases
Case 1: Here the candidate solutions are directly applied to probability –Matrix tool to find out the advantages of applying Genetic algorithm to candidate solutions.
Case 2: Here the genetic Algorithm is applied to Candidate solution and then its output is applied to probability–Matrix tool to find visibility of risk. The Sample values taken for Probability and Collision are shown in form of table
Probability Category Probability number
Very High 9
High 7
Medium 5
Low 3
Very Low 1
[image:1.595.302.550.159.666.2]Table 1.1Sample Probability Test
Table 1.2 Sample Collision Test
The probability values are decided on the basis of Den and Likelihood values as shown in below table.
Table1. 3 Calculation of Probability
Case 1: Here Genetic Algorithm is not applied to
candidate solutions.
Can did ate solu tion s
SA T()
DE N()
Likel ihood
Prob abilit y
Prob abilit y numb
er Coll ision
Co llis io
n nu m be r
Ris k Fa cto r
S1 Ful
l Nu
ll Likel
y
Low 3 Low 2 6
S2 Par
tial Nu
ll Occas
ional Medi
um
5 Med
ium
5 25
S3 Ful
l Par
tial Occas
ional Medi
um
5 Med
ium
5 25
S4 Ful
l Par
tial Occas
ional
Low 3 Low 2 6
S5 Par
tial Ful
l
Rare High 7 Mo
w
5 35
S6 Nu
ll Ful
l Unlik
ely
High 7 High 7 49
S7 Par
tial Par
tial
Rare High 7 Med
ium
5 35
S8 Par
tial Par
tial
Rare High 7 High 7 49
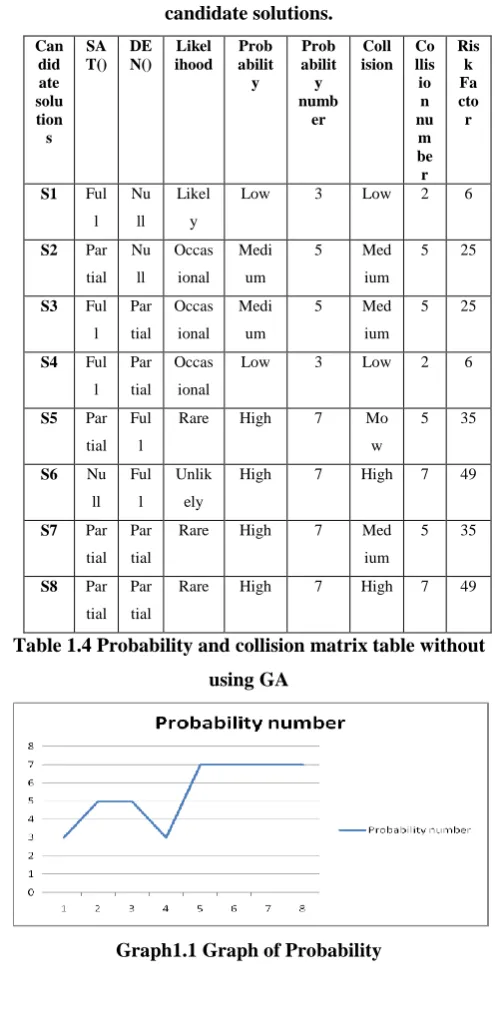
Table 1.4 Probability and collision matrix table without
using GA
Graph1.1 Graph of Probability
Project Objective
Very
Low Low Medium High
Very High
1 2 5 7 9
[image:1.595.53.553.179.667.2]Graph1.2 Graph of Collision
Graph1.3 Graph of Risk Factor
The graph shown above does not throw much light on intensity of risk. So is the case with Risk factor formula which is
Risk score / Risk Factor = Probability * Collision
Illustration:If the risk has lowprospect and is allocated a score of 1
If the collision is momentous and is dispensed an collisioncost of 9
Risk score / Risk Factor = Probability * Collision = 1 * 9 = 9
In some cases, it becomes very difficult to detect risk so we can include difficulty of Detection value also in the formula which is optional
1. Probability-Collision Matrix Tool
Risk investigation is an imperative task of all software industries herein world. In today world all organizations execute high end, Complex and expensive projects which necessity be successfully accomplishwithinundecidedas well as always uncertainatmosphere. As a project leader, Team leader, Manager or as a software engineer, it is the duty of all team members to be aware of risks and have visibility of risk and this can best be done by probability collision matrix tool. This tool helps to prioritize risk. If this tool is used effectively it helps us to focus our efforts on most important risks.It’s a qualitative risk investigationdevice.It is evaluates
--- Likelihood (prospect) that a finicky risk determination arises
--- Probablecollision (Consequences) on apurpose if it occurs
Every risk is question for prospect and collision
How to use probability collision matrix tool
A sample version of the tool is shown below
Graph1.4 Sample Tool
The Risk probability collision matrix tool is stand on the principal so as to a risk has 2mainproportions. They are 1)Probability-A risk is an occurrence so as to couldarise.
The possibility of its happening presser veassortmentwhereveras ofimmediately 0 percent to immediately 100 percent.
Note-it cannot be precisely 100 percent sinceafter that it would be a conviction, not a risk. And it cannot be accurately 0 percent, since it cannot be a risk.
2)Collision- A risk by its sceneryforever has a pessimisticcollision. Though, the dimension of the collision fluctuates in stipulations of rate etc.
The tool tolerates us to speedpossiblerisk on these two extents. The prospect that a riskdeterminationarise is characterize on Y axis and the collision of the risk if it arise is represented on X axis. The essentialstructure of the risk Probability/collision is revealed below
Graph1.5 Basic chart
The corners of the chart have these characteristics-
1.Low Probability/Low Collision -Risks in the bottom level corner are low level, and it can be ignored.
2.High Probability/Low Collision-Risks in the top left corner are of moderate
importance. 0
2 4 6 8
1 2 3 4 5 6 7 8
Impact Number
Impact Number
0 10 20 30
1 2 3 4 5 6 7 8
Risk Factor
International Journal of Innovative Technology and Exploring Engineering (IJITEE)
ISSN: 2278-3075, Volume-8 Issue-8, June, 2019
If such risks occur then it is necessary to cope with them and move on. However it is necessary to reduce the likelihood that they will occur.
3.Low Probability/High Collision-Risks in the bottom right corner are of high importance. If these risks occur then contingency plans should be ready and it should take care of risk.
2.High Probability/High Collision-Risks towards the top right corner are of critical importance. These risks should be of top priority and must pay close attention.
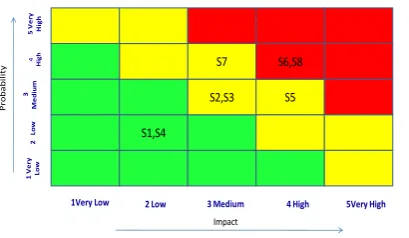
S1,S4
S2,S3 S5
S7 S6,S8
1Very Low 2 Low 3 Medium 4 High 5Very High
Impact
1
V
e
ry
L
o
w
2
L
o
w
3
M
e
d
iu
m
4
H
igh
5
V
e
ry
H
igh
Pr
o
b
ab
il
it
y
Graph1.6 Outputs without Using GA
[image:3.595.67.272.183.302.2]From the tool we conclude that S6, S8 candidate solution have High Probability and High collision which is to be avoided. Here the candidate solutions obtained in Graph1.9 are applied to probability-collision matrix tool. Here Candidate solutions are obtained without applying Genetic Algorithm and only cost attribute is used to obtain candidate solutions.
Table 1.5 Probability and Collision matrix table Output using GA
All risks do not have same collision on software project. Some risk has more collision, while some have intermediate collision and the rest may have less collision. Also is the same case with Probability. Some risk has high probability, while some risk has intermediate probability and the rest may have less probability of occurrence. So we need to understand risk so that software engineer in the project can take note of it and avoid high collision, high probability risks first which are very dangerous. This is the reason to use 3x3 matrixes as shown in Graph1.11.The probability and collision matrix tool helps in detection, estimationas well as prioritization of risks pursueviacorresponding and economical submission of propertytowarddiminish, observe and organize the possibility and collision of adversemeasures.
Graph1.7 Graph of Probability using GA
Graph1.8 Graph of Collision using GA
Graph1.9 Graph of Risk Factor with GA
S11 S55,S66
S44 S22
S33
1Very Low 2 Low 3 Medium 4 High 5Very High Impact
1
V
e
ry
Lo
w
2
Lo
w
3
M
e
d
iu
m
4
H
igh
5
V
e
ry
H
igh
Pr
o
b
ab
il
it
y
Graph1.10 Output Using GA
Analysis of Probability and collision Matrix
From Probability Matrix tool it can be observed that no candidate solution obtained is having High probability and high Collision. We have some candidate solutions like S55,
0 5 10
1 2 3 4 5 6 7 8
Probability
Pro…0 10 20 30
1 2 3 4 5 6 7 8
Risk Factor
Risk …0 2 4 6 8
1 2 3 4 5 6 7 8
S66 which have low probability but high collision. These candidate solutions can also be avoided since collision is high. From Graph1.11, we can observe that that S22 have intermediate probability and intermediate collision .So we can select it and reduce the likelihood when they occur. We have some candidate solutions in the range of intermediate and low probability, and low collision .Such candidate solutions are in safe zone.
Graph1.11 3 x 3 Matrixes
Magnitude of
Collision Collision definition
Sc or e Rati ng High Probability/High Collision
Very High collision. They are the principalrisk that
organization mustrecompenseconsideration
.
5 A
Intermediate Probability/High collision Or High probability/ Intermediate Collision High collision This riskencompasswhichever a high possibility of incidence or a considerablecollision
4 B
Intermediate Probability/Intermedia
te collision
Intermediate collision here is a intermediate probability that the risks materializeconspicuouscollisi
on
3 C
Intermediate probability/low collision Or Low Probability/intermedia te collision Low Collision These Risks can occur in some situations and have a low to intermediate collision.
2 D
Low probability/Low collision
inconsequentialCollision This isrisks through low possibility of incidence and low collision. Therefore can
be abandoned.
[image:4.595.48.288.258.582.2]1 E
Table 1.6 Risk Exposures
Required Steps to find the risk status
1)The initialpace was towarddescribe the probability of risk incidence from Table 1.1
2)The 2ndpace was to situate the collisionscheduled a degree of 1 to 5 from Table 1.2
3)Then the 3rdpace was to establish the risk revelationconsequentialstandardsspecified in Table 1.6 So applying all the above three steps on candidate solutions
obtained from genetic Algorithm, the Output is S55- S66-high collision/low probability-Grade/Rating C S22-Intermediate Probability/Intermediate
Collision-Grade/Rating C
S33-Low Collision/High Probability-Grade/Rating C S11-Low probability/Low Collision-Grade/Rating E
S44-Low Collision/ intermediate Probability-Grade/Rating D Low Impact /High Probability C Medium Impact/Mediu m Probability C Low Impact/Mediu m Probability D Medium Impact/High Probability B Impact Pr oba bi lit y High Impact /High Probability A High Impact /Medium Probability B High Impact /Low Probability C Medium Impact /Low Probability D Low Impact /Low Probability E 3X3 Matrix
Graph1.12 Probability –Collision Grades
The final case study obtained after genetic algorithm is shown in below graph6. The combination of goals of the candidate solutions obtained above can be used for success. After obtaining the results it is necessary to respond to the risk. This is done by reducing the probability of negative risk by proper planning and to increase positive risk. Risk planning can be done by using any of the following methods Negative Risks can be dealt with by:
1)Risk Acceptance: This step can be taken if Risk is of low collision and low probability as shown in above fig 2)Risk Avoidance: This step can be taken if Risk is of High
collision and high Probability. Here Plan is changed to avoid the risk. Also using a proven approach instead of new approach. Also it is necessary to increase team communication to tackle such situations.
3)Risk Reduction: This step can be taken when we obtain result which is Intermediate collision and intermediate possibility or Low collision and high probability.
4)Risk Transfer: bestand easy way to tackle risk is to transfer risk to third parties like Insurance, using Performance Warranty. But this incurs additional budget. 5)Risk Mitigation/contingency measures;condense the
possibility and/or collision of the risk by Simplifying the processes, develop Prototype and by additional inspection. Positive Risk can be increased by
1)Exploit:ensureso as to positive Risk ensue and formulategreatestutilize of the prospect provided.
2)Enhance:augment the possibility and/or collision of the risk
3)Share: The opportunity is shared with a third party to make obtain additional revenue.
International Journal of Innovative Technology and Exploring Engineering (IJITEE)
ISSN: 2278-3075, Volume-8 Issue-8, June, 2019
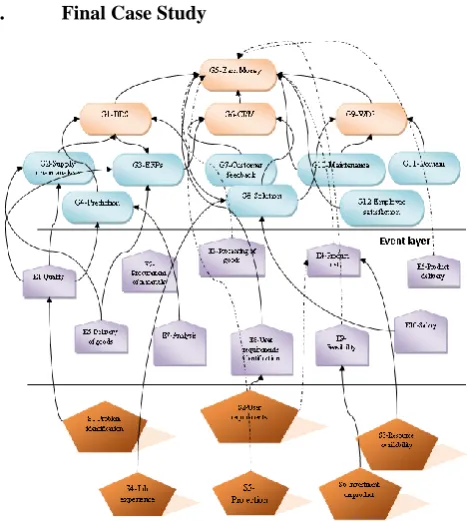
3. Final Case Study
Graph1.13 Final case study GR model
Final Case Study obtained at the end of Risk Analysis is shown in Graph1.13 and Final case study table is shown below
[image:5.595.52.286.73.334.2]Final Case Study Table obtained at the end of Risk Analysis
Table 1.7 Final Case Study
The candidate solutions obtained from Genetic Algorithm consists of Goals shown in above shown table. The events associated with these goals generate minimum risk as shown in probability collision matrix tool.
4. Important Finding
1) Risk is part of any software development.
2) Risk identification, analysis and management are the foundation of successful software product development. 3) If Risk multiplies overtime, then Risk analysis is not done correctly. When Risk analysis is correct, no of Risk reduces as process progresses
4) superior decision-making during a good considerate of risks and their probablecollision
5) Fever Surprises.
6) There is always innovative and efficient use of resources.
7) Reassuring stakeholders
Summary
The output obtained by genetic Algorithm is a set of candidate solutions. Each Candidate solution is a collection of goals .First the goals are identified in Goal Risk model .In the next step the refined Goals are obtained after passing the test conducted by Extraction Tree and Approximation Algorithm model. Then the output is subjected to Genetic Algorithm. Genetic algorithm has three steps whose intension is to provide optimum candidate solutions. These candidate solutions are used to calculate probability of occurrence and collision of risk. This is illustrated in Graph1.7and 1.8. When these two factors are multiplied then collision factor is obtained which is illustrated in graph1.9.
The calculation of risk factor is illustrated in table 1.5.The collision factor is not providing sufficient information for us to detect risk. So to have more visibility and clarity about risk we use probability collision matrix tool. This tool clearly exposes risk. This tool does not provide place for risk to hide. The tool is systematic and structured and it divides the risk into many types. They are
1.High possibility and High collision risk
2.Intermediate Probability and Intermediate collision risk. 1)3 Low probability and low collision risk.
It clearly highlight risk as shown in graph1.10.To analyze the risk we use 3x3 Matrix as shown in graph1.12.This matrix helps in decision making process.
REFERENCES
1. YudistiraAsnar, Paolo Giorgini, John Mylopoulos, “Goal-driven risk assessment in requirements engineering”, Requirement engineering, vol.16, pp: 101- 116, 2011.
2. Roy GG, Woodings TL (2000) A framework for risk analysis in software engineering. In: Proceedings of the seventh Asia-Pacific software engineering conference (APSEC ’00), IEEE Computer Society Press, Washington, DC, USA, p 441
3. Boehm BW (1991) Software risk management: principles and practices. IEEE Software, pp.32–41. doi:10.1109/52.62930
4. B. W. Boehm. Software Risk Management: Principles and Practices. IEEE Software, pp.32–41, 1991 Risk Analysis as part of the Requirements Engineering Process Yudistira Asnar Paolo Giorgini March 2007
5. Focusing on the Importance and the Role of Requirement Engineering
Mina Attarha and Nasser Modiri Atta
6. H.F. Hofmann and F. Lehner, “Requirements engineering as a success factor in software projects”, IEEE Software,vol 18, no 4, pp. 58-66, 2001.
7. B.A. Nuseibeh and S.M. Easterbrook, “Requirements engineering:
A roadmap”, Proc. of the 22nd Intl. Conf. on Software Enginnering (ICSE ’00), IEEE Computer Society Press, June 2000, pp. 35 – 46. 8. T. Hall, S. Beecham and A. Rainer, “Requirements problems in
twelve software companies: An empirical analysis”, IEEE Software, vol 149, no. 5, pp. 153-160, 2002.
9. M. Niazi and S. Shastry, “Role of requirements engineering in
software development process: An empirical study”, Proc. of the 7th
Intl. Multi Topic Conf. (INMIC2003), IEEE Computer Society Press, Dec 2003, pp. 402-407.
10. JacKyAng, Sook Bing Leong, Chin Fei Lee, UmiKalsomYusof,
“Requirement Engineering Techniques in Developing Expert Systems”, School of Computer Sciences UniversitiSains Malaysia, IEEE, symposium on computer science and informatics, 2011, pp.1-2 11. Lukas Pilat and Hermann Kaindl, “A Knowledge Management
Perspective of Requirements Engineering”, Institute of Computer Technology Vienna University of Technology Vienna, Austria, IEEE Conference: 19-21 May 2011, pp.1-12.
12. Mina Attarha and Nasser Modiri, “Focusing on the Importance and the Role of Requirement Engineering”, Interaction Sciences (ICIS),
2011 4th International
Conference, 16-18 Aug.
13. YudistiraAsnar, Paolo Giorgini, “Risk Analysis as part of the
Requirements Engineering Process”, Departmental Technical Report, 2007
14. GolnazElahi, Eric Yu, Nicola Zannone, “Security Risk Management by Qualitative Vulnerability Analysis”, Third International Workshop on Security Measurements and Metrics, pp: 1-10, 201116]
15. Shahzad Anwer, Naveed Ikram, ―Goal Oriented Requirement Engineering: A Critical Study of Techniques‖ XIII Asia pacific software engineering conference (APSEC'06) IEEE.
16. John Mylopoulos, key note talk on ―Goal-Oriented Requirements
Engineering, 14th IEEE Requirements Engineering Conference Minneapolis, September 15, 2006