International Journal of Innovative Technology and Exploring Engineering (IJITEE)
ISSN: 2278-3075, Volume-9 Issue-1S, November 2019
Abstract: The article considers the phenomenon of splitting the spectrum of the reflected signal from fiber-optic sensors (FOS) based on fiber Bragg gratings (FBG), due to which errors in calculating the strain values in diagnostic systems of the stress-strain state occur. The physical principles of splitting and their influence on the diagnostic system as a whole are considered. Various algorithms are proposed to solve the splitting problem, followed by their comparison. The optimal algorithm for processing the digitized optical spectra of signals from FOS was estimated using a mathematical model using real strain indicators from a bench experiment. FOS deformation data were obtained during an experiment on a bench for bending metal levers and were compared with strain gauges.
Keywords: FBG, Fiber-optic monitoring system, Diagnostics, Spectrum splitting, Processing algorithm
I. INTRODUCTION
Currently, strain gauges based on optical effects [1], which have several advantages over classical strain gauge sensors [2, 5], are widespread, among which:
lack of need for power supply of sensitive elements of sensors;
insensitivity to electromagnetic interference;
the ability to install the sensor at large distances from the polling device;
the ability to install multiple sensors on one optical line (on one optical fiber).
To measure the relative elongation of structural elements, it was proposed to use sensors (FOS) based on fiber Bragg gratings (FBG) deposited on an optical fiber [2]. The survey of such FOS is carried out using special optical
Revised Manuscript Received on November 12, 2019.
Leonid A. Delov: Scientific and Innovation Center “Institute for the Development of Research, Development and Technology Transfer”, Moscow.
Viktor M. Vikulov: Scientific and Innovation Center “Institute for the Development of Research, Development and Technology Transfer”, Moscow.
Mikhail Yu. Gavrikov: Scientific and Innovation Center “Institute for the
Development of Research, Development and Technology Transfer”, Moscow.
Nikolay L. Lvov4: Ph.D., Scientific and Innovation Center “Institute for
the Development of Research, Development and Technology Transfer”, Moscow.
Stanislav S. Khabarov: Scientific and Innovation Center “Institute for the
circuits that track changes in the spectrum of the optical signal from the sensors.
However, there is a drawback: due to optical properties, under certain conditions, the phenomenon of splitting of the spectrum of the optical signal occurs [3].
The article discusses data processing algorithms with fiber-optic sensors based on a mathematical model that are aimed at correcting errors associated with spectrum splitting.
II. FIBER OPTICS TRAIN MEASUREMENT SYSTEM
1.1Physical principle
Deformation can be measured using FBG, which is a periodic structure inside an optical fiber [1, pp. 5-8, 2]. The deforming effects on the controlled area are accompanied by a change in the spectrum, namely, the shift of the narrow-band peak of reflected light (Figure 1).
Figure 1. Spectrum of reflected light from FBG 1.1FOSBenchTest
To test the algorithms, we used the data obtained from the FOS bench tests described below.
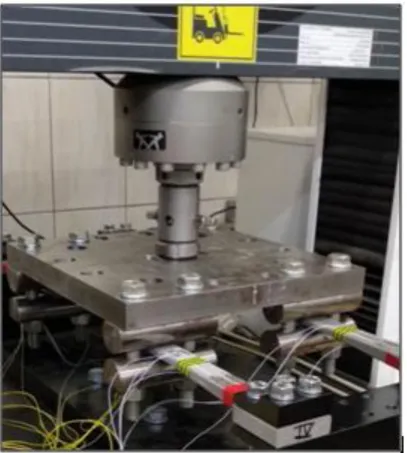
The test was a bend of metal levers, which are beams of equal deformation, glued to the surface of the FOS using Epo-Tek 353ND glue. As FOS sensitive elements, 3 mm long FBGs were used. The levers were installed in special equipment for the testing machine (see Figure 2), which allows you to set various deflections of the levers. Thetestswerecarriedoutundernormalconditions.
Research of Data Processing Algorithms from
Fiber Optic Sensors
Figure 2. Tests on a bench for bending metal levers The arrangement of the FOS on the surface of the metal levers is shown in Figure 3. On each lever, 4 FOS were glued, an electric strain gauge (ESG) was glued additionally next to the FOS on the lever surface, with which reference strain values were determined during testing.
Figure 3. Arrangement of FOS on levers 1. Data processing algorithms
1.1 Formulation of the problem
The data obtained during tests at the test bench are presented as “snapshots” of the spectrum of the optical signal reflected from the FOS. An example of a “snapshot” is shown in Figure 4.
Figure 4. Graphical representation of the received “snapshots” of the spectrum
The main task is to obtain information on the relative elongation (or shortening) of the controlled structural elements using data obtained from the FOS.
To calculate the required values, the formula [6] is used:
(1)
iselongation, %;
is the central wavelength (the part is in an unloaded state);
is the central wavelength determined by the spectrum of the signal reflected from the FBG during the tests;
is an additional correction factor found after calibration.
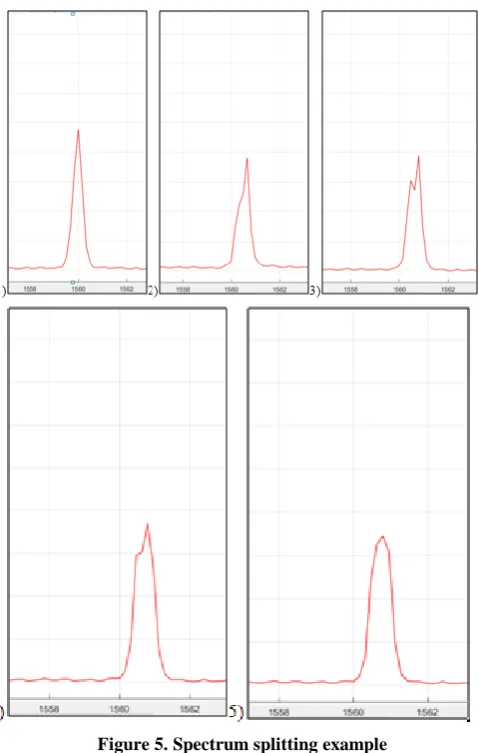
During testing, one or more peaks in the spectrum of the optical signal reflected from the FOS underwent splitting. The uneven bending of the FOS on the part, as well as the lateral compression of the FBG due to the compression of the adhesive layer cause this phenomenon.
Figure 5 shows the stages of peak cleavage:
1. The part is not loaded. The spectrum looks fine; processing such a frame is not difficult.
2. Detail stretch. The spectrum shifts to the right, i.e. in the direction of increasing the wavelength. A thickening on the left side of the peak can be seen.
3. This frame shows spectrum splitting. It occurs with further stretching of the part.
4. The experiment continues. The shape of the spectrum is approaching normal.
[image:2.595.47.291.373.650.2]International Journal of Innovative Technology and Exploring Engineering (IJITEE)
[image:3.595.47.287.47.424.2]ISSN: 2278-3075, Volume-9 Issue-1S, November 2019
Figure 5. Spectrum splitting example
This shows that the construction of such an algorithm for processing the spectral response, which would make it possible to determine the real value of the central wavelength in real time, leveling the effects of the unevenness of the spectrum during peak splitting during the loading of the part, is an important task.
1.1 Block diagram of the information processing algorithm
[image:3.595.303.549.53.310.2] [image:3.595.49.287.605.664.2]The block diagram of the algorithm is shown in Figure 6.
Figure 6. The block diagram of the algorithm
Table 1 provides a description of each block of the mathematical model algorithm.
Table 1. Description of Algorithm Blocks
1.2TrueMaximumAlgorithms
The spectral response processing algorithms are described below.
1. The method of least deviation from the previous value is based on the selection of one vertex from among many peaks (peak tracking method). This vertex should have the following property: its deviation from the previous value should be minimal in comparison with other peaks.
(2)
is true peak wavelength;
is an element of this set;
wavelength of the true peak of the previous measurement.
The main disadvantage of this algorithm is the need for continuous operation of the sensor. If the sensor turns off for a certain period of time, then the information about the last value before switching off can be very different from the first value after switching on.
2. The method of selecting a peak with maximum power. The basis of this method is the assumption that the true peak has the greatest power [4]. Such an algorithm works in the following sequence: searching for maxima in a certain area, comparing and choosing the largest one.
(3)
radiation intensity at a wavelength . It is likely that peaks resulting from splitting may exceed the true. In this case, it will be possible to observe the jumps and, as a consequence, the incorrect calculation of elongation.
The following
different assumption. The desired peak has a special property that can be used for calculations. For example, split peaks always have a shorter wavelength. In this case, it is advisable among the set of all maxima to search for one whose wavelength is higher. We will call such a peak right.
Selecting only the left or right peak: among the set corresponding to one sensor, the peak with the smallest or largest central wavelength is selected.
(4)
3. The combination of left and right (the far peak from an undeformed state). This method is an improvement on the previous one. If the vertices are shifted towards a lower wavelength relative to the first value, then the search is for the left peak, otherwise the right one, i.e. the farthest from the first value is selected.
(5)
unloaded wavelength.
1.3 Methods for calculating the exact value of the wavelength
1)Approximation by a function of the form .
The approximating function of the form Function maximum point (desired
wavelength)
2)Interpolation by Lagrange polynomial
(6)
The number of spectrum points used in the interpolation is 3, since the use of a larger number of points leads to the appearance of polynomials of degree 3 and higher, which is unacceptable in the conditions of this problem.
3)Splineinterpolation
This type of interpolation is an improvement on the previous view. In particular, it solves the problem of large divergence of the interpolating function for large powers.
4)Weightedaveragecalculation[4]
At the first stage of the algorithm execution, sections are identified where the radiation power exceeds a certain threshold. Further, in each such strip, the weighted average is considered.
(7)
One of the features of such an algorithm is that it does not require obtaining a mathematical function that describes the experimental data. The wavelength will be the output parameter of the general algorithm.
III. SIMULATION RESULTS
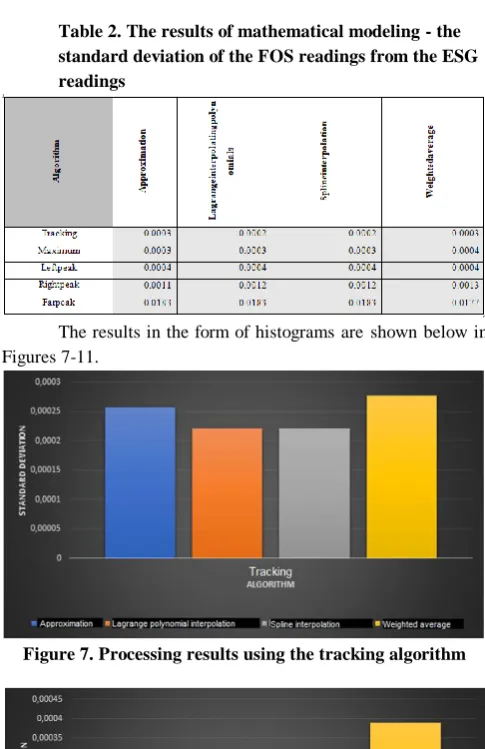
[image:4.595.304.547.210.585.2]To test the algorithms, the results of 7 experiments were processed, 4 sensors were tested in each of them. Table 2 below shows the results of data analysis; the standard deviation of the FOS readings from the ESG readings was calculated in the table for each method.
Table 2. The results of mathematical modeling - the standard deviation of the FOS readings from the ESG readings
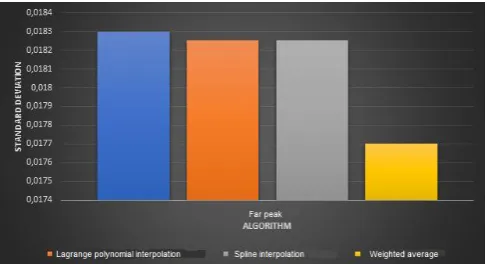
[image:4.595.308.546.227.369.2]The results in the form of histograms are shown below in Figures 7-11.
Figure 7. Processing results using the tracking algorithm
[image:4.595.306.549.553.685.2]International Journal of Innovative Technology and Exploring Engineering (IJITEE)
[image:5.595.45.291.51.184.2]ISSN: 2278-3075, Volume-9 Issue-1S, November 2019
[image:5.595.46.291.225.358.2]Figure 9. Processing results using the left peak search algorithm
Figure 10. Processing results using the right peak search algorithm
Figure 11. Processing results using the far peak search algorithm
Among all the investigated algorithms, the tracking algorithm for the peak of the reflected signal showed the highest accuracy indicators. However, in some situations, the use of this algorithm can lead to large errors in determining the central wavelength of the water. For example, if the measurement stopped for some reason and continued after some time, the tracked peak may be lost and the wavelength will not be determined correctly.
High accuracy indicators were obtained using the algorithm for finding the highest maximum, which confirms the theory that the true peak has the highest signal power in the spectrum. This method is superior to other algorithms in processing speed due to its simplicity.
When applying the algorithms for selecting the left or right peak, low accuracy indicators were obtained. The
combination of these methods (the farthest peak from the undeformed state) showed the worst result.
In terms of determining the central peak wavelength, the most promising methods turned out to be interpolation methods. Spline interpolation has fewer mathematical operations that require more computational resources, such as multiplication, which provides higher performance than interpolation by a Lagrange polynomial.
Based on the foregoing, we can conclude that the most suitable algorithm for processing data with FOS is the method of selecting the maximum in conjunction with spline interpolation.
IV. CONCLUSION
Based on the results of the experiments, the optimal algorithm for processing data with FBG was chosen, which allows determining the deformation of the object with the smallest error under the condition of possible splitting of the FBG peak, for example, with an inhomogeneous stress-strain roll in the zone of the sensitive element. Also, the selected algorithm provides higher performance, which is extremely important for continuous monitoring systems.
ACKNOWLEDGMENT
The authors are grateful to the Russian Ministry of Education and Science for co-financing a project to develop a system for detecting stall phenomena on the rotor blades of a helicopter during flight and monitoring the technical condition of the swashplate (agreement No. 14.579.21.0150, identification number RFMEFI57917X0150), within the framework of which results were obtained that were included in this article.
REFERENCES
1. LvovN. L., KhabarovS. S., GavrikovM. Yu., Creation of an integrated system for monitoring the technical condition of highly responsible helicopter units based on fiber optic technology.
2. Lele, U. P. E. N. D. R. A. (2016). Impact of Oil Prices on Revenue Growth and Profitability of Saudi Listed Companies in Non-Financial Sectors. International Journal of Management, Information Technology and Engineering, 4(6), 13-20.
3. GarmashV. B., EgorovF.A., KolomietsL.N., NeugodnikovA.P., PospelovV.I.. (2005) Opportunities, tasks and prospects of fiber-optic measuring systems in modern instrumentation. Special issue "PHOTON-EXPRESS" - SCIENCE, No. 6,
4. Yadav, S., & Siddartha, S. (2018). Fraud Detection of Credit Card by Using HMM Model. IMPACT: International Journal of Research in Engineering & Technology, 6(1).
5. NovikovaV.A., VargelS.V., DmitrievA.A., ZalesskayaYu.K., IdrisovR.F. . (2018)Investigation of the spectral characteristics of fiber Bragg gratings with a phase shift under the influence of pressure directed perpendicular to the axis of the optical fiber. Scientific and Technical Journal of Information Technologies, Mechanics and Optics. Vol. 18. No. 5. P. 751–757. doi: 10.17586 / 2226-1494-2018-18-5-751-757 6. Taufik, A., Okamoto, S., & Lee, J. H. (2015). Multi-Rotor Drone to Fly
[image:5.595.47.291.394.526.2]7. LambertiA., VanlanduitS., PauwB., BerghmansF.. (2014) Invention of Fiber Bragg Grating Spectrum Degradation on the Performance of Sensor Interrogation Algorithms .Sensors, 14, 24258-24277; doi: 10.3390 / s141224258
8. Shah, M. K., Bhatt, C. B., & Dave, J. B. (2016). NIR spectroscopy: Technology ready for food industries applications. Int. J. Appl. Nat. Sci. IJANS, 5(1), 129-138.
9. ShishkinV.V., GranovI.V., ShelembaI.S. (2016) Domestic experience in the production and use of fiber-optic sensors. Applied Photonics, Vol.3, No. 1,
10. Ravi, S., David, A., & Imaduddin, M. (2018). Controlling & Calibrating Vehicle-Related Issues Using RFID Technology. International Journal of Mechanical and Production Engineering Research and Development, 8(2), 1125-1132.
11. Fiber Bragg Gratings: Fundamentals and Applications in Telecommunications and Sensing. Andreas Othonos, Kyriacos Kalli. USA:(1999)Artech House Print on Demand, 433 p.