International Journal of Innovative Technology and Exploring Engineering (IJITEE) ISSN: 2278-3075, Volume-8 Issue-9, July, 2019
Abstract: Anomaly detection has vital role in data preprocessing and also in the mining of outstanding points for marketing, network sensors, fraud detection, intrusion detection, stock market analysis. Recent studies have been found to concentrate more on outlier detection for real time datasets. Anomaly detection study is at present focuses on the expansion of innovative machine learning methods and on enhancing the computation time. Sentiment mining is the process to discover how people feel about a particular topic. Though many anomaly detection techniques have been proposed, it is also notable that the research focus lacks a comparative performance evaluation in sentiment mining datasets. In this study, three popular unsupervised anomaly detection algorithms such as density based, statistical based and cluster based anomaly detection methods are evaluated on movie review sentiment mining dataset. This paper will set a base for anomaly detection methods in sentiment mining research. The results show that density based (LOF) anomaly detection method suits best for the movie review sentiment dataset.
Index Terms: Anomaly, Density, Distance, Cluster, Sentiment.
I. INTRODUCTION
In data mining, the identification of “abnormal” instances in the dataset is an emerging field incredible interest. Detection of abnormal instances is generally said to be as “anomaly detection” [6]. Anomalies are not the same as the normal instances with reference to their attributes and they are unusual in the dataset with respect to regular instances [1, 2, 5]. Anomaly detection methods are currently utilized in numerous areas and regularly improve traditional anomaly detection methods. Various anomaly detection methods are developed that rely on the accessibility of class type in the dataset. Supervised anomaly detection [5] needs completely labeled training data. Semi supervised anomaly detection methods need a training dataset that is free from anomalies. In this semi supervised cases, those data that vary from normal instances in the test data are counted to predict anomalies [10]. Unsupervised anomaly detection methods utilize the inherent data information so as to predict instances differing from the greater part of the data [3,12,13-17]. In these unsupervised anomaly detection techniques, anomaly scores are obtained as output. The anomalies are ranked based on the anomaly score and the top
anomalies are reported. In this study, the anomaly scores are used as output and can be used for performance evaluation. Anomaly and clustering detection are two strongly associated
Revised Manuscript Received on July 07, 2019.
K.SUDHA, Research Scholar, Department of Computer and Information Sciences, Annamalai University
N.SUGUNA, Assistant Professor, Department of Computer Science and Engineering, Annamalai University
techniques [5]. Clustering focuses on the majority of clusters in a data set and groups the instances consequently, while anomaly detection aims to confine the uncommon instances that diverge significantly from the mass of instances [3,11,18,19]. Social media platform enables its users to share their opinions on any subject. It has an extensive count of users distributed throughout the world and results in massive volume of social media data [7,8,11]. Analyzing such social media data to detect abnormal instances in a timely scale is a valuable topic of research [2,6,10]. In this study, a comparative evaluation of various anomaly detection algorithms such as density based, statistical based and cluster based anomaly detection methods is presented. This work proved the applicability and strength of the anomaly detection method through sentiment analysis on movie review sentiment data. The results exhibit the capability of the anomaly detection method and provide meaningful insights into this research area. This paper is arranged as follows: Section 2 presents a literature related to this work. The methods employed for anomaly detection is introduced in Section 3. Section 4 details the evaluation analysis carried out for anomaly elimination. The results and discussion are given in Section 5. Section 6 provides the conclusion of the paper.
II. LITERATURE REVIEW
A huge amount of research in machine learning on anomaly detection has been carried out, and this research has been completed, and this exploration has increased generous consideration because of the understanding that anomaly instances can be predicted from huge datasets by machine learning [2,4,5,9,8]. Varun Chandola et al (2009) research the use of Recurrent Neural Networks (RNN) for viably distinguishing inconsistencies in flight data. They demonstrated to be significant in evaluating the role of RNNs in recognizing various feature combinations and shown to be worthy in evaluating the performance of RNNs in finding the least anomalies in the dataset [10]. Victoria J. Hodge (2004) portrays the anomaly detection method that can distinguish different network attacks.
Their focal point is to recognize those attacks utilizing supervised learning method such as back propagation neural network (BPN) technique and compose whole data safe [11]. Pavel Kachurka et al., (2011)
analysed the issue of
unsupervised anomaly
Evaluation of Unsupervised Anomaly
Detection Methods in Sentiment Mining
detection technique to recognize unforeseen action of network tools based on the investigation of mutual dependencies of the independent slices of network action. The resultant is a combination of fuzzy inference systems that depict the reliance of the chose factor from the set of additional factors [8]. Hesam Izakian et al., (2013) in their work they demonstrated that a huge piece of the accomplishments in anomaly detection because of the novel achieved in distance measurements and dimensionality reduction of time series data. In any case, tending to the matter of time arrangement grouping through ordinary methodology has not explained the issue totally, particularly if the class labels of time series are indistinct [6]. Sophisticated algorithms don't just mark perceptions as anomaly, yet relegate scores to perceptions, speaking to degrees or probabilities of outlierness. Some famous models depend on the distance between objects [3-8], or based on the variance of angles between object vectors [2,6,7,9] or on the density of the neighborhood of an object [13,19], or on other principles of outlierness in various domains [12,13]. Wang et al., [20] proposed an outlier detection method based on clustering. An innovative universal anomaly factor, local anomaly factor and an proficient anomaly detection algorithm are developed. This technique is can be utilized with the conventional distance-based anomaly detection methods. However, it is also concluded to use their method as a compliment with other methods of outlier detection.
Christy et al.,[7] explored two techniques based on distance and cluster for anomaly detection. Through the dataset cleaning and clustering based on similarity measures, anomalies can be eliminated on the prime attribute subset rather than on the full dataset. However, it is proposed to utilize this strategy as a compliment with different strategies for anomaly identification. There numerous sorts of information in outlier detection analysis such as binary variables, nominal and ordinal. Contingent upon the kind of use , the type of data also varies. Numerous data mining algorithms attempt to limit the impact of outliers or eliminate them all together. Be that as it may, this could result in the loss of significant hidden information since one person’s noise could be someone else's signal [4]. One of the fundamental issues of data mining alongside classification, prediction, clustering, and association rules mining issue is that of the outlier detection [1–3]. In recent years, the idea of Meta anomaly detection methods was also applied to detect anomalies to construct a consistent classification model. Anomaly detection issues were addressed in many real world applications, but not much addressed in sentiment classification domain. This motivates us to focus on the need for a comparative analysis by bringing collectively unique techniques on sentiment dataset. The objectives of this study are listed below,
• To identify outliers in the sentiment mining datasets. • To analyze the effectiveness of various unsupervised outlier detection methods on noisy datasets.
• To evaluate the effect of anomaly removal in sentiment classification.
III. ANOMALY DETECTION METHODS
In this research, a comparison of anomaly detection method is carried out. The methods employed are density based LOF anomaly detection method, cluster based K-Means anomaly detection method and statistical based histogram anomaly detection method. The results obtained for the anomaly detection methods are compared for movie review sentiment dataset. Outlier detection is a elementary concern in data mining, exclusively it has been used to identify and take away anomalous objects from data. Most information sets contain anomalies that have abnormally vast or little values when contrasted with others in the information set. The methodology adopted in this work is as follows. The outlier detection and classification methods are involved in the research design.
• Movie review sentiment dataset is used for analysis.
• For movie review dataset, various outlier detection techniques are employed.
• After detecting the outliers, The performance of anomaly detection methods are evaluated using AUC.
• For the identified optimum anomaly detection method, the top 10 outliers are removed.
• The effect of outlier detection is analyzed by employing various classification methods such as SVM, KNN and NB.
• The evaluation results obtained after classification of outlier removed movie review dataset is compared with the classification results of before anomaly removal dataset to identify effect of anomaly elimination.
A. Density based Anomaly detection
The density based Local Outlier Factor (LOF) technique is an unsupervised anomaly detection algorithm which registers the deviation of local density of available data instance with reference to its neighbors. This depends on the anomaly sample with liberally smaller density than that of neighbors[4]. The check of neighbors utilized is ordinarily picked one more greater than the minimal number of objects a gathering must have,, with the objective that different objects can be local anomalies in respect to this group. Those objects that are smaller than the greatest number of neighbor objects can conceivably be local anomalies. The steps to be followed in LOF outlier detection are as follows (Fig 1),
B. Cluster based Anomaly detection
The cluster based K-Means anomaly detection uses clustering so as to deicide the intense zones in dataset and finds density calculation for every cluster a while later.
K-means is frequently applied to exploit the small
computational complexity. The K-means anomaly detection method complexity is linear
International Journal of Innovative Technology and Exploring Engineering (IJITEE) ISSN: 2278-3075, Volume-8 Issue-9, July, 2019
i.Calculate all the distance between each two data points. ii.Find out the distance between data point(o) and its kth
neighbour for all data points.
iii.Calculate the Nk(o) k-distance neighbour hood of o for all data points.
iv.Calculate all the Local Reachability Density of o. v.Calculate all the LOFk(o).
vi.Sort all the LOFk(o).
complexity. In the k-means based outlier
Figure 1. LOF Anomaly detection
detection technique the data are portioned in to k groups by relegating them to the nearest cluster centers. The distance between each object and its cluster center is calculated again, and choose those with farthest distances as outliers. Later, it employs a heuristic to group the resultant clusters into huge and undersized clusters. In the end, an anomaly value is calculated using the distance of every instance to its cluster centre multiplied by the data instances belonging to its cluster [1,6]. In case of clusters of smaller size, the distance to the closest large cluster is used. The steps to be followed in k-Means anomaly detection method are as shown in Fig 2.
Figure 2. K-Means anomaly detection
C. STATISTICAL BASED ANOMALY DETECTION
The histogram-based outlier score is a straightforward mathematical anomaly detection technique presumptuous sovereignty of the attributes. The logic behind is, that for every feature in the dataset, a histogram is constructed. For every indival feature, an univariate histogram is constructed first. At that point, for each occurrence in the dataset, the inverse height of the bins representing the density estimation of all features is multiplied. The basic idea is same as that of Naive Bayes algorithm in classification, in which all independent feature probabilities are multiplied [10,11].
IV. EVALUATION
[image:3.595.312.553.48.221.2]The presented anomaly detection algorithm are available as part of the anomaly detection extension of RapidMiner. For a quantitative evaluation of various anomaly detection methods the movie review sentiment data is used. The work flow used is as shown in Fig 3.. The movie review sentiment dataset is used in this study on unsupervised anomaly detection algorithms. To our knowledge, this is the benchmark dataset for sentiment mining. An experimental investigation of various outlier detection algorithms such as LOF, CBOF and HBOF is done.
Figure 3. Work Flow of Anomaly detection methods
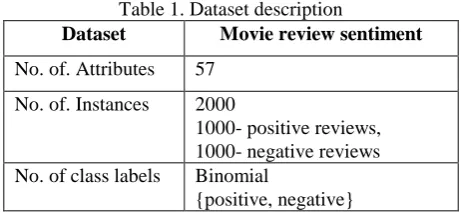
They are often used as baselines in literature, because they have relatively good performance [5]. Table 1 describes the dataset used in this analysis. The movie review dataset has movie reviews and sentiment labels. This dataset set is used as benchmark for sentiment classification.
V. OUTLIER DETECTION PERFORMANCE
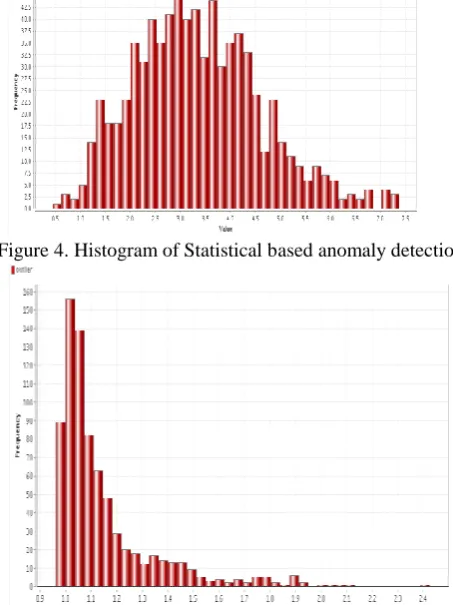
[image:3.595.311.542.484.590.2]For Each anomaly detection method used, the outlier scores are computed. The outlier scores are plotted as histogram for visual evaluation of data points. A histogram is a plot representation of outlier scores against frequency [2,3]. The histogram for the anomaly detection methods used are as shown in Fig 4- Fig 5.In these figs, it is noted that there are few data points with maximum outlier score which are placed considerably farthest from the main group of data points. The frequency of such data points is also minimal. Those data points are most likely to be identified as anomalies.
Table 1. Dataset description
Dataset Movie review sentiment No. of. Attributes 57
No. of. Instances 2000
1000- positive reviews, 1000- negative reviews No. of class labels Binomial
{positive, negative}
In Fig. 4 of Histogram based anomaly detection for the movie review dataset, the maximum number of instances are scattered in the region of anomaly score values of 0.5 to 7.4 for instances. The peak occurs at anomaly score value of 2.9.
There is no gap observable till outlier score less than 7.0, but scores for outliers are more and more increasing with the gap after outlier score of 7.0.
It means, as the inter point distance is increased, more and more data points are
i.Create a subset D1 of dataset D
ii.On this subset of data D1 perform a k-means cluster
(with k=3) to form clusters.
iii.Apply heuristic to classify clusters into large and small clusters.
iv.Calculate the distance between the objects and cluster
becoming neighbors till the outlier score reaches 7.0 and afterward, the density starts decreasing. Fig 5 shows the histogram of outlier scores obtained for the density based anomaly detection method on movie review dataset. Fig. 5 of movie review dataset shows that the anomaly scores are dispersed between 0.9 and 2.2. In Fig. 5, the maximum numbers of instances are spread in the region of anomaly score of around 1.0- 1.5. for class instances. In Fig. 6, Cluster based anomaly detection for the movie review dataset, the maximum number of instances are scattered in the region of anomaly score values of 10,000 to 1,10,000 for instances. The peak occurs at anomaly score value of 50,000. There is no gap observable till outlier score less than 1,20,000, but scores for outliers are more and more increasing with the gap after outlier score of 1,20,000.Area under the curve (AUC) is defined as the integral part of the Receiver Operating Characteristics (ROC), which is used, as a detection performance measure. Area under the curve is the likelihood that an anomaly detection algorithm will assign a randomly chosen normal instance a lower score than a randomly chosen anomalous instance [4]. Hence, AUC is a just right performance measure for this comparison study on anomaly detection. Table 2 shows the AUC results for three different outlier detection algorithms. It can be seen, that LOF performs quite well compared to other algorithms on the movie review data set.
[image:4.595.309.555.57.144.2]Figure 4. Histogram of Statistical based anomaly detection
[image:4.595.53.280.394.697.2]Figure 5. Histogram of Density based Anomaly detection
Table 2. AUC of Anomaly detection methods
From Table 2, It is observed that density based anomaly detection method (LOF) had a relatively high performance of
0.924, The cluster based anomaly detection based ranks next to density based method with AUC value of 0.887, while statistical based anomaly detection method (HBAD) performed the least among the methods compared with AUC of 0.846. The reason for lower AUC might be due to a strong bias toward the majority class.
VI. CLASSIFICATION EVALUATION
Among the anomaly detection methods it is noticed that density based LOF strategy demonstrates to be the best for sentiment mining movie review dataset based on Table 2. Along these lines, considering the Density based LOF, anomaly score is determined, it tends to be note that not many data instances have most maximum outlier score of more prominent than 1.5. Barely few occurrences having top 10 outlier score can be distinguished as anomalies from these highest anomaly score instances. Machine learning techniques provide different methods for assessing the effectiveness of its algorithms. After applying the outlier detection methods on sentiment dataset, the top ten outliers are removed. As a result of elimination, the number of instances in the sentiment dataset is condensed to 1990 from 2000. Then the performance is measured by classifier. . To analyze the performance of different anomaly detection methods, three distinct classifiers such as Support Vector Machine (SVM), Naïve Bayes classifier (NB) and k-Nearest Neighbor classifier (k-NN) are utilized. These classifiers are engaged much in the outlier detection literature. SVM, a powerful classifier from statistical learning theory is employed. The development of Support Vector Machines for data mining tasks has its involvement for outlier detection as well. The research population dealing with outlier detection showed a great deal of attention in using SVM-based methods[4,16]. KNN has been used in pattern recognition and statistical estimation. KNN algorithm is simple to understand and a very versatile algorithm. KNN is a non parametric lazy learning algorithm, in the sense that it does not make any assumptions on the underlying data distribution used in many outlier detection applications[ 17,20].The Naïve Bayesian classification assumes an underlying probabilistic model and thus allows capturing uncertainty about the model in a principled way by determining probabilities of the outcomes[ 2,5,9 ].
Evaluation measures analyses different
characteristics of machine learning algorithms. Various evaluation metrics are used for validating the performance of classification methods with
outlier detection. Most of the evaluation metrics for a
Anomaly detection methods AUC
Cluster based Anomaly detection 0.887
Density based anomaly detection 0.924
International Journal of Innovative Technology and Exploring Engineering (IJITEE) ISSN: 2278-3075, Volume-8 Issue-9, July, 2019
classification task are based on the ‘confusion matrix.
Table.3. Classification Performance (Before anomaly elimination)
Table.4. Classification Performance measure (After anomaly elimination)
The common metrics used are accuracy, precision, recall, and f-score. The performance measures of the classifiers employing original sentiment movie review dataset is tabulated as shown in table.3.The classification results obtained for all classifiers before and after top ten anomalies elimination are shown in Table 3 and table 4 for movie review dataset. The results show that the accuracy is comparatively larger for all three classifiers after anomaly elimination. Similar observation is noted for precision, recall, and f-score. From table 4, it is observed that the performance of classifiers varies depending on the outlier detection methods employed. Among the different classification methods employed SVM has greater accuracy of 85.2%. The performance degrades for KNN and NB classifiers compared to that of SVM. On the other hand, the classifiers engaged in this study have its classification accuracy enhanced when compared to the accuracy obtained before outlier detection. This provides an evidence for the effect of outlier elimination. In general, the results show that the SVM performs better for density based LOF outlier detection method for movie review dataset. It is evident from the results in table 4 that the precision values for all classifiers employed are high in the presence of outliers. In general, the performance of classifiers will rise
after removing outliers. For all classifiers, the precision value obtained for dataset before removing outliers is lesser when compared to the precision value obtained after removing outliers. A better precision value of 86.8% is obtained for the SVM classifier. From table 4, the recall values for all three classifiers are more before removing the outliers. The recall performance will increase after removing outliers. For all classifiers, the recall value obtained for dataset before removing outliers is lesser when compared to the recall value obtained after removing outliers. A better recall value of 83.9% is obtained for the SVM classifier. From table 4, the F-Score values for all three classifiers are more before removing the outliers. The F-Score performance will increase after removing outliers. For all classifiers, the recall value obtained for dataset before removing outliers is lesser when compared to the recall value obtained after removing outliers. A better f-score value of 84.2% is obtained for the SVM classifier.
It is summarized based on the results obtained as follows. Noise present in the original dataset reduces the performance of classifier. As noise level increases, the performance degrades gradually. For individual outlier detection methods, density based method performs in terms of AUC. Among classifiers in LOF anomaly detection methods, SVM performed better. The accuracy of classifiers degrades gradually. This is observed by comparing tables 4 with table 3. Similar observation is done for precision, recall and f-score measures.
VII. CONCLUSION
Anomaly detection methods employed in this study is an unsupervised problem, where usual performance measures based on accuracy, precision or recall do not easily apply. Studying the extraordinary behavior of outliers, helps uncover the valuable knowledge hidden behind them thus aiding the decision makers to improve the sentiment mining services. In this study, three popular unsupervised anomaly detection algorithms such as LOF, CBOF, HBOD are evaluated on movie review sentiment mining dataset. The results are presented as ranks based on each method’s anomaly measure. It is concluded that the density based anomaly detection method, performs well on movie review sentiment dataset. In future, it is proposed to analyze how anomaly detection and elimination can support sentiment classification and hence improve sentiment mining. The future work will also focuses on identifying the optimum percentage of data to be eliminated as anomalies after detection, so as to perform sentiment classification effectively on movie review data.
REFERENCES
1. Aggarwal, C. C. (2015). Outlier analysis. In Data mining (pp. 237-263). Springer, Cham.
2. Agrawal, S., & Agrawal, J. (2015). Survey on anomaly detection using data mining techniques. Procedia Computer Science, 60, 708-713. 3. Ahmad, S., Lavin, A., Purdy, S., & Agha, Z. (2017). Unsupervised
real-time anomaly detection for streaming data. Neurocomputing, 262, 134-147.
4. Ahmed, M., Mahmood, A. N., & Hu, J. (2016). A survey of network anomaly detection techniques. Journal of
PERFORMANC
E MEASURE
PERFORMANCE (IN %)
SVM K-NN NB
ACCURACY 83.4 75.2 79.4
PRECISION 85.1 72.6 79.6
RECALL 82.2 71.1 78.1
F-SCORE 83.5 72.1 77.4
PERFORMANC
E MEASURE
PERFORMANCE (IN %)
SVM K-NN NB
ACCURACY 85.2 76.8 80.3
PRECISION 86.8 74.1 79.9
RECALL 83.9 74.5 81.1
Network and Computer Applications, 60, 19-31.
5. Ben-Gal, I. (2005). Outlier detection. In Data mining and knowledge discovery handbook (pp. 131-146). Springer, Boston, MA.
6. Chakraborty, D., Narayanan, V., & Ghosh, A. (2019). Integration of deep feature extraction and ensemble learning for outlier detection. Pattern Recognition, 89, 161-171.
7. Christy, A., Gandhi, G. M., & Vaithyasubramanian, S. (2015). Cluster based outlier detection algorithm for healthcare data. Procedia Computer Science, 50, 209-215.
8. Collins, J., Howe, K., & Nachman, B. (2018). Anomaly detection for resonant new physics with machine learning. Physical review letters, 121(24), 241803.
9. Goldstein, M., & Uchida, S. (2016). A comparative evaluation of unsupervised anomaly detection algorithms for multivariate data. PloS one, 11(4), e0152173.
10. Hautamaki, V., Karkkainen, I., & Franti, P. (2004, August). Outlier detection using k-nearest neighbour graph. In Proceedings of the 17th International Conference on Pattern Recognition, 2004. ICPR 2004. (Vol. 3, pp. 430-433). IEEE.
11. Hesam Izakian and Witold Pedrycz, Anomaly Detection in Time Series Data using a Fuzzy C-Means Clustering, IEEE (2013): 1513-1518. 12. Janakiram, D., Reddy, V. A., & Kumar, A. P. (2006, January). Outlier
detection in wireless sensor networks using Bayesian belief networks. In 2006 1st International Conference on Communication Systems Software & Middleware (pp. 1-6). IEEE.
13. Jordaan, E. M., & Smits, G. F. (2004, July). Robust outlier detection using SVM regression. In IEEE International Joint Conference on Neural Networks (Vol. 3, pp. 2017-2022).
14. Kannan, K. S., & Raj, S. S. (2019). Outlier Labeling Methods for Medical Data. In Logistics, Supply Chain and Financial Predictive Analytics (pp. 67-75). Springer, Singapore.
15. Meroni, M., Fasbender, D., Rembold, F., Atzberger, C., & Klisch, A. (2019). Near real-time vegetation anomaly detection with MODIS NDVI: Timeliness vs. accuracy and effect of anomaly computation options. Remote sensing of environment, 221, 508-521.
16. Pavel Kachurka and Vladimir Golovko, Neural Network Approach to Real-Time Network Intrusion Detection and Recognition, The 6th IEEE International Conference on Intelligent Data Acquisition and Advanced Computing Systems: Technology and Applications 15-17 (2011): 393-397.
17. Sabokrou, M., Fayyaz, M., Fathy, M., Moayed, Z., & Klette, R. (2018). Deep-anomaly: Fully convolutional neural network for fast anomaly detection in crowded scenes. Computer Vision and Image Understanding, 172, 88-97.
18. Varun Chandola, Deepthi Cheboli, and Vipin Kumar, Detecting Anomalies in a Time Series Database, ACM, Technical Report (2009). 19. Victoria J. Hodge & Jim Austin, A Survey of Outlier Detection
Methodologies, Artificial Intelligence Review 22 (2004): 85–126. 20. Wang, X., Wang, X. L., Ma, Y., & Wilkes, D. M. (2015). A fast