Performance of a pulse extraction column
R. M. CohenIowa State College G. H. Beyer Iowa State College
Follow this and additional works at:http://lib.dr.iastate.edu/ameslab_iscreports Part of theChemistry Commons
This Report is brought to you for free and open access by the Ames Laboratory at Iowa State University Digital Repository. It has been accepted for inclusion in Ames Laboratory ISC Technical Reports by an authorized administrator of Iowa State University Digital Repository. For more information, please [email protected].
Recommended Citation
Abstract
A continuous countercurrent liquid-liquid extraction column containing perforated plates was operated with a pulsed liquid phase. The effects of operating variables upon extraction efficiency and column capacity were investigated. A 1-in. Pyrex tube, 20-in. long, served as the column in which an assembly of 10 perforated plates were supported at 2-in. intervals. Each plate contained fifty-three, 0.040-in. perforations, representing 9 per cent of the plate area. Cyclic pulsations were imparted to the liquid in the column through a tee in the stream entering at the bottom by means of a cam-driven bellows pulsator and a diaphragm pump with checks removed. The function of the pulsations was to produce counterflow or both phases through the plate perforations and to provide a high degree of dispersion and turbulence by the continuous formation of fresh interfacial surface.
Keywords Ames Laboratory
Disciplines Chemistry
I 'I
'
l
\
UNITED STATES ATOMIC ENERGY COMMISSION
ISC-294
PERFORMANCE OF A PULSE EXTRACTION COLUMN
By
R. M. Cohen G. H. Beyer
December 1952
Ames Laboratory
In the interest of economy, this report has been reproduced direct from copy as submitted to the
Technical Information Service.
Work performed under Contract No. W-7405-eng-82.
ISC-294
ABSTRACT. . . .
INTRODUCTION. .
INVESTIGATION • .
• 0 0 0 • 0 • 0 0 • 0 • 0 0 0 0 0 0 0 • 0 • 0 • 0 • 0 0 • 0 • 0 • 0 • 0 0 • 0 • 0 • • 0 0 0 0 0 • Description of Apparatus . • . • . . • • . . • •
Operating Procedure . • • . • . . • . . • • Calculation of Efficiency~of Transfer • • • • • Performance Data. · . • o o • • o • • • • • •
.
.
• • • 0 0 • 0 • DISCUSSION. 0 • • 0 • 0 • • • 0 0 0 0Effects of Operating variables and Plate
Characteris-1
1
4 4 10
11
13 26
tics 0 0 0 e 0 0 0 0 • • • 0 0 • 0 • 0 • • • 0 0 0 • 0 • 26 Application of Performance Data to Other Systems. • • • 35 Advantages and Limitations of the Pulse Column • • • o o 37 Discussion of Errors • • o • o • • • • o • • • • • • 38
CONCLUSIONS • • • 0 • 0 0 • 0 •
.
.
. .
.
0 • 0 • • 0 0 LITERATURE CITED •• • 0 •.
. .
• • •.
.
.
0 • 0 • ~ ACKNOWLEDGMENTS • •.
.
.
. . . .
0 0 • 0 0 0 0 • • 0 0iii
39
41
PERFORMANCE. OF A PULSE EXTRACTION COLUMN1
R. M. Cohen and G. H. Beyer
ABSTRACT
A continuous countercurrent liquid-liquid extraction
column containing perforated plates was operated with a
pulsed liquid phase. The effects of operating variables
upon extrac~ion efficiency and column capacity were
in-vest.igated. A l-in. Pyrex tube$ 20-in. long.~~ served aa
the column in which an assembly of 10 perforated platea
were supported at 2-in. inte:rvalso Each plate contained
fifty-three.~~ 0.040-in. perforations.~~ representi~g 9 per
cent of the plate area. Cyc·lic pulsations were irrrparted
to the liquid in the colwnn through a tee in the stream
entering at the bottom by means of a cam-driven bellows
pulsator and a diaphragm pump with checks f'emoved • . The
function of the pulsations was to produce counterflow or
both phases through the plate perforations and to provide
a high degree of dispersion and turbulence by the
con-tinuous formation of fresh interfacial surface.
Extraction runs were made using the system:
water-boric acid-isoamyl alcohol, where the direction of boric
acid transfer was from the alcohol to the water phase.
Efficiencies were expressed in terms of the height of a
transfer unit and the height equivalent to a theoretical
stage, where the number of theoretical stages were
calcu-lated by the McCabe-Thiele method. Over-all heights of a
transfer unit as low as 5.7 inches were obtained with
water as the continuous phase. Capacities as high as
660 gal./sq ft./hr. were achieved. In general, pulse
column ope:r·ation was found to be most efficient at high
alcoh.ol flow rates and moderate to high pulse frequencies
(35 to 72 cycles/min.)
INTRODUCTION
continuous liquid-liquid extraction processes have
been used industrially to great advantage as a means of
chemical separation and purification where operations such
as distillation or adsorptiot:l are impract'ic~l.
1
This report is based on a Masterfs thesis by R. M. Cohen, submitted December.~~ 1952.
. Equipment-desian
tor
eontlnuou• eountere\irretitextrac-t!~rn ia l1.rgel7 based upon various methods tor obtaining·a
f!n~glhl interfacial area between the two contacting 11quidso
lfe~ter efficiency or improved mass transfer is usuallJ
1\~lnieved by increasing the degree or mixing or the two
~!hl&eeao In epra7 eolumnep thil is brou&ht about by-
dis-~·~•in& one liquid as droplets in the second liquid9 while
p~~ked columns increase the t~rbulence- ot flow and the til•
•~t~ce area by utilizing packingo Mixer-settler equip•ent t~kee &dv~ntage
or
stage=wise contact in alternate mixing · · &llll~ eettling unit's"' whereas perforated~plate towers are ~~ .)ee~~ntially vertical mixer=settlers in which successive dii!!peraion and coalescence is accompliehed by perforated
~1~t~~o In the latter"' ~s well as in· spray» packed9 and b~ftle~type columns"' low stage efficiencies are encountered
~~e to the poor mixing resulting from counterflow or the
tooo phS\ses past each other by virtue or their densi.ty
difference aloneo
Recently, vario~s mechanically-powered devices having
lll}i,&flM!lr' trrnx-oughpu.ts and efficiencies than conventional
ex-tlt>ilet:ilon columns have been builto The Podbielniak
cen-t•lt~sml contactor utilizes a high-speed rotor containing
~ perforated spir&l ribbon tor mixing and separating the
t¥o liqu1ds9 while the Scheibel column consists or alternate
iiliSJ.-'Killllg amd coalescing zones in a vertical tower fitted witb_
il ~e1l'il·trlll· rotating shaf't on which agitators are mounted in
~~e mixing sectionso The presence or moving mechanical
~~~ts in these and other powered~contactors9 poses repair,
le&k~ge9 and servicing problems which are particularly
~bjectionable it radioactive or highly corrosive solutions
. -.ll~e to ·be processed o · ·
In a patent by van Dijck (13) 9 a perforated-plate
column is described in which the entire plate assembly is
wibrated vertically to increase agitation between the two
ilfj~Discible liquids" The same patent suggests tl{e use of
fued plates and a p~lsed liquid phase. This latter
modlfi-~~tion hms been designated as· a "pulse column" (2) o Several ~tomic=energy installations have built and operated such p~~to~ated=plate pul~e columns9 but the details have not
~!!en published (294 9698»109 11) o Feick and Anders.on (5)
studied the performance or a packed extraction column in
which weciprocal motion ~ imparted to both liquids by
. . ~~e ot an eccentric-d~iven diaphragm at the base or the
~@l~m~o Si•11&r wo~k with & packed p~lse column has been
ps~to~ed by V~~ Be~g an~ Wiegandt (14) at cornell Universltyo
r'
.·
3
Their results indicate that the column height required to
effect a given extraction is reduced by a factor of five,
-in .some instanees9 under pulsating conditions. No
perfor-mance data for perforated-plate pulse columns were found
in the unclassified literature.
The plate perforations in a pulse column are small
enough so that counterflow of the two phases will not occur
because of gravity alone, but an additional force must be
applied to overcome the resistance to flow. A cyclic
pulse, usually imparted to the light-liquid stream
enter-ing the bottom of the column, produces alternate surges
of liquid in both directions. Thus countercurrent flow
occurs because of density difference in the region between
successive plates and because of mechanical pulsing through
the plate perforations.
Between pulsations at low pulse frequencies the two
phases separate into two distinct layers in each section
between adjacent plates. On the upsurge of the pulse
cycle the lighter phase beneath each plate is dispersed into the heavier phase above each plate. The droplets rise through this layer and coalesce beneath the ·plate
above. On the downs urge t.he heavy phase is dispersed downwards through the lighter layer in a similar fashion.
Since fresh surface is created with each pulse, mass
trans-fer rates will be greater than for a similar packed or
spray column. At higher pulse frequencies recoalescence
between pulses, is incomplete, and th~ degree of dispersion and turbulence-are both increased, resulting in higher extraction efficiencies. Greater throughputs are also
obtainable since the reduction in droplet size (due to
more frequent plate impacts) inhibits dispersed phase
coalescence, thus preventing column flooding. By proper
combinations of pulse displacement and frequency, a great
variation in flow behavior may be achieved. Changes in
these variables may be likened to changes in the packing characteristics for packed columns.
The choice of operating and design variables for carrying out a particular extraction in a new apparatus such as a pulse column would ordinarily necessitate a
tedious trial-and-error procedure. The major purpose of
this investigation was to study the operation and
alcohol. The performance data thus obtained may then be used as a basis in predicting optimum operating conditions for other systems having different physical properties by suitable-interpretation of the effects of interfacial tensions, density differences and viscosities.
Because of encouraging results with pulse columns in connection with extraction work in the atomic-energy pro-gram (2,4,6,11), the construction and investigation of a laboratory-scale pulse column was undertaken. Its poten-tial commercial applications as a highly efficient and ' versatile extractor having high throughput capacities and combining simpl~city of operation with a minimum of maintenance make this performance study all the more desirable.
INVESTIGATION
Description of Apparatus
Physical description
A 20-inch section of l-inch Pyrex pipe with two 4-inch flanged end sections, 1 1/2 inches in diameter, was assembled and fitted with Saran end plates containing standard 1/4-in~h
Saran threaded fittings. A central 1/8-inch Lucoflex rod, ·
·supporting 10 Lucoflex plates separated at 2-inch intervals by means of
5
mm. glass tubing, was inserted in the 20-inch section of the column. The l-inch diameter Lucoflex discs were punched from 1 mm. sheet and drilled with fifty-three 0.040 inch~erforations per plate. This corresponded to approximately 9 per cent free area. All gaskets were of Teflon or Polythene, and all tubing was either glass, Tygon, Saran or Pluorothene. All metal parts including valveswere of stainless steel.
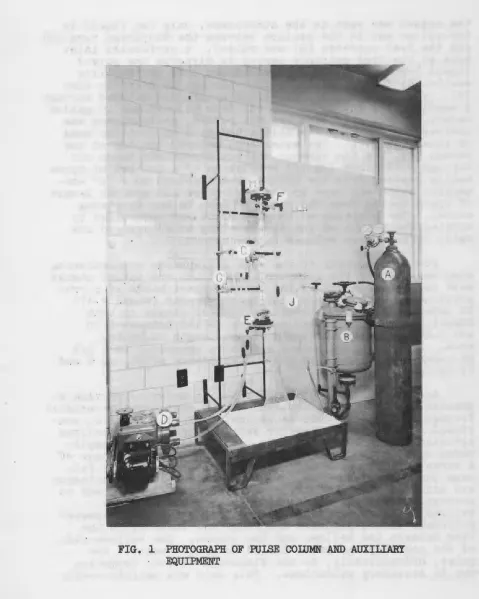
The pulse column and auxiliary equipment are shown in Figure 1. A nitrogen cylinder (A) was used to pressurize
<..
5
I
[image:10.564.33.512.77.676.2]the column was -open to the atmosphere, only the liquid in the column and in the section between the diaphragm pump (D)
and the feed entrance (E) was pulsed. A perforated inlet
tube at the feed entrance served to disperse the pulsed liquido The alcohol raffinate stream left the settling section at the top of the column through an overflow tube
(F). The heavy liquid9 distilled water, was metered through
a needle valve and rotameter (G) from an overhead 15-gallon
carboyo Since this line was not pulsed, pressurizing was
unnecessary and flow was maintained by a hydrostatic head
of about ten feeto The water then entered the top of the
column (H), and the aqueous extract stream was taken off
through a flexible leg (J) consisting of a section of Tygon
tubing leading from the bottom of the column to a "Y"
eon-n~~tion which was open to the atmosphere and another length
of Tygon tubing from the open "Y" down to the receiving
vesselo The position of the interface was controlled by varying the height of the flexible leg which changed the
ratio of the phase volumes in the columno
-For the majority of the runs a diaphragm proportioning
pump was used as -the pulsator . The inlet and outlet checks
were removed from one of the Saran reagent· heads of a Pro- .... _
portioneers Duplex Heavy-Duty Chem-0-Feeder (Model 2-47)
in order to produce alternate surges of liquid in both
directionso Pulse amplitud~s were varied between dolO
and 0.60 inches by turning a stroke-length adjusting
knob. A 3-step cone pulley and belt9 connected to a 1/4
HP •induction motor9 gave pulse frequencies of 179 35.5 and
72 cycles per minute.
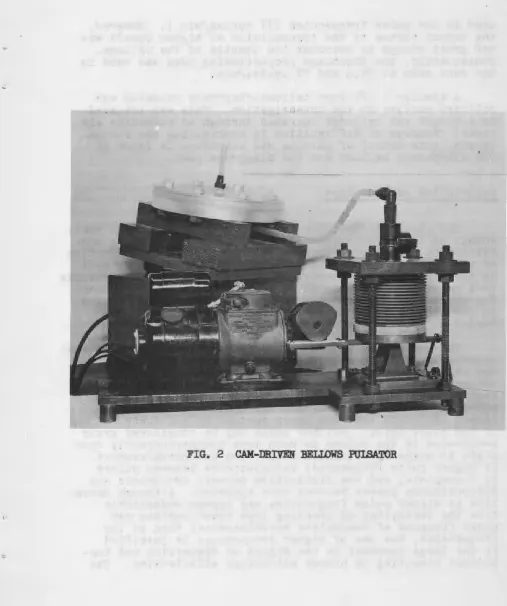
Another pulsator unit was built in order to provide a greater range in pulse amplitude and a continuously-variable
frequency control. This mechanism9 shown in Figure 2,
con-sisted of a 4.7-inch diameter Fulton-Sylphon brass bellows
actuated by a motor-driven cam via a lever. Pulse
ampli-tudes were varied between 0.10 and 2.00 inches by means of a screw control which determined the position of the
ful-crum under the lever. A Graham variable-speed transmission
was utilized to select the desired frequency. In order to
prevent contact of the column liquids with the brass
bellows9 a diaphragm assembly containing a 7-inch diameter
Polythene-lined9 Neoprene diaphragm was inserted in the
line between the bellows and the columno The bellows-side
of the as·sembly was water-filled so as to transmit the
pulsea hydraulically9 to the diaphragm without dampening
7
[image:12.566.12.519.81.687.2]used at low pulse frequencies (17 cycles/mino). However, the output torque of the transmission at higher speeds was not great enough to overcome the inertia of the bellowao
Consequently~ the diaphragm proportioning pump was used in the runs made at 35.,5 and 72 cycles/mino
A similar 1 1/2-inch bellows-diaphragm pulsator was utilized earlier in the investigation. This was actuated by a midget air cylinder operated through an automatic ail• timero Because of difficulties in controlling the stroke
length~ this method of pulsing was abandoned in favor of the cam-driven bellows arid the diaphragm pump.
Description of operation
The plate perforations in a pulse column are made ·small enough so that countercurrent flow under non-pulsating con-ditions is prevented. This resistance to flow is a function of the plate-wetting characteristics of the. system as well as the perforation diameter. Flow through such holes results in a pressure drop which is greater than the pressure drop due to density differenceo Thus~ imparting a cyclic pulse
.to the liquids provides the "extra-gravitational" force fieeded to pr_pduce countercurrent flowo ·
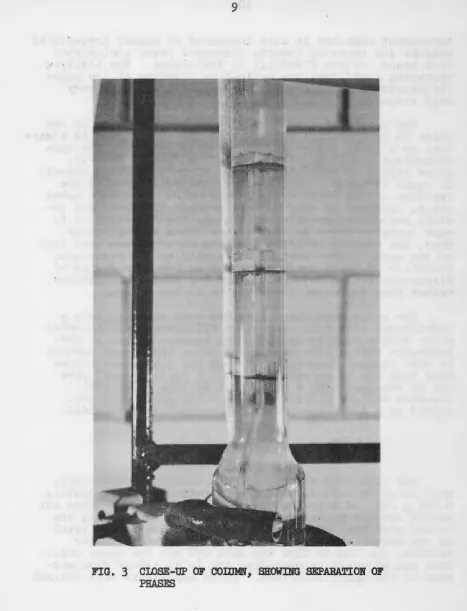
The two phases separate into two distinct layers between pulsations, in each section between adjacent plates, when :
the column is operated at low pulse rrequencieso This con-dition is shown in Figure
3.
The lighter phase beneath .each plate is dispersed into the heavier phase above the plate on the upward pulse,·, and the heavier pha.se is dis-persed downwards into the lower section on'the downsurge of the pulse cycle. Neither phase may be considered truly continuous in the column as both move countercurrently from plate to plate by alternate dispersion and recoalescenceo At higher pulse frequencies recoalescence between pulses is incomplete, and the distinction between continuous and discontinuous phases becqmes more apparent. Although opera-tion at higher pulse frequencies may appear undesirable from the standpoint of creating less fresh surface per pulse (because of incomplete recoalescence) than at low frequencies, the use of higher frequencies is justified by the large increase in the degree of dispersion and tur-bulence resulting in higher extraction efficiencies. Th~
9
[image:14.564.57.524.60.671.2]throughput capacity is also increased at higher frequencies
·because the tendency towards dispersed phase coalescence
(and hence» column flooding) is diminished. The limiting operating conditions are defined by flooding at low pulse frequencies and amplitudes, and emulsification at very high frequencieso
..
The length of time during which a upit volume of one phase is in dispersed contact with the other phase is always less in a pulse column than in a spray column of the same
dimensions ·Operating at• the same flow rates o Clearly»
pulse column contact time (during which extraction occurs)
is equal to spray column contac.t time multiplied by the
fraction of the pulse cycle during which dispersion takes placeo Defined in this manner, contact time does not in-clude periods of recoalescence since the contribution to mass transfer under quiescent conditions is negligibleo Thusa the greater efficiency of the pulse column over that of the spray column must be attributed to the continuous formation of fresh surface as well as the high degree of
dispersion and turbulence through the pl~te perforations.~~
rather than increased contact time in the columno
The pulse wave shape also has been shown to have a
significant effect on extraction efficienty
(
6).
·~A sharppulse with a relatively long time between pulses is more
desirable than a sine wave cycle since the former ·results
in more violent dispersion through_the plates and allows
more time for recoalescenceo Such a "semi-square" wave may be obtained with a cam-driven bellows or an
air-actuated bellows pulsator, whereas _the pulse wave
gen-erated by a diaphragm pump is approximately sinusoidalo
Operating Procedure
The feed tank was filled with isoamyl alcohol-boric acid solution made up to a concentration of approximately Oo008 go/mlo of boric acido The distilled water valve was
opened and the pulsator was started in order to fill the
column with the continuous phase. When the liquid level
in the column was near the top of -the l-inch diameter
sectionp the liquid flow was shut off and the pulse ampli- .
tude was adjusted by measuring the total linear
ll
similarly at the completion of each runo The feed tank was
then pressurized to 10 psigo with nitrogen, and both flow
rates were regulated by stainless steel needle valves.
Calibrated rotameters were used for metering both liquids,
while the flow rates were more accurately adjusted during
the early part ~f each run by timing measured volumes of
the effluent streams. Since the distilled water solvent
was previousli saturated with pure isoamyl alcohol and
the alcohol feed was saturated with water, no significant
volume changes took place during extract1ono The interface
was maintained at a constant level by adjusting the height
of the flexible aqueous take-off lego Steady-state
opera-tion was achieved after 4-5 changeovers of the continuous
phaseo samples were collected from both effluent streams
3 hours after start-up to insure the attainment of
equili-brium conditions~ For the low-flow fluid (water), a 3-hour
run permitted
5-6
changeovers at 10 cc./mine, and 'l2-14changeovers at 25 cc ./min o Both flows were then shut otf,
and the pulsator disconnected while the column was drained'~
into a graduated cylinder in order to measure the ratio of '
phase volumes in the column. The liquid in the end sections
was included in the holdup inventory$ and as such the
values obtained were not true holdup ratios. However, since
the phase volumes in the end sections remained constant
throughout the runs; the measured volume ratios were
propor-tional to the actual holdup ratios and served to indicate
the trends in this variable with changes in the other
para-meters.
Calculation of Efficiency of Transfer
Performance data for design purposes may be expressed
1n terms of H.E.T.So (height equivalent to a theoretical
stage) or HTU (height of a transfer unit). While H.E.T.S.
varies considerably with the properties of the system in
an unpredictable manner, HTU data are correlated somewhat
better since this method is inherently more consistent
with the actual extraction pictureo However, the
practica-bility of HTU correlational procedures is limited becau~e
of the lack of experimental data on individual film
trans-fer coefficients and film HTU's. Thus, although the H.E.T.S.
concept is fundamentally unsound when applied to operations
where the concentration changes differentially with height,
it is used extensively in practice for designing continuous
extraction equipment since H.E.T.S. values are more easily
computed than HTU's. 2
AnalJsis for boric acid was by the procedure recommended by
: ... ·~ ...
In this investigation values of H.E.T.S.' W,ere used to express extraction efficiencies. Over-all HTU's were also calculated for comparative purposes. Since the equilibrium line was shown to be strai~ht (1), and ~he operatin& line was assuwed to be straight when usin& alcohol aaturated with water and water saturated with alcohol, an analytical solUtion of the McCabe-Thiele method was used in order to give more accurate results than the usual graphical pro-cedure (1,9,12). The following equations were used for the. special case of solute-free solvent with the operating
line above the equilibrium line (extraction from alcohol into water) :
' .
n = log
Ll
. - .Y2 - 1'
n
-_ (Y2 _. l)
Y1
log (~) .
In the above equations,
c:
-
l ) J /'
{1) where a ; mo
(2) where a
=
mn - number of theoretical stages
a
=
slope of operating line determined by analysis... · m
=
slope · of equilibrium line=
0.2909y
=
concentration of boric acid in alcohol phase The subscripts 1 and 2 refer to the lower andhigher concentrations, respectively.
H.E.T.S. values were calculated by dividing the nu~ber·
of theoretica 1 stages thus . obtained into the column height. -. Over-all HTU's were computed directly from values of H.E.T.S.
by the following relations whic.h are valid only for straight operating and equilibrium lines:
(!!- 1) (HoE.T.S.) (HTU) OG : _a _ _ _ _ _ _ _
ln (~)
13
a
(HTu) 0L
=
Cm)
(HTu) 0a(HTU)oa - (HTU)oL
=
H.E.T.S.(4) where a j m
(5) where a
=
mIn the above equations the subscripts OG and OL refer to over-all values based on the dispersed and_ continuous _ .
phases, respect_ively. .. 1,,;:,~· -''"· .. , ·;:..•
Performance Data
Experimental runs were planned in such a way that the effect of each varia~le on column performance was investi-gated separately in a series of runs in which the other variables were held constant. In order to cover the entire range of column operation adequately, the method of attack was to study each variable between its minimum and maximum allowable values for representative low, moderate and high values of the other parameters. Several preliminary runs were made to study flooding behavior under various flow
and· pulse conditions so that operating limits might be approximated beforehand and extraction runs planned accordinglyo
Effect of flow rates
Extraction as well as holdup data for these ruris are pre-sented in -Table 1 where holdup ratios are defined as: ·
volume of discontinuous phase/volume of continuous phase ··
in the column. The results of·two similar series of runs made at 72 cycles/min .. and Oo20 inches amplitude, :.ror con-stant continuous phase flow rates of 10 and 25 ceo/min., are presented in Table 2.
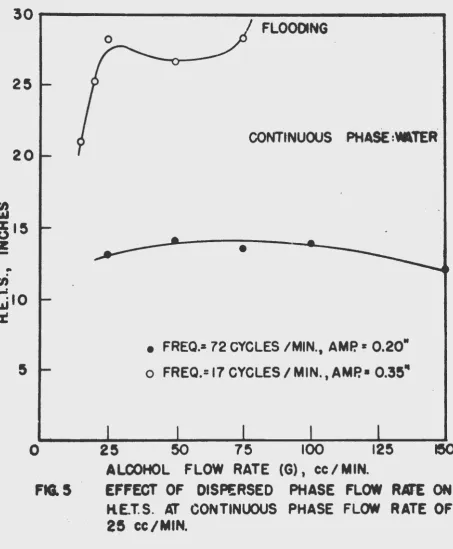
Figures 4 and 5 show the effect of dispersed phase
flow rate on HoEoToS. at both high and low pulse frequencies
for continuous phase flow rates of 10 and 25 cc./min.,
respectively. These data were also correlated in terms of
over-all HTU's, which were plotted in Figure
6
as (HTU)oaversus the ratio of the slope of the equilibrium line to
that of the operating line, on logarithmic coordinates.
The slope of the operating line was determined by analysis. Since the slope of the equilibrium line is constant
(m
=
0.2909), Figure 6 essentially indicates the dependenceof (HTU)oa upon the flow ratio G/L raised to some power.
Pulse conditions, as a parameter in such a plot, are entirely analogous to the "packing characteristics" para-meter frequently used in similar correlations of packed
column performance data. It is to be noted in Figure 6
that, whereas the data at the high pulse frequency appear
to be a unique exponential function of G/L regardless of
individual flow rates, the data at the lower pulse
fre-quency seem to group into separate lines, each
represent-ing a constant continuous phase flow rate. At 72 cycles/min.
and 0.20 inches amplitude, the data are best expressed by
the equation:
(6)
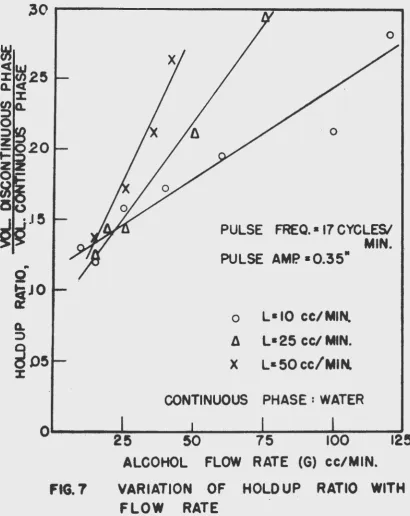
Figure 7 shows the effect of flow rates on volumetric
holdup ratio. An increase in either flow rate increases
the dispersed phase holdup, and flooding is approached rapidly with an increase in dispersed phase flow rate at
high continuous phase flow rates. Thus for L
=
50 cc./min.flooding occurred at G
=
45 cc./min.$ while for L=
10 cc./min.values of G as hi.gh as 125 cc./min were obtained at incipient
flooding. For the low pulse frequency used (17 cycles/min •. ) incipient flooding took place at a holdup ratio of approxi-mately 0.309 regardless of flow rates or ratioso At higher frequencies, clear-strea,m operation was observed with holdup
ratios as high as 0.50, allowing greater throughput.
Table 1. Effect of Flow Rates on Extraction and Holdttp at a Low Pulse Frequency .
Pulse Frequency
=
17 cycles/min. Pulse Amplitude • 0.35 inches Continuous Phase: WaterRun Water Alcohol Holdup H.E.T.S. (HTU) (HTU) Material ·
No. rate, L rate, G ratio (inches) OG OL balance
(cc./min.) (cc./minJ') (inches) (inches) (~ error)
19 10 10 0.130 21.2 12.2 41.8 + 0.06
16 10 15 0.120 21.6 14.9 33.1 ... 2.04
5 10 25 0.158 20.8 17.8 24.5 ... 0.05
6 10 40 0.173 21.5 22.9 20.2 - 1.29
~
10 60 0.196 19.4 24.9 15.4 - 3.03 H Cll10 100 0.214 15.1 26.9 9.3· - 0.24 ... ( )
\J'1 I
20 10 120 0.283 16.2 32.6 9.2 ... 0.43 1\)
\0
..J::"
17 25 15 0.123 21.0 9.8 58.4 - 3.72
18 25 20 0.143 25.3 13.4 56.6 ... 1.52
9 25 25 0.143 28.3 17.1 51.9 ... 8.54 .
10 25 50 0.212 26.7 21.4 34.0 ... :4.32
11 25 75 0.294 28.4 26.1 31.0 - 1.57
22 50 15 0.136 154. 59.2 628. ... 6.39
13 50 25 0.173 35.1 16.1 100. ... 7.69
23 50 35 0.216 27.9 14.0 68.5 +"0.21
21 50 4:2.2 0.262 32.9 17.7 72.0 ... 0.09 .
"
~· t. . .. -'1
[image:20.566.79.698.70.462.2]Pulee Frequency IB 72 cycles/mino
Pulse Amplitude Iii Oo20 inches
continuous Phase~ water
Run Water Alcohol Holdup H.E.T.So (HTU) (HTU) Material
NOo rate.P L rate, G ratio (inches) OG OL balance
( CC o/mino) (ceo/min.) (inches,) (inches) (~ error)
36 10 25 ' Ool94 13o0 11.7 14.5 + 7o20
25
10 50 Oo219 13.8 17o5 11.1 1' 3.6339 10 75 Oo318 11o8 18.6 7o9 + 2.61 H
38 10 100 0.311 10.5 19.4 6o3 + 1o58 til
41 10 150 0.338 11ol 26.1 5o7 + 0.97 0\ 1--' Q I
I\)
33 25 25 0.228 13.1 7.8 24.9 + 6.58 \.0 ~
34 25 50 0.263 14o1 11.3 17.9 + 6.26
35 25 75 0.297 13.5 13.1 14.0 + 4.46
37 25 100 0.234 14.0 15.7 12.6 ... 3.99
[image:21.564.48.692.59.509.2]17
-
~5 ---~ CONTINUOUS PHASE: WArE...
uS
..,.:
.
20
15
FLOODING
I I
• FREQ. =72 CYCLES/MIN.,AMP.=Q20"
o
FREQ.=17
CYCLES /MIN., AMP.= 0.35"25 50 75 100 125
ALCOHOL FLOW RATE (G), cc/MIN.
150
FIG.4 EFFECT OF DISPERSED PHASE FLOW RATE ON H.E.T.S. AT CONTINUOUS PHASE FLOW RATE
-30
t---....
2S
20
en
.
""
XIS (.)z
..
.
(/)
.-:,0
"'
%
FLOODING
CONTINUOUS PHAsE
:\tATER
.
•
•
• FREQ.= 72 CYCLES /MIN., AMP.= 0.20"
o
FREQ.= 17 CYCLES I MIN., AMP. • 0.3S ..0
.
2S
50
75
100
125
ALCOHOL FLOW
RATE
(G),
cc/MIN.
FIG. 5
EFFECT
OFDISPERSED PHASE
FLOW
·
RATE
ON
H.E.T.S.
Ia
CONTINUOUS PHASE
FLOWRATE
OF [image:23.560.47.501.76.626.2]-
..
Z2
-
:::)
t-:r
-ISC-294
19
o
L•IO
CC/MIN.} •6 L- 25Cc;'MIN. FREQ.= 17 CYCLES/MIN,AMP.•0.35
• L•lOCC/MIN.
L
•
A L•25ee!MN. fFREQ.=72 CYCLES IMIN.,AMP.•O.~O
CONTINUOUS PHASE: WATER
.2
.4
.6
.8
1.0
2
4
6
FLOW RATE RATIO,
<D(G->
FIG.6 £FFECT OF FLOW RATE RATIO ON
OVER-ALL
30~---~~---..
g
~JO
· o
PULSE FREQ. • 17 CYCLES/ MIN. PULSE AMP. •0.35"
o
L•IO cc/MIN.Jl L•25 cc/ MIN.
X L• 50 cc/MIN.
CONTINUOUS PHASE : WATER
o ...
--~----~~---~--~~---1 [image:25.562.70.481.124.641.2]25
50
75
100125
FIG. 7
ALCOHOL
FLOW
RATE (G) cc/MIN.VARIATION OF HOLD UP RATIO . WITH
21
A ~erie~ or ~~rna w~s •ade ~t c©natant continuoua and di~~~l?&tiJa.UlOU!B t'lCN r11tes Of 10 and 50 CCo/•iri.«>o re.pect1Yeq9
to dlet~2?'Jii!i'jje the e:rtect
or
p\lll!ie qplitude on HoBoTGsG ·and hc10112!P ~lllti~-s at tlr>equelllciel! of 35o5 and 72 C7lce•/•1no._at
c!atdliQI'e tabulated in Table3o
PT>o• Pigure 80 it 18Be~n tb&t ext~&ction eftieieney is g~eatly i~rO'Yed b7'an
.ine~e~se in either pulse amplitude o~ treqQanCJ«> At 72 ~JCl~~/mi~oo w~l~es of HoEoToSo d~opped ~apidlj witb
an
-in.c~~~~!le in pmlse amplitude b~tween
Oo
l5
andOo30
inobaa.~~~ ~~1 furthe~ incweaBe had ~elatiwelJ little ettect oa
HoEoToSo Clear~st~e~m ope~&tion •t a•p1itudea sreater t-.D
0645 i@~l'nes wms impoasi~ beea1l.llae or exce~aive
e•ulai.f'i-~1.\tioli'R
or
the two pba!leB·., At35o5
c:rclea/•ino the operatiq le'lmge WI!.S peate~ D arrnd 1LE 0 T oS 0 Villll!eS decreased unit01"1117.with incweasing amplitude~ at ~ mo~e gr..._l rate than at
72 cycles/mino
Bec~~se of the manner in which extraction was depend~
~'lilt o~ both fl"eqtllency 11nd amplitude.., it was decided that
rrn<!i\t:he_w or. the two ~ho~ldl bw con11idered .independentl1~
but
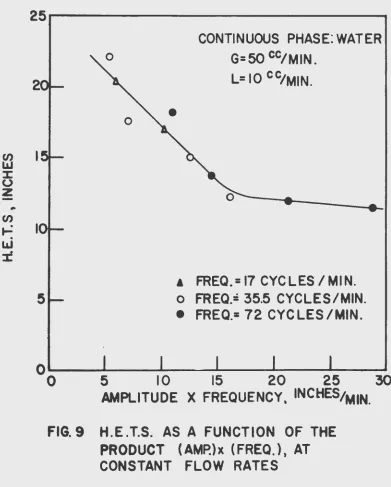
nolitJhif)ll" tllil~t both !ihould be)groupedl into one variableo Thus . it l6'1lfi COll"A!!idexoed instructive to plot HoE 0 T oS 0 data tor
condition~ of. con~tant flow rates as a function
or
the pro~dUlct (amplitude) x (frequency), !ince this qu.antitJ is · .1
diro~msiona.lly propOl"'tional to what might be considered
21p'i.i1lae velocit;t91 or 91pu.lse energy~ . .., Figll!X"e 9 is such a
plot0 F~~plr'esent:ll.:ng the p:li:"evious data of Table 3 supplemented
'Vfith §.dd1"1onail F>UUe e.t 17 CJCles/mino The points tall
~loong ~ · eitrngle; cr~n"ve with little ~cilttexo>ing0 indicating
the w~lidity of this co~relatifOlg deviceo
i
A ae~ies of holdup meaeull"ements was made at constant
flO\W ~i.\'tee { G g 50 ec o/Wii'llo and L g 25 cc o/ min o) in order
tc d@tewmin~ the effect ·ot pulee amplitude at low
tre-q~e~cieao The ~e~ultsa shown ~~phicallJ in Pigure 10~
incicllte that a wcritical" .minimum amplitude exists tor ~~1 giwe~ f~equencJ &nd tlow rate0 which is' the limiting
w~lu® to~ clea~~st~e&m ope~atio~o Sm2ller amplitudes .~~~ult i~ flooding» while large~ values have relatively
little effect on di~pe~JSed phase holdup other than a
gr.a:
Alcohol FlowRate ~ 50 cco/mino Water Flow Rate
=
10 cc./min. Continuous Phase~ waterRun Pulse Pulse Holdup H.E.T.S. (HTU) (HTU) Material
NOo frequency amplitude ratio (inches) OG OL balance
(eye 1es/m1n.) (inches) (inches) (inches) (~ error)
24 12 0.15 0.165 18.4 22.8 15.0 .1). 1~82
25 72 0 .. 20 0.219 13.8 17.4 llo1 .a. 3.63
29 72 0~30 0.381 12.,0 14.7 9.9 ~ 0~75
31 72 Oo40 0.450 -11.5 13o6 9.8 - 2.25 H
CJl
1\) Q
27 35.5 0.15 0.152 22.2 27.2 18~3 ~ 0.77 1\) I
1\)
26 35.;-5 0.20 0.151 17~7 21.6 14.7 .a. 0~39 \D
28 35.5 Oo35 0.222 15.1 18~8 12~3 ~ 2~38 ~
30 35o5 0.45 0.298 12.3 14.9 10.3 - 0.26
[image:27.560.63.677.43.546.2]Cl)
"'
%u
z
-p
en
~w
.
%
23
~~---~
2
Gz50 ec/MIN.
L =10 CCJMIN.
15
5
e
FREQ • 72 CYCLES /MIN .o
FREQ=
3~.5 CYCLES /MIN.CONTINUOUS PHASE : WATER
0---._---~---~--~
0
.10
.20
. 30
PULSE AMPLITUDE , INCHES
.
FIG.
8 EFFECT OF PULSE AMPLITUDE ONH.E.T. S. AT MODERATE AND
HIGH
PULSE FREQUENCIES.
CJ)
LLJ
:I: (..)
z
-CJ)
...=
.
LLJ
:z:
25~---2
•
0CONTINUOUS PHASE: WATER G=50 cc/MIN.
L= 10 cc/MIN.
A FREQ.=I7 CYCLES/MIN.
5 o FREQ.: 35.5 CYCLES/MIN.
• FREQ.= 72 CYCLES /MIN.
o~--~----~----~----~----~--~
0 5 I 0 15 20 25 30
[image:29.566.78.469.110.597.2]AMPLITUDE X FREQUENCY, INCHES/MIN.
FIG. 9 H.E .T.S. AS A FUNCTION OF THE
t.O
....
~
~
f
U)a
::>g
~....
~
~....
0~
U) Z5.:.J ..J 40
0 0
>>
..
2
~
~
.20
..J 0 :a: 0
0
25CONTINUOUS PHASE : WATER
'
0'
'
0 0
'
'
\
\
'~
,z
,a
\
,o
\
,it
~
(!)'
z
' \
c
\
\ 0
\
' 0
\it
\
\
\ \
'
'e..~
=i:
x
FREQ. = 5 CYCLES I MIN .o
FREQ.=
10 CYCLES/MIN.e
FREQ.=
17 CYCLES/MIN..25
.50G • SOcc /MIN. L•25cc/MIN.
I
I
XI
I
I
I~ I~18
10I~
I
I II
I I\
"'
-<>
•
~
:
.75 PULSE AMPLITUDE , INCHES
FIG .10 EFFECT OF PULSE AMPLITUDE ON tD..DUP RATIO AND COLUMN FLOODING AT LOW PULSE FREQUENCIES
frequency was decreased, again indicating·that the product
of the two is related to the pulse energy. Interpreted ·
·in this light, the minimum pulse energy (or force) is that
whi.ch is required to overcome the resistance to flow through
the plate perforations, resulting in countercurrent flow of the two phases.
At moderate and high frequencies holdup ratios were
found to increase with pulse amplitudeso This increase ·.
was more rapid at 72 cycles/mino than at 35o5 cycles/mino,
as can be seen in Figure 11. At small pulse amplitudes
(OolO - Oo20 inches) and a frequency of 72 cycles/mino,
the dispersed phase was broken up into a very fine emulsion in the lower section of the column, resulting in excessive
light-liquid carryover in the heavy-liquid effluent stream.
When operating at high pulse amplitudes and the same
fre-quency, the column appeared to be filled with a coarse ·
emulsion, and flooding occurred in both effluent streamso Thus, the clear-stream operating range at 72 cycles/mino was from 0.20 - Oo45 inches, while at lower frequencies the range was greatero
Effect of continuous phase
..
The continuous phase in the pulse column was determined by the interface location which was governed by the height
of the aqueous takeoff leg. With water as the continuous
phase the interface was lQcated at the top of the column, whereas a bottom interface was obtained with the alcohol phase continuous. Table 4 presents the results of two pairs of runs made under identical conditions, operating
with top and bottom interfaces, respectivelyo This qualitative comparison shows that transfer is more efficient 1n the pulse
column for the system water-boric acid-isoamyl alcohol, when
the water phase is continuouso
DISCUSSION
Effects of Operating Variables and Plate Characteristics
Flow rates
In Figures 4 and
5,
it is seen that values of HoEoToS...
2
....
c
0::
Q..
~
27
.50~---~
.30
CONTINUOUS PHASE: WATER
G= 50 cc/MIN. L•
10
cc/ MIN .• FREQ •
72
CYCLES /MIN.o
FREQ• 35.5 CYCLES /MIN.0~
0
·
---~~---~
.10
.20
. 30
PULSE
AMPLITUDE,
tNCHESFIG.II EFFECT OF PULSE AMPLITUDE ON HOLD UP RATIO AT MODERATE AN) HIGH PULSE FREQU£NCIES
-z
z
o .
- . , J
~~
ex:~
!z
(!) 0.005o~E.~r..''t-lG
L&J ..
zW
ocn
ocl:1:
OQ..
o..J
c~o
0:1:
_o
cx:o
WATER IN I 0 G/ML
~
~'\)."'
ALCOHOL OUT• 0.00351 GJML.
~\)\\)~
~~ 0~---~---~---~---~~---~
0 0.005 0.010 0.015 0.020 0.025a:>RC ACID
CONCENTRATION IN AQUEOUS PHASE,G./ML.
FIG.
12 GRAPHICAL SOLUTION FOR NUMBER OF STAGES IN SAMPLEEXTRACTION RUN
H f!5
1\) I
CP 1\)
\0
[image:33.560.52.680.85.453.2]+=-(
29
Table 4o Effect of Continuous Phase on Extraction
Alcohol Flow Rate
=
75 Cco/mino Water Flow Rate=
25 CCo/min.Run. Pulse Pulse Continuous
No. ' frequency · amplitude phase
(cycles/mino) (inches)
35 72 0.20 water
42-B 72 0.20 Alcohol
45 35o5 Oo45 water
43-B 35o5 0.45 Alcohol
H.E.T.S. Material (inches) balance
(~ error)
13~5 - 4.46
29.0 - 0.88
9~9' - lo31
[image:34.560.80.498.61.486.2]rate at the higher pulse frequency. At the .lower frequency,
H.E.T.S. varies over a somewhat wider range. The
extrac-tion picture at the lower frequency is complicated -by the
fact that each phase is alternately dispersed and continu-ous. Thus, the thickness of the dispersed phase layer
under each plate, or the holdup ratio, becomes an important
factor in addition to the droplet size and contact time.
At very low dispersed phase flow rates, the droplet-size
is very small; hence, the interfacial area is large, and
as a result, transfer rates are high. As the dispersed
flow rate is increased, the degree of turbulence increases,
tending to improve extraction efficiency. Howev~r, this
effect is partially counterbalanced by a simultaneous
in-crease in droplet size which tends to reduce the total
interfacial area. As flooding is approached, the droplet
size becomes so large that extraction efficiency is actually lowered.
The continuous phase flow rate was found to have a
greater effect on H.E.T.S. than the discontinuous flow
rate. Since the transfer was from the discontinuous to
the continuous phase, an increase in continuous phase
residence time (decreasein flow rate) resulted in lower
H.E.T.S. values. When viewed from the standpoint of film
resistances, the mass transfer picture becomes clearer.
Since the solute distribution favors the continuous phase
(water), and since the viscosity of the dispersed phase is
greater than that of the continuous phase
(4.5
cp. for amylalcohol, as compared to 1.0 cp. for water at 20°C.), it
might be expected that the principal resistance to
diffu-sion lies in the dispersed phase. As a result, the alcohol
phase film can be thought of as thicker than the water
phase film, and therefore controlling.
A dispersed droplet is thought to have a "static film",
the thickness of which is not appreciably affected by the
relative velocity of the two phases, whereas the continuous
phase film thickness is considerably affected by relative
velocity. The velocity of each dispersed droplet in
the column is largely dependent upon its diameter, the
density difference between the two phases, and the
con-tinuous phase viscosity. Although an increase in
dis-persed phase flow rate increases the size of each droplet,
its velocity is not materially increased since the
produc-tion of more droplets results in hindered rising. On the
other hand, the reduction in the effective cross-sectional
31 :
relative interfacial velocity somewhat, · and i.n this light-
-one would expect extraction to be improved. An increase .in the continuous phase flow rate~ however~ l<:>wers the dis- ·
persed droplet velocity because of.the increas~d f~icti6nal
resistance encountered in counterflow of the two ph~ses.
Therefo-re, for the latter case the relative interfacial
velocity would not change appreciably0 and extraction would
depend almost entirely upon the residence time of each phase
in the column.
The :.data of Tables 1 and 2 show that a 2.5-fold increase in the water rate at a constant alcohol rate effected a 25 per cent decrease in (HTU)oG and an 80 per cent increase
in (HTU)oL" That (HTU)oG would be relatively insensitive
·to changes in the water rate might be predicted on the basis of the '~stagnant" nature of the alcohol film and the negligible effect of the continuous flow rate upon the
relative interfacial velocity. The slight decrease in
(HTU)oG is consistent with the fact that a unit volume of the alcohol phase contacted a greater quantity of fresh
solvent-per unit time. Similarly, the lowered residence
time of the water phase, when its flow rate was increased, was the major 'factor contributing to the large increase
in (HTU)oL•
rr
the alcohol flow rate is increased 2.5-fold, at ·a constant water rate, the same data show a 40 per cent in-crease in (HTU)oa and a 45 per cent dein-crease in (HTU)oL• The increase in \HTU)oG' in this c~se, may be accounted for by the decrease in the alcohol residence time; however,the magnitude of this _increase in (HTU)oa is lower than
-would be expected if residence time had been the only
significant factoro It is probable that extraction was
enhanced to some extent by an increase in the relative in-terfacial velocity, as was previously suggested. The decrease in (HTU)oL may be explained by the increased quantity of alcohol which contacted a unit volume of the water phase per unit timeo
Applying the preceding analysis to the over-all inter-pretation of the effect of the flow ratio upon extraction, it is seen that a 2.5-fo,ld increase in the ratio G/L
1) a 2.5-fold decrease in L, at constant G,
or 2) a 2.5-fold increase in
a,
at constant L.Thus, for this investigation, where the direction of boric acid transfer was from the alcohol to the water phase,
ext~action was improved by an increase in the flow ratio, G/L, irrespective of the method by which this ratio was increased. If the transfer of boric acid had been in the
opposite direction, th~trends in over-all HTU's ~ould
[image:37.566.56.506.45.506.2]have been reversed with respect to the flow ratio.
Figure 6 illustrates an empirical correlation of (HTU)oa
with the ratio, rnG/L, sometimes called the extraction factor. Although the optimum choice of the extraction factor for a
practical extraction and solvent-recovery process is pri~
rnarily a problem in economics, · a· large value of lt1G/L would
be advantageous for the particular system investigated. The data at the lower pulse frequency are best represented,
in Figure 6, by separate straight lines, each referring to
a constant value of continuous phase flow rate. Thus ex-traction was seen to be a function of each flow rate, individually, rather than the flow ratio. This might be expla-ined on the basis that neither phase was truly con-tinuous at the low frequency, and the interpretation of the
calculated values of over-all HTU's as being-based entirely
on either of the two phases is probably unsound. The type
of flow behavior at 72 cycles/min.: was similar to that of
a spray column, in that no appreciable dispersed phase
coalescence was observed beneath each plate. This simplifies
the interpretation of HTU data and probably explains the
more general correlation of (HTU)oa with the flow ratio at
the higher frequency.
Pulse amplitude and frequency
It was shown in Figures
8
and9
that transfer efficiencyis greatly improved by increasing either the pulse
displace-ment or frequency. Both operating variables aid extraction
33
equipmento Figure 9 shows that efficiency is markedly
improved as the product, amplitude x frequency
(equiva-lent.to the pulse energy), is increased. Beyond a
cer-tain .point~ however, a further increase in the 'pulse
energy had no appreciable effect on extractiono Thus
the curve was seen to flatten out at a pulse energy or
approximately 15. A possible explanation .of this is that
the· droplet size was reduced to such an ~xtent that
exces-sive back-mixing occurred, tending to decrease the
effec-tiveness of the countercurrent action.
Although flooding occurred at holdup ratios of
appro-ximately 0.30 at low frequencies, clear-stream operation
was observed with holdup ratios as high as 0.50 when
higher frequencies were used. This accounts for the in- ·
crease in throughput capacity at high pulse frequencies
and may be explained by the reduced size of the dispersed
droplets as well as the prevention of their coalescence
because of mo·re frequent impacts with the plates.
The limiting values of pulse amplitude and frequency
are dependent on the physical characteristics of the
system to a large degree. Thus if the interfacial
ten-sion of the two phases is low, as is the case with liquids
of high mutual solubility~ there exists a definite
ten-dency towards the formation of stable emulsions.
Con-sequently, the systsm would not be operable at high pulse
. rate~. On the other hand, if the interfac ia 1 tens ion is
high~ the upper limit of operating pulse frequency and
amplitude would probably be determined by flooding in the
effluent streams due to excess~ve dispersed phase coal- ·
escence in the column, occurring at the high holdup ratios
encountered.
Still another phenomenon might occur at high pulse
frequencieso This. effect, known as cavitation~ would cause
the system to be inoperable because of bubble formation in
the line from the column to the pulse generator due to the
development of localized pressures which would be lower than
the vapor pressure of the pulsed fluid. In order for this
to occur, the algebraic sum of the atmospheric, hydrostatic
and pulse acceleration pressures must be less than the
vapor pressure. The acceleration pressure reaches its
most negative value at the pulse generator when the
direc-tion of flow changes from positive to negative, and at
to take place~ Cooper and Groot (3) have shown that the
pulse acceler~tion pressure is directly proportional to
the pulse displacement and the square of the frequency.
Thus the use of high frequencies might be prohibitive for
systems having high vapor pressures.
Choice of continuous phase
The location of the interface determines which 6f th~
two phases in the column is to be the continuous one. ·rn
-general, the physical properties of the system which affect
the film thickness, the degree of dispersion and the
drop-let velocity, as well as the chemical properties which
affect the plate-wetting characteristics, determine the
optimum choice of the interface location. Usually, the
phase which preferentially wets the plate~ is chosen as
the continuous phase since finer dispersions of the
dis-continuous phase would then be .. obtainable. However, if
the interfacial tension is. low"' dispersion will usually
be adequate in either direction, and viscosity will
pro-bably be the determining factor in choosing the continuous
phase. This was the case with the system: water-boric ·
acid-isoamyl alcohol~ where higher rat~s of extraction
were observed with the water phase continuous. The
dis-persed droplet size was~approximately the same with either
phase continuous, but the greater viscosity of the alcohol
phase resulted in slower settling rates of .the dispersed
droplets when the alcohol phase was continuous. Thus,
because of hindered settling of the dispersed phase, mass
transfer rates were lower. Also contributing to the
lowered efficiency, is the fact that the low-flow fluid
was dispersed, making less interfacial area available,
per pulse, than with the high-flow fluid dispersed.
Plate characteristics
Although only one plate assembly was tested in this
performance study» several generalizations may be made
regarding the effects of hole diameter, number of holes
per plate and plate spacing on extraction and throughput.
The hole diameter has the greatest effect on dispersed
droplet size"' and hence, on interfacial area. Thus
35
The lowered velocity of the disper~ed droplets also con-tributes to higher transfer rates by increasing column
holdup (residence time). The use of very small holes,
however1 would tend to cause either emulsification or
flooding at low throughputs. An increase in the number
of holes per plate probably has little effect on extrac-tion at optimum operating conditions since the same num-ber of dispersed droplets having the same diameter would be formed by each plate per pulse, regardless of the num- ·
ber of holes (above, say, 10 per cent free area per plate)o Plate thickness, on the ot.her hand, is an important factor
and should be kept to a minimum in order to obtain better dispersion and to lower the pressure drop through-the
per-forationso Close plate spacing generally results in bigb
extraction efficiency at the expense of a lowered
through-put capacity. However, throughputs may be increased by
using a wider plate spacing, and the lowered efficiency
brought about by this may be improved by increasing the
pulse frequency. Thus a great versatility in pulse column
operation may be achieved by the suitable combination of
operating and design variables.
Application of Performance Data to Other Systems
In order to avoid much of the experimental work in
selecting the optimum conditions for pulse column operation
with an untested system, a generalized procedure for
inves-tigation, based upon the P~.rformance data obtained with
the system: water-boric acid-isoamyl alcohol, may be
formu-lated. A knowledge of the qualitative effects of the
physical properties of the system upon pulse column
variables is helpful in limiting the permissible operating
range and predicting a logical region for systematic study.
Prior to any experimental work1 column and plate
assemblt design Should be investigated from the standpoint
of desired throughput capacities. In general, it may be
stated that pulse columns are capable of handling between
two and three times the volumetric throughput of similar
packed columns. As 2a starting point, an optimum
through-put of 500 gal./ft. /hr. may be used in approximating the
required column diameter1 if the unit is to be used as a
laboratory tool where high efficiencies are of prime
a plant extractor where high throughputs as 'well as effi~
ciencies are neee~sary8 a basis of 1000 galo/fto2/hr. may be used for selecting the column diametero
The generalizations made in the previous eection9
regarding plate characteristics, apply to any system and
th~refore may be utilized in choosing a ~uitable pl~te
design. Usually, hole Qiameters between 0.03 and 0.05 inches will be adequate. Where dispersion is difficult due to high viscosity or high interfacial tensiona the larger hole diameter would be beneficial. If the density difference is high and the viscosity low» small perfora~
tiona will yield low values of H.E.T.So without considerable reduction in throughput capacity. Where coalescence is
rapid (systems having a low viscositf» high density dif-ference and high interfacial tension)9 a plate spacing of
one inch may be desirableo However9 is this is not the
case9 and especially if the system exhibits a tendency
towards the formation of stable emulsionsa l~rger plate spacings may be warranted.
For any given system the phase in which the solute is more soluble should flow at a slower rate. Ordinarily, the 'low-flo~ fluid would be.the continuous phase; however, several comparative extraction runs should be made in order to validate the optimum choice 9f continuous phase.
I t packed or spray column data is available for the par-ticular system, optimum f.low rate ratios found on these extractors may be used as a basis for studying the system using a pulse columna If such data is unavailable~ it would be desirabfe to carry out a few series of extraction runs$ keeping flow rates of the low=flow fluid constant and
varying the other flow rate. Flooding conditions should be app~oached in each series of runs in order to insure investigation of the region of high throughput where
ex-t~action efficiency is usually higho Pulse frequency and amplitude should be kept constant throughout the series of runs. Moderate pulse conditions should be used (e.g. 50 eye lea/min".. .and 0. 30 inches amp 11 tude) • Only th:r'ee or four runs need be made in each series in order to·determine the optimum flow ratio.. Once this is found.., a a·eries of extraction runs can be made to determine the pulse fre-quency and amplitude which give the lowest values of
H.E.T.S.
37
coalesce slowly. Hence9 a low frequency should be chosen
(in the neighborhood of 30 cycles/min.) 9 and a series of
Jl."uns should be made at the optimum flow ratio.~~ at con-stant flow rates9 varying the pulse amplitude in the
range above 0.50 inches. Pulse displacements as high as the distance between successive plates would probably give optimum results at this low frequency. If$ on the other handp the physical characteristics of the system are such that coalescence is fairly rapid9 the region of
high pulse frequencies should be investigated (about 50 cycles/min.). In either case runs should be planned to cover as wide a range in the product9 (amplitude) x (fre- ,
quency), as possible$ keeping the flow rates constant. This way optimum operating conditions may be established with a minimum of trial-and-error experimentation.
Advantages and Limitations of the Pulse Column Advantages
1. Because of its high efficiency and low column height (approximately 1/3 that of a similar packed column performing the same separation)9 the pulse column is
par-ticularly advantageous where low head room or shielding
requirements (for radioactive solutions) prohibit the use of larger columns.
2. High throughput capacities are obtainable.
allow-ing the use of small-diameter columns.
3.
Column construction is relatively simple, and the absence of moving mechanical parts within the column keepleakage.~~ maintenance and repair problems to a minimum. The entire system can be made corrosion-resistant by using a plate assembly of a suitable plastic material and separating the external pulse mechanism from the column liquids by
means of an inert diaphragm.
4.
The pulse column is a versatile piece of equipment in that the "packing characteristics" (and hence.~~ the flowplate assembly cartridges, having different plate spacings and hole diameters may readily be installed or removed to
alter the degree of dispersion and coalescence for dif-ferent systems.
Limitations
1. Th~ initial cost of the pulse column (essentially3
the cost
or
the pulse generator) might be prohibitive for installations in which relatively inexpensive spray, packedor wetted~wall towers are economically feasible. However9
the high initial cost may be offset by the savings due to
increased throughput and lowered height requirements. 2. A mechanical problem which will probably limit the applicability of large-diameter pulse columns, is the
difficulty in pulsing large volumes of fluid at a rapid
and constant rate. To do this, an efficient and economical plant...:size pulse generator must be developed which will provide reproducible operation over a long period without failure. At the present time, large-diameter piston pumps appear to be most feasible for this application.
3. The pulsing requirements for highly viscous liquids may be excessive. Similarly, for highly volatile systems9
cavitation at the pulse generator might inhibit column
operation.
4. Where coarse slurries are to be processed, the
pulse column. would not be applicable due to the possible clogging of the plate perforations by suspended particles.
Discussion of Errors
..
( • ' •, ' \ • 'I r)t'l
. The ma\.r.Ptal bal&nce trfis the·· enly-
qua
·
n~ttative 'illl~~
,
dt'
exl'er1me~nt4·'1 e~ror in this.- inve'S~t164t1on·6 .- Th·1s err~~ :~,repre
!l'ented tb•
desft•
·of' a~tainment -or. steacW-·-,_ata.te · c.ond:Ltions in thecolumn, as well as experimental error in flow rate measure-ment. Analyses did not cause a significant error as these
were usually reproducible within 0.2 per cent accuracy. The maximum material balance error was ~