Abstract: This drone protection unit is designed to protect from possible accidents on the ground or water. Accidents may cause technical failure, signal losses, motor malfunction, weather condition, collision etc. The objective is to develop a prototype to protect the components or any such packaging attached to the drone for safe landing. Similar to an airbag concept, it deploys two inflators once the sensor detects any unwanted movement experienced by the drone. A total of six tests were done for this experiment. The first three tests were the Ultrasonic, Arduino and reliability tests; to indicate any environmental variables that can have an impact to the drone and for the speed sensor. Among these three, ultrasonic test gave the best sensing ability compared to the others. The reliability test was conducted by placing the sensor in front of a fan to observe the effect on the sensor; whether it would be affected by windy conditions. The functional test involved the drone to be equipped with six sensors to determine the result for any changes in movement of any object from the sensor. The final test was observing the whole system by dropping the decoy drone from a height of 12m. Overall results showed that the time taken for the airbag to fully be inflated was 32ms while the drone protection applied for this project was 1.293s.
I. BACKGROUND
Based on the previous research that have been done in the aviation domain which includes many specializations1-19, drone technology has been selected to be pursued for this study. Human Drone accidents and incidents continue to be on the rise. As for this year, on 25th March, the Federal Aviation Administration (FAA) released 582 new reports of incidents involving unmanned aircraft in United States of America (USA) airspace system20. This causes the drone owner to suffer few losses in which they need to buy or build a new drone whenever a crash occurs. Drone accidents and incidents have been a serious issue when it happened in a private land or place as FAA recorded that there are 116 incidents of close encounters between a manned aircraft and drone that involved a plane carry 50 passengers or more while in Malaysia, there was one case where a guy flew his drone right into Kuala Lumpur International Airport (KLIA) to take shots of the planes coming in to land.
Revised Manuscript Received on March 08, 2019.
Muhammad IqmalMohd Ali, Senior Lecturer, Universiti Kuala
Lumpur – Malaysian Institute of Aviation Technology, Dengkil, Selangor, Malaysia
Nurul Asmia’tulAsii’mah Ahmad Khairul Azman, Undergraduate
student, Universiti Kuala Lumpur – Malaysian Institute of Aviation Technology, Dengkil, Selangor, Malaysia
Drone crashes may even lead to injuries or fatalities whether it is directly or indirectly hit or fall on human
Drones normally weight around one kilogram or more and providing its speed and the way it crash. The blade itself is dangerous when it comes to such situation. This is why drone needed a protection unit that can be deploy whenever drone having technical failures, about to have any collision or even in the event of near crash, so that it will protect the drone from any damage and will not bring any harm to those people around the drone. The specific objectives of the project that should be achieved are as follows:
To design an automated protection unit for medium size drone upon technical failure and physical impact To test the functionality of the automated deployable protection unit.
To analyses the type of sensors and feedback time that affects the protection unit deployment duration.
This project basically applicable for any free fall object be it from any aircraft crash or from high building. However, the scope has been narrowed down to medium sized drones of multi rotor with a speed of less than 30km/h. This project is limited to above scope as small sized drone does not have enough power to weight ratio to carry the weight of this protection unit and the response time for this protection unit does not work effectively for drones above 30km/h speed.
II. METHODS
The first part consists of electronic circuit and programming, which involves Arduino Mega, different types of distant measuring sensors such as Ultrasonic Sensor, Arduino Infrared Sensor Module, and Sharp GP2Y0A02YK0F Analog Infrared Sensor and also other related components in this project. The second part consists of hardware and materials which will be used as a device that deploys the airbag system, type of airbag and related protection systems that we have tested to be effective in absorbing the impact from all sides. Testing method is on developing a guideline to limit the project’s methodology within the scope and to show the steps that need to be followed in order to fully develop aproject.
Arduino Mega will first initialize the distance and converts them into velocity using 6 distance measuring sensors located on all sides of the drone when turned on to
Automated Deployable Protection Unit for
Drones
Automated Deployable Protection Unit for Drones
prevent accidental deployment when the drone is on ground. The drone will then start to measure all distance measuring sensors that will be measuring distances and converting them into velocity in real time once the drone is clear of any obstacle within 60 centimeters on all sides. If the velocity of the object on all sides exceeds 30km/h within 60 centimeters, the airbag will be deployed by Arduino Mega’s digital signal which is sent to a relay that acts as an electromechanical switch in the power circuit that is connected to the airbag inflator, to absorb impact in any directions. If the velocity is below 30km/h, the drone will not activate the deployment system until the distance measured is below 15 centimeters in either one direction, except for sensor that is located at the bottom of the drone, in which the airbag will be deployed regardless of the velocity.
If the airbag is not deployed, the drone can return safely without the accidental deployment on landing as the sensor which is located at the bottom will not trigger as long as the landing velocity is well below 30km/h. After landed, the drone will turn off detection on all sides so that the drone controller can safely approach the drone to turn the drone off. If the drone is taken airborne again after landing, the system will turn itself active again. The whole project has rechargeable batteries to provide power to the system.
III. RESULTS
Three sensors will be held up for the analysis which is Ultrasonic Sensor, Sharp GP2Y0A02YK0F Sensor and Arduino Infrared Sensor.
Testing Methods
Upon writing a successful coding that can interface with the relay, it is now the job of sensors to provide the data to the Arduino Mega 2560. This brings the project to the next phase, where the sensors need to be tested. The analysis will include a few aspects including functionality, reliability and speed. These aspects are very important and crucial because it will determine the functionality of the project as a whole, thus determining whether or not the objective has been achieved. The testing development will focus on electronic components and software.
How Relay Triggered Airbag Inflator
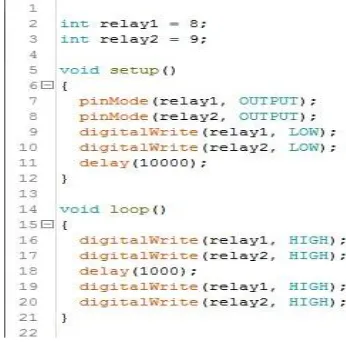
[image:2.594.326.499.51.222.2]Before testing the distance measuring sensors, the relay will be checked to ensure that it works properly. Also tested here is the power supply for the airbag inflator that to make sure Airbag Deployment Circuit is working accordingly. Connection of the diagram is not changed as we are going to test the whole Airbag Deployment System only. Figure 1.1 is the coding to test the system.
[image:2.594.311.541.260.423.2]Fig. 1.1 Airbag Deployment System
Fig. 1.2 Relay activated 10s after Arduino Mega Turned On
Figure 1.2 shows the relay is initialized and then activated after 10 seconds the Arduino Mega 2560 has been turned on based on the coding written in Figure 1.1. Figure 1.3 shows a successful deployment of the Airbag Inflator and the airbag has fully inflated.
[image:2.594.315.540.540.643.2]Testing to Measure Distance
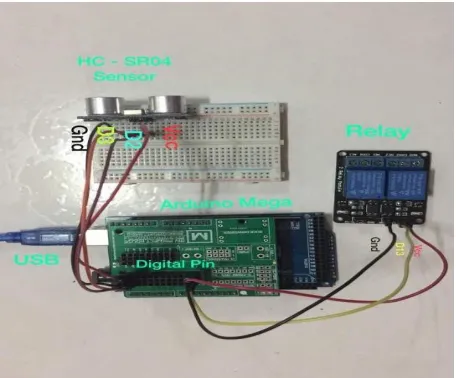
[image:3.594.311.542.143.261.2]In this section, the measuring distance test is conducted by using three different type of sensors. The result of this test will indicate the environmental variables that can have effect on sensor and the speed of reading from the sensor. Figure 1.4 shows that the Ultrasonic sensor has been successfully connected to the Arduino Mega and the relay module. Then, the coding is written to get the reading from the Ultrasonic sensor.
Fig. 1.4 Test 1 - Ultrasonic Sensor Attached to System
[image:3.594.56.284.192.381.2]The coding is shown in Figure 1.5. In this test, the distance reading of this sensor is obtained by placing a box at the distance of 60cm from the sensor. The box is then moved towards the sensor and the reading is recorded.
Fig. 1.5 Coding to test Ultrasonic Sensor
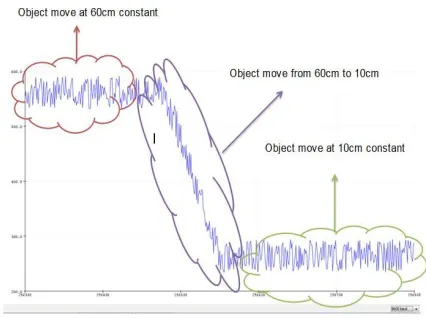
Figure 1.6 is the reading from the Ultrasonic sensor that has been obtained from the Serial Plotter in Arduino IDE that shows when object is moving at 60cm constant, object moving at 10cm constant, object moving from 60cm to 10cm and object moving from 10cm to 60cm.
Fig. 1.6 Reading from Ultrasonic Sensor
The reading that obtained from Arduino is in microseconds and the distances that need to be measures should be in cm. Based on this, we have to convert the original mathematical equation to measure distance into different unit. Equation 1.1 is the original equation before converted into new equation.
Equation 1.1: Original Distance Equation Used
Equation 1.2 is the equation that its distance and time have been converted from meters to centimeters and from seconds to microseconds.
Equation 1.2: New Converted Distance Equation
From Figure 1.6, three reading of object moving at constant distance of 60cm is taken to get the accuracy of the Ultrasonic sensor. From Table 1.1, we can find the distance using calculation that has been derived from Equation 1.2. Table 1.2 is the measured distance obtained from Table 1.1 after using the Equation 1.2.
Table. 1.1 Time taken at three reading of constant movement of 60cm
Reading Time (µs)
1 3500
2 3450
[image:3.594.48.264.470.717.2]Automated Deployable Protection Unit for Drones
Table. 1.2 Measured Distance of Ultrasonic Sensor
Reading Distance (cm)
1 60
2 59
3 60
[image:4.594.106.231.85.148.2]Figure 1.7 is the graph of the measured distance of the Ultrasonic sensor. We can see from the graph that the distances measured from the three readings are slightly same which proves this sensor accuracy.
Fig. 1.7 Ultrasonic Measured Distance
[image:4.594.48.288.222.376.2]Figure 1.8 shows the Sharp GP2Y0A02YK0F sensor attached to the Arduino Mega 2560 and the 2 way channels relay module. This test is carried out using the same method as shown in Figure 1.6 before. The box will be moving from 10cm to 60cm and vice versa.
Fig. 1.8 Sharp GP2Y0A02YK0F Sensor Connected to the
Relay and Arduino Mega
Figure 1.9 is the coding used to carry out this test. After the coding has been successfully uploaded, the results can be seen in Serial plotter as shown in Figure 1.10.
Fig. 1.9 Coding for Sharp GP2Y0A02YK0F
[image:4.594.48.282.470.618.2]Figure 1.10 shows the reading from Sharp sensor where the constant high reading indicates object moved at 60cm constant while the lower reading indicates object moving at 10cm in constant distance. When the object moved from 60cm to 10cm, the reading will be decreasing. Figure 1.10 data is obtained from the Serial Plotter.
Fig. 1.10 Reading from Sharp GP2Y0A02YK0F Sensor
B
[image:4.594.319.532.506.665.2]Table 1.3 shows the distance from 10cm to 180cm and the digital reading obtained from the Serial Plotter. Figure 1.11 is the graph plotted from Table 1.3 based on Equation 1.3 which is the power equation for the Sharp sensor calibration.
Table. 1.3 Measured distance for every 10cm
Equation 1.3: Power Equation for Sharp Sensor Calibration
Equation 1.3 is obtained by adding a trend line and to the graph so that it will find out the average equation of the measured reading to provide consistent graph in order to aid the coding in converting measured digital value to centimeters.
Figure 1.11 is the graph of distance vs. digital reading where when the reading is high, it indicates that the distance to the object or the distance from the object approaching the sensor is near and when the reading is low, the distance will be far or longer. However, this sensor will invert the signal that it received if the distance is 170cm and above. The blue line is the real result gained while the black line is the graph that guided graph from the datasheet.
Fig. 1.11 Graph of Distance vs. Digital Reading
Table 1.4 is three readings taken when object moving at constant 60cm. By using Equation 1.3, the digital value is then converted into distance in cm as shown in Table 1.5 and the results can be seen in Figure 1.12.
Table. 1.4 Digital Value of constant movement of an object at 60cm
Readings Digital Value
1 1975
2 2000
3 1900
Table. 1.5 Distance Measured
Readings Distance (cm)
1 58.99
2 58.22
3 61.44
Figure 1.12 shows the graph obtained from Table 1.5 in which the distances obtained from those three readings are slightly the same, indicating that this sensor accuracy is good since each reading did not have large gap in distance.
Figure 1.12: Graph obtained from Table 1.5
Figure 1.13 shows that the Arduino Infrared Sensor Electronic is assembled as shown in Figure 1.14. After that, the coding needs to be written to get reading from the sensors. Figure 1.14 shows the coding for Arduino Infrared sensor that is used for this test.
Automated Deployable Protection Unit for Drones
Fig. 1.14 Coding for Arduino Infrared Sensor
When the coding is uploaded, the results can be seen in Serial Plotter in which for this sensor, its reading is similar to digital output which is high or low. Figure 1.15 shows the reading obtained from Serial Plotter.
[image:6.594.314.539.49.203.2]From Figure 1.15, reading is high when the object is moving at constant 10cm distance while the reading is low when it moved at constant distance of 60cm. This sensor does not detect at all distance. However, it triggers when object is in proximity. This is based on the reading in Table 1.6 and the results are plotted in Figure 1.17. Table 1.6 is the readings gained from Arduino Infrared sensor.
Table. 1.6 Readings from Arduino Infrared Sensor
Distance Digital Value
10 550
20 550
30 550
40 10
50 10
60 10
As a conclusion, Ultrasonic Sensor gives the best distance sensing ability compared to Sharp GP2Y0A02YK0F Sensor and Arduino Infrared Sensor. However, Arduino Infrared Sensor failed to detect more than 30cm making it limited up to 30cm. Arduino Infrared Sensor is automatically disqualified from the next test, which is reliability.
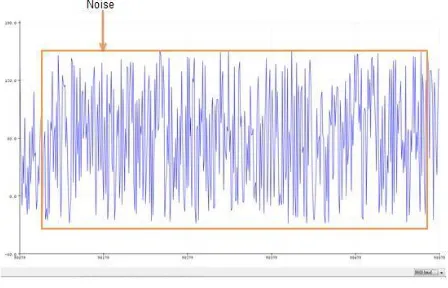
Figure 1.17 shows the ultrasonic sensor positioned in front of a fan. However, both Ultrasound and Infrared Sensors are subjected in front of a constant wind from fan to see whether their readings affected by the wind.
Fig. 1.17 Ultrasonic Sensor in front of a Fan
[image:6.594.50.245.52.235.2]Figure 1.18 shows the reading obtained by Ultrasonic Sensor in which when it is subjected in front of a fan, the signal is not stable and the reading is inaccurate as there are noise in the signal as shown in Figure 1.18.
Fig. 1.18 Ultrasonic Sensor’s Readings
[image:6.594.314.538.289.433.2] [image:6.594.93.247.423.540.2]Fig. 1.19 Sharp GP2Y0A02YK0F Sensor Readings
[image:7.594.309.511.99.352.2]Due to the fact that light travels faster than sound, light waves can be reflected and sensed faster. Furthermore, the light waves are not affected by the surrounding air as light can travel even in vacuums. This caused the Sharp GP2Y0A02YK0F Sensors to have a clear advantage over Ultrasonic Sensor. Generally Ultrasonic Sensors have a more accurate reading but on a very quiet environment. Since we are going to apply this sensor in a project that will be subjected to winds and noise from rotor blades of the drone, Sharp GP2Y0A02YK0F Sensors seems to be more applicable in this project. Table 1.7 shows the comparison between Ultrasonic sensor and Sharp Sensor.
Table 1.7 Ultrasonic Sensor and Sharp Sensor Comparison
Ultrasonic Sensor Sharp
GP2Y0A02K0FSensor
Readingsaffected by wind
Inaccuratereadings
Noise ishigh
Readings isnot affected by wind
Accuratereadings
Low noiseThis functionality test is using six Sharp sensors and each sensor is represented in six different colors as shown in Figure 1.20. Front sensor is represented by blue color, back sensor is in orange color, bottom sensor is red color while upper sensor used violet color. As for right sensor, the color is green and left sensor is grey in color. The result shown is to know whether all of the sensor readings changes according to the distance of object moving towards and moving away from the sensor.
All the all six sensors are outputting their signals in Serial Plotter that have been filtered for noise. When the reading is constant, it indicates that there is no movement. However, if there is movement moving towards the sensor, the reading will be decreasing and if the movement if going away from the sensor the reading will be high. Based on the datasheet, one 10uF smoothing capacitor is recommended to be used
to filter out unwanted noise. The coding was modified to form the final coding as shown in Figure 1.21. Full coding will be attached in the appendix.
Fig. 1.21 Final Coding
Then after the Arduino Mega 2560 is programmed using above code, we tested using relays without attaching airbags for safety purposes. No further modification in both hardware and software is required to repair or perfect the system.
Drop Test
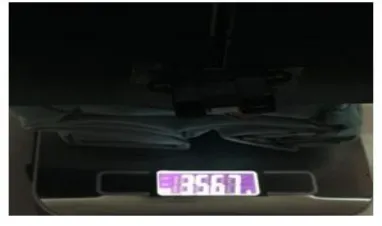
The decoy drone is dropped from a distance of 8m to check whether the whole system is working as expected in this dummy drone. Figure 1.22 shows the overall weight of the decoy drone and the protection unit system itself.
[image:7.594.56.283.413.528.2] [image:7.594.327.518.523.636.2]Automated Deployable Protection Unit for Drones
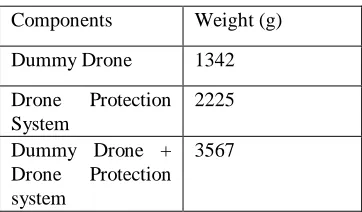
[image:8.594.299.554.68.280.2]Table 1.8 shows the weight of the project which covers the dummy drone, the drone protection system and the dummy drone with the protection system as well.
Table. 1.8 Weight of the project
Components Weight (g)
Dummy Drone 1342
Drone Protection System
2225
Dummy Drone + Drone Protection system
3567
When the drone is dropped, Arduino Data Logging system that is placed inside the dummy drone will take measurements continuously throughout the drop test in terms of velocity, acceleration and time taken for the airbag to deploy.
Time taken for the Arduino to deploy is calculated from the time the relay disconnected. The expanding airbag will cause the wire to disconnect, thus recording the log to the Arduino Data Logger. Table 1.9 is the saved data retrieved from Arduino Data Logger by subtracting the time of the airbag deployment’s timestamp from the time relay turns on as shown in Equation 1.4 and Table 1.10 shows the Real Result Deployment of Dummy Drone retrieved from the Arduino Data Logger.
[image:8.594.78.259.103.209.2]Equation 1.4: Time Taken Arduino to Deploy the System
Table. 1.9 Saved Data Retrieved from Arduino Data Logger Timestamp Velo city Acceler ation Rela y 1 Rela
y 2 Airbag
(s) (m/s) (ms-2)
<00:00:00:0000> 0 0 OFF OFF NO
<00:00:00:0001> 0 0 OFF OFF NO
<00:00:00:0002> 0 0 OFF OFF NO
<00:00:00:0003> 0 0 OFF OFF NO
<00:00:00:0004> 0 0 OFF OFF NO
<00:00:00:0005> 0 0 OFF OFF NO
<00:00:00:0006> 0 0 OFF OFF NO
<00:00:00:0007> 0 0 OFF OFF NO
<00:00:00:0008> 0 0 OFF OFF NO
<00:00:00:0009> 0 0 OFF OFF NO
<00:00:00:0010> 0 0 OFF OFF NO
Table. 1.10 Real Result Deployment of Dummy Drone
Timestamp Velocity Acceleration Relay
1 Airbag
(s) (m/s) (ms-2)
<00:00:41:910> 0 0.0089 OFF NO
<00:00:41:911> 0.0089 0.0089 OFF NO
<00:00:41:912> 0.0178 0.0089 OFF NO
<00:00:41:913> 0.0267 0.0089 OFF NO
<00:00:41:914> 0.0356 0.0089 OFF NO
<00:00:41:915> 0.0445 0.0089 OFF NO
<00:00:41:916> 0.0534 0.0089 OFF NO
<00:00:41:917> 0.0623 0.0089 OFF NO
<00:00:41:918> 0.7129 0.0089 OFF NO
<00:00:41:919> 0.8018 0.0089 OFF NO
From the data logged by the data logger based on Table 1.10, airbag deployment time and time Relay 1 and Relay 2 on is as shown in Table 1.11.
Table. 1.11 Timestamp of the Triggered Components
Triggered Components
Timestamp
Relay 1 <00:01:42:0871>
Relay 2 <00:01:42:0872>
Airbag Deployment
<00:01:42:0903>
From Table 1.11, when we subtract according to the Equation 1.4, it will be as shown below, based on the equation stated, we know that it takes 32ms maximum to deploy an airbag from the time it was triggered by the Arduino Mega.
Trigger of Airbag deployment from Relay 2 = 00:01:42:0903 - 00:01:42:0872 = 00:00:00:0031
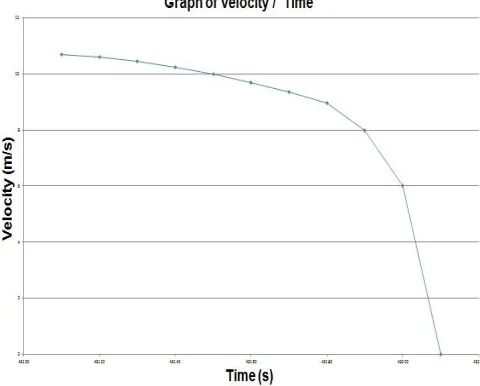
[image:8.594.353.499.362.461.2] [image:8.594.62.276.464.681.2]Fig.1.23 Graph of Velocity vs. Time
[image:9.594.307.547.55.248.2]Figure 1.24 shows the graph of acceleration vs. time where the acceleration is constant throughout the time when the decoy drone fall. The plotted line in the graph is in straight line, showing that the acceleration is constant.
Fig. 1.24 Graph of Acceleration vs. Time
Figure 1.25 is the graph of acceleration over time from the time the acceleration starts to the time it stops with a 10ms delay in between each of the readings. Figure 1.25 show the velocity over time graph similar like the graph shown in Figure 1.23. However, Figure 1.23 focuses more on the time when the dummy drone landing and also focuses on the shock absorbed by the airbag. We can see that there is a deceleration faced by the dummy drone.
Fig. 1.25 Graph of Velocity vs. Time (Landing)
[image:9.594.59.282.345.578.2]Figure 1.26 shows the acceleration over time graph in which this graph focuses on whether the dummy drone touch ground or not. When the dummy drone touches the ground, the acceleration is decreasing as per the graph shown.
Fig. 1.26 Acceleration vs. Time Graph
[image:9.594.309.544.350.566.2]Automated Deployable Protection Unit for Drones
Table. 1.12 Results from Drop Test and Data Logger
Data Variables Raw Values Values
Height 12m 12m
Height 3 Story Building N/A
Drone's Max
Velocity 10.68 m/s 10.68 m/s
Drone's Max
Acceleration 8.9 m/s/s 8.9 m/s/s
Drone Released At 00:01:41:918
1m 42s 918ms Drone's Relay 1
Activated At 00:01:42:871
1m 42s 871ms Drone's Relay 2
Activated At 00:01:42:872
1m 42s 872ms Drone's Airbag
Activated
At 00:01:42:903
1m 42s 903ms Drone Touched
Ground
At 00:01:43:108
1m 43s 108ms Drone Completely
Stopped At 00:01:43:211
1m 43s 211ms
Time Taken from
00:00:01:293 1s 293 ms
Top to Bottom (Drone) Airbag Inflation Process
00:00:00:032 32ms
Stopping Process of
Drone 00:00:00:103 103ms
Time Taken for activation of
Relay to Drone's
Complete Stop
00:00:00:340 340 ms
IV. RESULT DISCUSSION
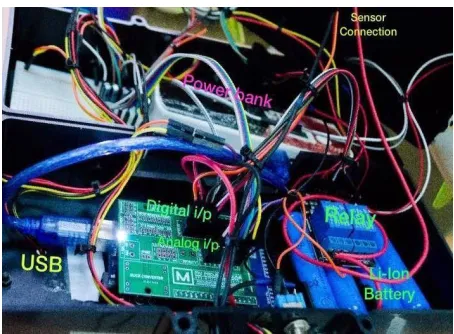
[image:10.594.63.277.73.491.2]Overall, the project for Drone Protection System using Arduino Mega 2560 Microcontroller, Distance Measuring Sensors, Relay Modules and Airbag is a successful project and achieved stated objectives. For the software, all coding must be written without errors. Some error will be shown, called syntax errors. They are easier to correct as it is just a spelling error. A more complex error such as mathematical errors will not be shown and this is harder to debug. If error exists, the system will not function properly. Figure 1.27 shows the overall system for Drone Protection Unit.
Fig. 1.27 Overall System for Drone Protection Unit Table. 1 Means for all items
V. CONCLUSIONS
The Sharp GP2Y0A02YK0F Sensors has the most reliable reading among the three sensors. However, the reading is quite noisy and has to be fixed in order to improve the signal. The datasheet comes in handy on smoothing out the signal waveforms as we can get the exact component and its rating. Also inside the datasheet is the digital value reading to distance graph, which helped us in getting the equation required to get the distance out of the Sharp GP2Y0A02YK0F Sensors.
Relay Modules also has different types of variant but this relay physically turns off secondary circuit by using a metal armature that moves inside, actuated by an electromagnet. The current rating for Relay Modules is also more than enough for the system that we are constructing. The Airbag Inflator which is controlled by the Relay can inflate Airbag within tens of milliseconds which is very useful in high speed collisions or during free fall.
As a conclusion, Drone Protection System using Airbag Deployment System was successfully developed. The lifesaving technology of Airbag, combined with other electronic components such as Arduino Microcontrollers, Relay Module and Sharp GP2Y0A02YK0F Sensors can be utilized to protect a drone.
For further research and development, there are a few recommendations on how this drone protection system can be improved.
Make the system to be more flexible and portable to support plug-andplay concept. Many drones are custom made according to the owner’s or operator’s needs. If a more portable and flexible device is created, the owner or operator can just fix the device to their custom built drone which can be costly to provide protection.
REFERENCES
1. Amzar M, Fard M, Azari M, Benediktsdttir B, Arnardttir E, Jazar R, & Maeda S. Influence of vibration on seated occupant drowsiness. Indust. Health Jour. 2016;54(4) :296-307
2. Amzar M, Fard M, Azari M, &Jazar R. Influence of vibration on seated occupant drowsiness measured in simulated driving. Appl. Ergo. Jour. 2017;60:348-355
3. Amzar M &Padil H. Lane keeping performances subjected to whole-body vibrations. Int. Jour. of Engine. & Tech. 2018;7(4.13):1-4 4. Amzar M, Fard M, & Azari M. Characterization of the effects of
vibration on seated driver alertness. Nonlinear Engine. - Model. and Appli. Journ. 2014;3(3):163-168
5. Jabarullah N, Mauldin C, Navarro L, Golden J, Madianos L, & Kemp N. Modelling and Simulation Analysis for the Prediction of the Performance of Intrinsic Conducting Polymer Current Limiting Device. Adv. Sci. Letters. 2017;23(6):5117-5120
6. Omar S, Johari M, & Abdul Samad A.Assessment on risk management of helicopter services for offshore installations. Int. Jour. of Engine. & Tech. 2018;7(4.13):229-231
7. Johari M, Jalil M, &Mohd Shariff M.Comparison of horizontal axis wind turbine (HAWT) and vertical axis wind turbine (VAWT). Int. Jour. of Engine. & Tech. 2018;7(4.13):74-80
8. Zainal Ariffin M, JohariM, & Ibrahim H.The needs of aircraft avionics' radio line replaceable unit repair center at UniKL MIAT. Int. Jour. of Engine. & Tech. 2018;7(4.13):86-88
9. Ishak F, Johari M, &Dolah R.A case study of LEAN application for shortest lead time in composite repair shop. Int. Jour. of Engine. & Tech. 2018;7(4.13):112-119
10.Ya'acob A, Mohd Razali M, Anwar U, Mohd Radhi M, Ishak M, Minhat M, Mohd Aris K, Johari M,Teh C.Investigation of closed compartment moulding for pull-winding process. Int. Jour. of Engine. & Tech. 2018;7(4.13):107-111.
11.Abdul Samad A, Johari M, &Omar S. Preventing human error at an approved training organization using Dirty Dozen. Int. Jour. of Engine. & Tech. 2018;7(4.13):71-73
12.Johari M, & Jamil N.Personal problems and English teachers: Are they always bad?. Int. Jour. of Applied Ling. And English Lit. 2014;3(1):163-169
13.Jabarullah N, Verrelli E, Gee A, Mauldin C, Navarro L, Golden J, & Kemp N. Large dopant dependence of the current limiting properties of intrinsic conducting polymer surge protection devices. RSC Advances. 2016;89:85710-85717
14.Jabarullah N, Verrelli E, Mauldin C, Navarro L, Golden J, Madianos L & Kemp N. Novel conducting polymer current limiting devices for low cost surge protection applications. Jour of Applied Phys. 2014;116(16):164501
15.Jabarullah N, Verrelli E, Mauldin C, Navarro L, Golden J, Madianos L & Kemp N. Superhydrophobic SAM Modified Electrodes for Enhanced Current Limiting Properties in Intrinsic Conducting Polymer Surge Protection Devices. Langmuir. 2015;31(22):6253-6264 16.Othman R, Hossain M, &Jabarullah N. Synthesis and characterization
of iron‐and nitrogen‐functionalized graphene catalysts for oxygen reduction reaction. Applied Organo. Chem. 2017;31(10):e3738
17.Bardai A., Er A, Johari M, &Mohd Noor A. A review of Kuala Lumpur International Airport (KLIA) as a competitive South-East Asia
hub. Proceedings of an international conference. Putrajaya, 12
December 2017. IOP Publ. Ltd. 2017;270:012039
18.Khairuddin M, Yahya M, & Johari M. Critical needs for piston engine overhaul centre in Malaysia. Proceedings of an international conference. Putrajaya, 12 December 2017. IOP Publ. Ltd. 2017;270:012013
19.Ya'acob, A, Razali D, Anwar U, Radhi A, Ishak A, Minhat M, Mohd Aris K, Johari M, &Teh C. Preliminary Study on GF/Carbon/Epoxy Composite Permeability in Designing Close Compartment Processing. Proceedings of an international conference. Pulau Pinang, 21-22 November 2017. IOP Publ. Ltd. 2017;370:012030
20.FAA Drone Sighting Reports. Available on
https://www.faa.gov/news/updates/?newsId=87565 accessed on