https://doi.org/10.5194/angeo-36-1267-2018 © Author(s) 2018. This work is distributed under the Creative Commons Attribution 4.0 License.
Meteor echo height ceiling effect and mesospheric temperature
estimation from meteor radar observations
Changsup Lee, Geonhwa Jee, Jeong-Han Kim, and In-Sun Song Korea Polar Research Institute, Incheon, South Korea
Correspondence:Changsup Lee ([email protected]) Received: 10 April 2018 – Discussion started: 23 April 2018
Revised: 11 July 2018 – Accepted: 4 September 2018 – Published: 25 September 2018
Abstract.The mesospheric temperature estimation from me-teor height distribution is reevaluated by using the Sound-ing of the Atmosphere usSound-ing Broadband Emission Radiom-etry (SABER) and the King Sejong Station (KSS) meteor radar observations. It is found that the experimentally de-termined proportionality constant between the full width at half maximum (FWHM) of the meteor height distribution and temperature is in remarkable agreement with theoret-ical value derived from the physics-based equation and it is nearly time-invariant for the entire observation period of 2012–2016. Furthermore, for the first time we found that the FWHM provides the best estimate of temperature at slightly lower height than the meteor peak height (MPH) by about 2–3 km. This is related to the asymmetric distribution of me-teor echoes around MPH, which is known to be caused by the meteor echo height ceiling effect (MHC). At higher altitude above MPH, the meteor detection rate is greatly reduced due to the MHC, and the cutoff height for this reduction follows a fixed molecular mean free path of the background atmo-sphere. This result indicates that the meteor height distribu-tion can be used to estimate the mesospheric temperature, even under the asymmetric meteor echo distribution caused by the MHC at high altitude.
1 Introduction
Key points:
– Representative altitude of temperature estimated from the full width at half maximum (FWHM) is slightly lower than the meteor peak height by about 2–3 km.
– The meteor echo height ceiling effect (MHC) creates re-markable asymmetry in the height profile of the corre-lation between the FWHM and layer mean temperature. – The state of the background atmosphere is intrinsically reflected in the MHC and therefore in the observed FWHM.
(MLS) based on a basic theory and observations. They fur-ther showed that the temperature estimated from this rela-tion is in better agreement with satellite temperature mea-surements compared with conventionally estimated temper-ature from meteor decay times. Although it was success-fully shown that meteor height distribution provides meso-spheric temperature, the MLS temperature data have a poor height resolution (∼10 km), which is nearly comparable to the FWHM in the mesosphere. Therefore, the resulting tem-perature from the FWHM was assumed to be a layer mean temperature near the meteor peak height (MPH). Further-more, a meteor radar has a limitation on the height range of meteor detection; it depends on radar specifications such as a pulse repetition frequency and a radio wavelength (Cervera and Reid, 2004).
In this study, we reexamine the temperature estimation procedure from the FWHM with the emphasis of the in-variance of the proportionality constant between the FWHM and background temperature, not only from theoretical con-sideration but also from meteor radar and TIMED/SABER (Sounding of the Atmosphere using Broadband Emission Ra-diometry instrument on NASA’s Thermosphere Ionosphere Mesosphere Energetics Dynamics satellite) observations. In addition, we also evaluate the validity of temperature es-timation from the FWHM under the MHC. The meteor radar observations at King Sejong Station (KSS) and the TIMED/SABER instrument are briefly introduced in Sect. 2. Section 3 describes a theoretical derivation of the linear re-lationship between the FWHM and background temperature. The results of this study are presented in Sect. 4 with rele-vant discussions. Finally, this is followed by a conclusion in Sect. 5.
2 Observations
2.1 King Sejong meteor radar
Meteor radar has been used to continuously monitor at-mospheric winds and temperatures in the mesosphere and lower thermosphere for several decades. The Korea Polar Research Institute (KOPRI) has operated a meteor radar at KSS in Antarctica (62.22◦S, 58.78◦W) in collaboration with Chungnam National University, South Korea, since March 2007. The KSS meteor radar, with a frequency of 33.2 MHz, transmits 7.2 km width, 4-bit complimentary coded circu-larly polarized pulses at a pulse repetition frequency of 440 Hz. The transmitter has a peak power of 12 kW and a duty cycle of 8.4 %. The receiver is composed of two perpen-dicular interferometric baselines as a standard antenna con-figuration (Jones et al., 1998) to determine the angle of arrival of backscattered signal from meteor trails (Holdsworth et al., 2004; Lee et al., 2013).
It collects underdense meteor echoes within a horizon-tal radius of about 250 km from the radar site. The number
of meteor echoes from the KSS meteor radar reaches up to 40 000 meteors per day in summer but it declines to about 15 000 in winter. The large number of meteor echoes enables us to obtain reliable meteor samples even beyond the typical meteor detection height of 80–100 km with a better temporal resolution.
In this study we used 5-year-long meteor radar data from 2012 to 2016 to ensure better statistics of meteor distribution, even under the minimized meteor detection rate in winter. The phase difference error of meteor echoes derived from six receive antenna pairs is limited to be less than 6◦to determine the most accurate meteor height distribution. In deriving a linear relationship between the width of meteor height dis-tribution and the SABER temperature, the geometric height of meteor echoes was converted to geopotential height in or-der to correctly compare it with the proportionality constant derived from the fundamental hydrostatic equation.
2.2 TIMED/SABER
The Sounding of the Atmosphere using Broadband Emission Radiometry (SABER) instrument is one of four instruments on NASA’s TIMED (Thermosphere Ionosphere Mesosphere Energetics Dynamics) satellite to measure the limb emis-sion in the 10 broadband infrared channels covering 1.27 to 17 µm. The profile of kinetic temperature is obtained from the 15 µm radiation of CO2from 15 to 120 km altitude.
The SABER instrument views the atmospheric limb per-pendicular to the satellite orbital track in an altitude of about 625 km and an inclination of 74◦. In order to keep the SABER instrument on the anti-sunward side, the TIMED satellite performs yaw maneuvers about every 60-day period. Consequently, the latitude coverage on a given day extends from about 52◦ in one hemisphere to 83◦ in the other, and
this results in only 6 months of SABER data available ev-ery year in high-latitude regions above 52◦. The height res-olution of the data varies with altitude and it is about 2 km in the region of meteor detection. The SABER data used in this study are version 2.0, which includes non-LTE (non-local thermodynamic equilibrium) temperature inversions in the upper mesosphere and lower thermosphere due to the de-parture from LTE in the CO215 µm vibration–rotation band
for the kinetic temperature determination above 70 km alti-tude (Mertens et al., 2001, 2004). The SABER temperature and geopotential height data were restricted to the distance of less than 500 km from the location of KSS to directly com-pare with the FWHM derived from meteor radar observations during the period of 2012–2016.
3 Theoretical consideration of FWHM and temperature
G
e
o
p
o
te
n
ti
a
l
h
e
ig
h
t
(k
m
) P2
P1
2012 2013 2014 2015 2016
Year 75
80 85 90 95 100
4.0 3.5 3.1 2.6 2.1 1.6 1.2
[image:3.612.48.285.69.246.2]log10P (hPa)
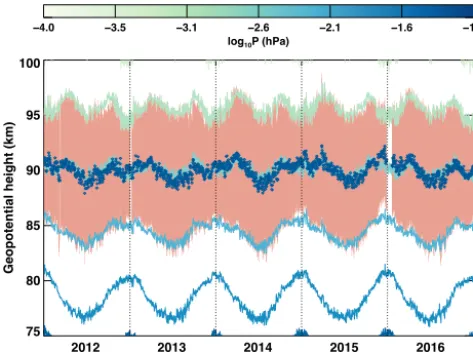
Figure 1.Temporal evolution of constant pressure surfaces of the neutral atmosphere from Aura MLS (both filled and line contours) and meteor peak detection heights (blue open diamond) with full width at half maximum (FWHM) of meteor height distribution (red shaded area) from meteor radar observations at King Sejong Sta-tion, Antarctica, in 2012–2016. Two constant atmospheric pressure (P1,P2) levels that are strongly correlated with the FWHM are also
presented.
primarily determined by background atmospheric pressure. Figure 1 shows the MPH (blue open squares) and FWHM (red-shaded area) obtained from the fitting procedure with a Gaussian curve applied to the daily meteor height distribu-tion from 2012 to 2016. The background atmospheric pres-sure field from the MLS meapres-surement is also presented by solid line contours. It is important to note that the MPH closely follows the constant pressure level and a fixed por-tion of the height distribupor-tion (i.e., FWHM) of observed me-teor echoes exists within two constant pressure levels around the MPH as shown in Fig. 1. As meteors penetrate into the Earth’s atmosphere down to about 120 km height, they pro-duce meteor trails, which are composed of metallic ions and electrons by collisions with atmospheric constituents (Love and Brownlee, 1991; Rogers et al., 2005). This collisional heating process is critically affected by background atmo-spheric pressure, which is a function of density and temper-ature. Therefore, the height distribution of meteor echoes, represented by the FWHM, is determined by the state of the background atmosphere.
The linear relationship between the FWHM and tempera-ture can be derived from the conventional atmospheric stat-ics; the variation of pressure with height can be determined from the ideal gas law and the hydrostatic equation (Andrew et al., 1987):
∂lnP
∂z = −
g
RT, (1)
wheregandRare the gravitational acceleration and gas con-stant, respectively. After a simple rearrangement for sepa-ration of variables, both sides in Eq. (1) can be integrated over the region between two given constant pressure levels ofP1(Z1)andP2(Z2)to obtain the hypsometric equation:
Z2−Z1=
R g
Z P1
P2
Td lnP . (2)
The height differenceZ2−Z1in Eq. (2) corresponds to an
atmospheric layer between the two constant pressure levels. Since the FWHM of the meteor height distribution nearly co-incides with the atmospheric layer as in Fig. 1, it can be used to estimate the mean temperature of the layer from Eq. (2):
hTi =C·FWHM, (3)
where FWHM=Z2−Z1 and the proportionality constant
C= g
R h
lnP1
P2
i−1
. Here the layer mean temperature is de-fined as
hTi =
RP1
P2Td lnP RP1
P2d lnP
. (4)
As is revealed from the definition of the layer mean temper-ature given by Eq. (4), the mean tempertemper-ature can be defined for any kind of temperature profile, even a vertically rapidly varying temperature structure in the atmosphere.
Equation (3) clearly shows that the neutral temperature near the meteor peak height can be determined by the FWHM alone with a proportionality constant. The constant can be empirically determined based on a linear relationship be-tween the observed FWHM and temperature. It turns out that the determined proportionality constant does not vary with time and can be considered to be a “constant” over the entire observation period. The constant can also be estimated with pressure measurements from SABER observations. From 5-year averaged values of log10P1= −2.07±0.044, log10P2=
−2.95±0.009 from the SABER pressure measurements dur-ing the period of 2012–2016, the ratio between two pressure levels,P1/P2, is determined to be 7.59. Then the
proportion-ality constant in Eq. (3) can be estimated to be about 16.28 when the gravitational constantgand gas constantRare ap-proximately 9.47 and 287.06, respectively, in the region of given pressure levels ofP1 andP2 near 90 km altitude. In
the following section, we will empirically determine the con-stant using the measurements of FWHM and temperature and will compare it with the estimated constant from the pressure measurements.
4 Results and discussions
4.1 Empirical estimation of the proportionality constant
2013
6 8 10 12 14 16
FWHM (km) 100
120 140 160 180 200 220 240
M
L
S
/S
A
B
E
R
te
m
p
er
at
u
re
(
K
)
(a) (b) 2012–2016
6 8 10 12 14 16
FWHM (km) 100
120 140 160 180 200 220 240
S
A
B
E
R
te
m
p
er
at
u
re
(
K
)
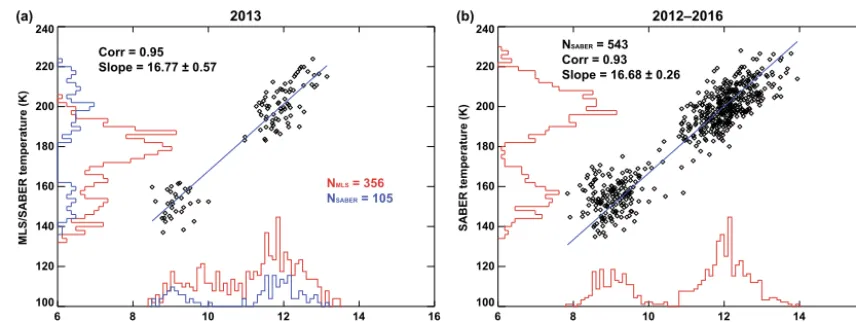
Corr = 0.95 Slope = 16.77 ± 0.57
NMLS = 356 NSABER = 105
NSABER = 543
[image:4.612.82.510.65.226.2]Corr = 0.93 Slope = 16.68 ± 0.26
[image:4.612.162.434.326.432.2]Figure 2.Scatter plots of the daily FWHM of the meteor height distribution versus the average value of the SABER temperatures near the mesopause region at King Sejong Station in(a)2013 and(b)the 5 years from 2012 to 2016. The blue solid line depicts the linear regression. The histograms of the two independent temperature measurements from the SABER (blue) and MLS (red) and FWHM data are also presented to show the number of data used in the linear least squares.
Table 1.Slope values and correlation coefficients exhibiting a linear relationship between the SABER temperature and the FWHM from the meteor radar at KSS from 2012 to 2016.
Year Number Slope Rg
h ln
P1
P2 i−1
Correlation
of data coefficient
2012 112 16.56±0.51 16.17 0.95
2013 105 16.77±0.57 16.29 0.95
2014 109 16.90±0.56 16.29 0.94
2015 108 16.62±0.64 16.09 0.94
2016 109 16.54±0.56 16.31 0.94
2012–2016 543 16.68±0.26 16.28 0.93
the proportionality constant during the period of 2012–2016. Figure 2 shows the scatter plots of the daily FWHMs de-rived from the KSS meteor radar versus theTSABERat around
87 km for the year of 2013 (a) and for the entire observation period of 2012–2016 (b). In contrast to MLS temperature data used in our previous study (Lee et al., 2016), SABER temperature measurements above KSS are only available in its south viewing geometry due to yaw maneuvers about ev-ery 60 days. This observational limitation gives rise to fewer temperature data points available for the determination of the proportionality constant, which is why there are few data points in the middle of the scatterplot in Fig. 2. Nevertheless, it has a much better height resolution than MLS temperature measurement: the height resolution of SABER observations is about 2 km, while the resolution of MLS observations is about 10–13 km, which is almost comparable to the FWHM. This characteristic of SABER observations allows us to find the representative altitude of the estimated temperature from the FWHM (Liu et al., 2017).
There is an obvious linear relationship between TSABER
and FWHM with notably high correlation coefficients. The slopes in Fig. 2 represent the proportionality constant
be-tween the FWHM andTSABER. Table 1 shows yearly slopes
Correlation of FWHM with TSABER
0.0 0.2 0.4 0.6 0.8 1.0 Correlation coeff. (r)
MPH
75 80 85 90 95 100
G
PH
(k
m
)
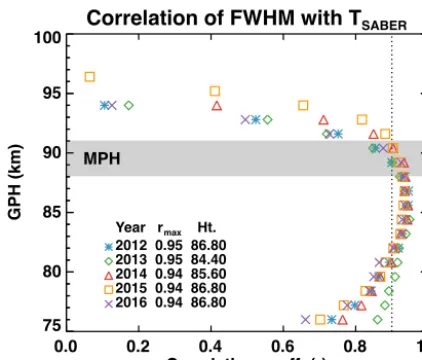
[image:5.612.61.272.66.246.2]2012 0.95 86.80 2013 0.95 84.40 2014 0.94 85.60 2015 0.94 86.80 2016 0.94 86.80 Year rmax Ht.
Figure 3.The height profile of correlation coefficient of the FWHM and SABER temperatures in 2012–2016. The height information of the maximum correlation coefficient and its value in each year are also summarized. The dotted vertical line indicates a correlation coefficient of 0.9, and the gray shaded box denotes the height range of the MPH variation during the observation period.
4.2 Meteor echo height ceiling effect on the temperature estimation
The estimated temperature using Eqs. (2)–(4) is the mean temperature between the two constant pressure levels as shown in Fig. 1. It therefore seems plausible that the mean temperature represents the temperature at around the me-teor peak height (MPH) for the pressure levels around the FWHM. In order to confirm this representative altitude of the estimated temperature with the FWHM, we performed a correlation analysis between the FWHM and layer mean temperatures at different altitudes. Figure 3 shows the height profiles of the correlation coefficient between the FWHM and SABER temperature during the period of 2012–2016. For this analysis, the SABER temperatures were averaged at every 1.2 km of height within 2.4 km width to obtain daily layer mean temperatures for each year. It is clear in the fig-ure that the best correlation occurs at a slightly lower height (∼87 km) than the MPH (88–91 km) by about 3–4 km. The temperature estimation procedure using the meteor decay times, however, assumed that the representative altitude of the estimated temperature is around the meteor peak height, which is about 90 km altitude (Kim et al., 2012; Meek et al., 2013). A notable asymmetry in the correlation coefficients around the maximum correlation height is another important feature in Fig. 3. The correlation coefficient more rapidly de-creases at the altitude above the MPH than below, and this indicates that the meteor height distribution above the MPH is not only controlled by the background atmospheric state but other factors must also be involved.
The height distribution of meteor echoes detected by me-teor radar depends not only on the physical characteristics of meteors and the state of the atmosphere but also on the operational parameters of meteor radar such as a radio wave-length and a pulse repetition frequency. Meteor radar obser-vations show a limited height range of detecting meteors for a given radio wavelength. The backscattered signals from me-teor trails beyond this range are significantly attenuated to be detected (Thomas et al., 1988; Steel and Elford, 1991). This limitation is inherently present in the meteor radar observa-tions, which is known as the meteor echo height ceiling effect (MHC). Immediately after meteor ionized trails are formed, they rapidly expand in a radial direction to reach a finite ra-dial extent called an initial radius within the interval that me-teoric ions are in thermal equilibrium with surrounding atmo-sphere (Jones, 1995). As the atmospheric density decreases with increasing height, the initial radius of the meteor trail is increased and becomes greater than a quarter of the radio wavelength, which significantly attenuates echo strength due to the lack of phase coherence from the signals reflected from the different spots in the meteor trail cross-section (Younger et al., 2008). In general, the meteor trails from fast meteors are produced at higher altitudes, and hence meteor radar ob-servations miss the significant part of meteors above a certain altitude because of the MHC (McKinley, 1961; Campbell-Brown and Jones, 2003).
According to the echo attenuation theory, there are three major factors controlling the attenuation in the amplitude of meteor echoes from underdense meteor trails. Previous stud-ies reviewed these attenuation factors and quantified their in-fluences on the MHC (Thomas et al., 1988; Steel and Elford, 1991). Since the detailed examination of three attenuation factors is beyond the scope of this study, we only give a brief overview of them and find which one is the most important in meteor echo attenuation. The reduced electron density and its weighting function (zeroth-order Bessel function) oscillating in positive and negative regions with a radial distance in the meteor trail with a larger initial radius makes the backscat-tered signal too weak to be detected by radars (initial radius factor,αr) (McKinley, 1961; Younger et al., 2008). The
sig-nal attenuation is also generated by the diffusion during the time of meteor trail formation due to the finite velocity of the meteoroid (finite velocity factor,αV). If the inter-pulse period
of a meteor radar is comparable to or longer than the meteor decay times, it is more likely that the meteor trail detected by one pulse decays below the threshold of meteor recognition before the arrival of a successive pulse (pulse repetition rate factor,αP).
2014
0.0 0.2 0.4 0.6 0.8 1.0 Attenuation coefficient
75 80 85 90 95 100 105
G
PH
(k
m
)
50 100
Total atten. coeff. (%)
2014 2015 2016 𝜶r
𝜶P 𝜶V
(a) (b)
Figure 4. (a)The height variation of the three yearly mean attenu-ation coefficients and their 1 standard deviattenu-ation values (color-filled horizontal bars) calculated from the KSS meteor radar observations in 2014, and(b) the normalized percentage of yearly mean total attenuation coefficients in 2014–2016.
should be noted that proportionality constants derived from a least-squares method using the SABER temperature and the FWHM are slightly larger (1.4 %–3.7 %) than values from Eq. (3) with SABER pressure measurements as shown in Ta-ble 1. The underestimated FWHM due to the MHC proba-bly makes a systematic difference between the two constants over the entire observational period. In this study, we cal-culated the three attenuation coefficients using key parame-ters obtained from meteor radar observations to examine how much the FWHM can be affected by the MHC and how it can influence the temperature estimation.
We applied an attenuation theory described in Steel and Elford (1991) and Ceplecha et al. (1998) to the KSS me-teor radar data to calculate the attenuation coefficients. Fig-ure 4 presents the height profiles of three attenuation co-efficients with standard deviations calculated from the data in 2014. Because the KSS meteor radar has a large pulse repetition frequency, the inter-pulse period is much shorter than decay times of most observed underdense meteor trails. Hence, the pulse repetition rate factor (blue filled triangle) should be negligible in the meteor signal attenuation through-out all the altitude region, and the net attenuation of meteor echoes is dominated byαrandαVas depicted in Fig. 4. The
αr, in particular, dramatically decreases as the initial radius
(r0)increases with height. This indicates that the amplitude
of radar signals scattered from meteor trails is severely de-clined at higher altitudes above about 95 km. As for the fi-nite velocity factor, αV, since it is basically related to the
background atmospheric state, the height variation ofαV
re-markably coincides with that of meteor decay times, which steadily decreases with height because of the exponential de-crease of the background pressure within about 82–97 km
0 500 1000 1500 2000
70 80 90 100 110
0 500 1000 1500 2000
Meteor number 70
80 90 100 110
G
PH
(k
m
)
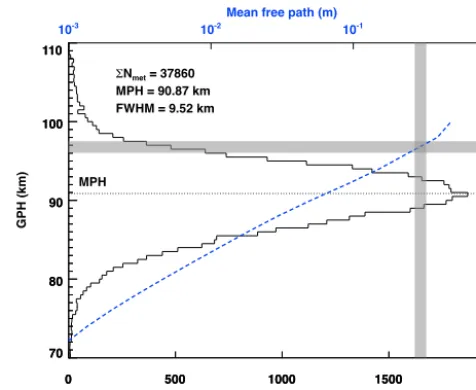
Nmet = 37860
MPH = 90.87 km FWHM = 9.52 km
10-3 10-2 10-1 1
Mean free path (m)
[image:6.612.309.547.66.261.2]MPH
Figure 5.The histogram of a meteor height distribution observed by the KSS meteor radar on a single day in 2016 using a 500 m bin. The blue dashed line presents the mean free path of the background at-mosphere calculated from the MLS observations. The gray-colored horizontal bar indicates the height layer where a rapid decrease in meteor detection rate due to the meteor echo height ceiling appears. The typical range of the molecular mean free path that activates the meteor echo height ceiling due to the initial radius and finite veloc-ity factors is depicted by a gray-colored vertical bar.
altitude range (Singer et al., 2008; Kim et al., 2010). As shown in Fig. 4, the MHC generated byαrandαV reaches
[image:6.612.48.285.68.249.2]me-teor trails is about 1–2 m at the altitude of 95 to 100 km for a meteoroid falling with a speed of 40 km s−1, and they
de-duced a relationship between meteor speedV and the initial radius ri:ri∼V−0.2. The molecular mean free path is
ap-proximately one-third of the initial radius (Manning, 1958). When the MHC is most effective at around 97 km altitude (see Fig. 5), the mean free path is about a few tens of centime-ters with the initial radius of about 2–3 m, which corresponds to approximately a quarter of the wavelength of the KSS meteor radar (9.03 m). This indicates that the MHC occurs within a fixed range of the mean free path as shown in previ-ous studies (Pellinen-Wannberg and Wannberg, 1994; West-man et al., 2004); in other words, it occurs in a certain at-mospheric state. For the KSS meteor radar, the MHC mostly occurs at around 97 km altitude, which exists way above the MPH as shown in both Figs. 4 and 5. Consequently, it can be concluded that the MHC affecting meteor height distribu-tion above the MPH is mainly controlled by the background atmospheric condition, and in turn, this provides an essential validation of the temperature estimation from the FWHM.
5 Conclusions
In this study, the temperature estimation procedure from the FWHM is reevaluated by verifying the temporal invari-ance of the proportionality constant between the FWHM and mesospheric temperature over the entire observation period of 2012–2016. Their linear relationship with a proportional-ity constant is experimentally demonstrated from the SABER temperature and meteor radar observations in the 5-year ob-servation period. The slope of the SABER temperature and FWHM is more consistent with the theoretically derived pro-portionality constant than those from the MLS temperature in Lee et al. (2016). Compared to the MLS data, much bet-ter vertical resolution of the SABER temperature enabled us to find that the mesospheric temperature estimated from the FWHM represents the temperature at around 87±2 km alti-tude, which is slightly lower than the meteor peak height by about 2–3 km. The lower representative altitude of the esti-mated temperature results from the asymmetric meteor echo distribution, with much lower meteor detection rates above the MPH, which is caused by the meteor echo height ceiling effect (MHC). Since the MHC reflects the background atmo-spheric state well, the FWHM derived from the KSS meteor radar can be used to estimate mesospheric temperature accu-rately.
Data availability. The TIMED/SABER data are available from the SABER data services by following the link: http://saber.gats-inc. com/data.php (last access: 12 May 2018). The Aura/MLS data can be accessed at the NASA GES DISC by following the link: http://disc.sci.gsfc.nasa.gov/Aura/data-holdings/MLS (last access: 12 May 2018). King Sejong meteor radar data are available from the Korea Polar Research Institute upon request.
Author contributions. CL developed the main idea of this study and prepared the manuscript. GJ is the principal investigator of the polar space environment research project. JK provided King Sejong me-teor radar data. IS helped interpret the observational data. All the authors contributed to the discussion as a team effort.
Competing interests. The authors declare that they have no conflict of interest.
Acknowledgements. This study was supported by grant PE18020 from the Korea Polar Research Institute. The authors would like to thank the TIMED SABER team for providing the kinetic temperature and geopotential height (version 2.0) data. The Aura MLS team is also gratefully acknowledged for providing the geopotential height and pressure data.
The topical editor, Huixin Liu, thanks two anonymous referees for help in evaluating this paper.
References
Andrew, D. G., Holton, J. R., and Leovy, C. B.: Middle Atmosphere Dynamics, 498 pp., Academic, San Diego, California, 1987. Campbell-Brown, M. and Jones, J.: Determining the initial radius of
meteor trains: fragmentation, Monthly Notice of the Royal Astro-nomical Society, 343, 775–780, https://doi.org/10.1046/j.1365-8711.2003.06713.x, 2003.
Ceplecha, Z., Boroviˇcka, J. Í., Elford, W. G., ReVelle, D. O., Hawkes, R. L., Porubˇcan, V. Í., and Šimek, M.: Meteor phenom-ena and bodies, Space Sci. Rev., 84, 327–471, 1998.
Cervera, M. A. and Reid, I. M.: Comparison of atmospheric param-eters derived from meteor observations with CIRA, Radio Sci., 35, 833–843, https://doi.org/10.1029/1999RS002226, 2000. Chilson, P. B., Czechowsky, P., and Schmidt, G.: A
compari-son of ambipolar diffusion coefficients in meteor trains using VHF radar and UV lidar, Geophys. Res. Lett., 23, 2745–2748, https://doi.org/10.1029/96GL02577, 1996.
Eshleman, V. R.: The Theoretical Length Distribution of Ionized Meteor Trails, J. Atmos.-Terr. Phys., 10, 57–72, 1957.
Holdsworth, D. A., Reid, I. M., and Cervera, M. A.: Buckland Park all-sky interferometric meteor radar, Radio Sci., 39, RS5009, https://doi.org/10.1029/2003RS003014, 2004.
Jones, J. and Campbell Brown, M.: The initial train radius of sporadic meteors, Mon. Not. R. Astro. Soc., 359, 1131–1136, https://doi.org/10.1111/j.1365-2966.2005.08972.x, 2005. Jones, J., Webster, A. R., and Hocking, W. K.: An improved
interfer-ometer design for use with meteor radars, Radio Sci., 33, 55–65, https://doi.org/10.1029/97RS03050, 1998.
Jones, W.: Theory of the initial radius of meteor trains, Mon. Not. R. Astro. Soc., 275, 812–818, 1995.
Kim, J.-H., Kim, Y. H., Lee, C. S., and Jee, G.: Seasonal variation of meteor decay times observed at King Sejong Station (62.22◦S, 58.78◦W), Antarctica, J. Atmos. Sol.-Terr. Phys., 72, 883–889, https://doi.org/10.1016/j.jastp.2010.05.003, 2010.
strong meteor trails, J. Atmos. Sol.-Terr. Phys., 89, 18–26, https://doi.org/10.1016/j.jastp.2012.07.003, 2012.
Lee, C., Kim, Y. H., Kim, J.-H., Jee, G., Won, Y.-I., and Wu, D. L.: Seasonal variation of wave activities near the mesopause region observed at King Sejong Station (62.22◦S, 58.78◦W), Antarctica, J. Atmos. Sol.-Terr. Phys., 105, 30–38, https://doi.org/10.1016/j.jastp.2013.07.006, 2013.
Lee, C., Kim, J.-H., Jee, G., Lee, W., Song, I.-S., and Kim, Y. H.: New method of estimating temperatures near the mesopause re-gion using meteor radar observations, Geophys. Res. Lett., 43, 10580–10585, https://doi.org/10.1002/2016GL071082, 2016. Liu, L., Liu, H., Le, H., Chen, Y., Sun, Y.-Y., Ning, B.,
Hu, L., Wan, W., Li, N., and Xiong, J.: Mesospheric temperatures estimated from the meteor radar observations at Mohe, China, J. Geophys. Res.-Space, 122, 2249–2259, https://doi.org/10.1002/2016JA023776, 2017.
Love, S. G. and Brownlee, D. E.: Heating and thermal transforma-tion of micrometeoroids entering the earth’s atmosphere, Icarus, 89, 26–43, 1991.
Manning, L. A.: The Initial Radius of Meteoric
Ion-ization Trails, J. Geophys. Res., 63, 181–196,
https://doi.org/10.1029/JZ063i001p00181, 1958.
McKinley, D. W. R.: Meteor Science and Engineering, McGraw-Hill, New York, 1961.
Meek, C. E., Manson, A. H., Hocking, W. K., and Drummond, J. R.: Eureka, 80◦N, SKiYMET meteor radar temperatures com-pared with Aura MLS values, Ann. Geophys., 31, 1267–1277, https://doi.org/10.5194/angeo-31-1267-2013, 2013.
Mertens, C. J., Mlynczak, M. G., López-Puertas, M., Wintersteiner, P. P., Picard, R. H., Winick, J. R., Gordley, L. L., and Russell III, J. M.: Retrieval of mesospheric and lower thermospheric ki-netic temperature from measurements of CO215-mm Earth limb
emission under non-LTE conditions, Geophys. Res. Lett., 28, 1391–1394, 2001.
Mertens, C. J., Schmidlin, F. J., Goldberg, R. A., Remsberg, E. E., Pesnell, W. D., Russell, J. M., Mlynczak, M. G., López-Puertas, M., Wintersteiner, P. P., Picard, R. H., Winick, J. R., and Gord-ley, L. L.: SABER observations of mesospheric temperatures and comparisons with falling sphere measurements taken during the 2002 summer MaCWAVE campaign, Geophys. Res. Lett., 31, L03105, https://doi.org/10.1029/2003GL018605, 2004.
NASA GES DISC: The Aura/MLS data, available at: http://disc. sci.gsfc.nasa.gov/Aura/data-holdings/MLS, last access: 12 May 2018.
Olsson-Steel, D. and Elford, W. G.: The true height distribution and flux of radar meteors, in: European Regional Astronomy Meeting of the IAU, 67, 193–197, 1987.
Pellinen-Wannberg, A. and Wannberg, G.: Meteor observations with the European Incoherent Scatter UHF Radar, J. Geophys. Res., 99, 11379–11390, https://doi.org/10.1029/94JA00274, 1994.
Rogers, L. A., Hill, K. A., and Hawkes, R. L.: Mass loss due to sput-tering and thermal processes in meteoroid ablation, Plan. Space Sci., 53, 1341–1354, 2005.
SABER data services: The TIMED/SABER data, available at: http: //saber.gats-inc.com/data.php, last access: 12 May 2018. Singer, W., Latteck, R., Millan, L. F., Mitchell, N. J., and Fiedler,
J.: Radar Backscatter from Underdense Meteors and Diffusion Rates, Earth, 102, 403–409, https://doi.org/10.1007/s11038-007-9220-0, 2008.
Steel, D. I. and Elford, W. G.: The Height Distribution of Radio Meteors – Comparison of Observations at Different Frequencies on the Basis of Standard Echo Theory, J. Atmos.-Terr. Phys., 53, 409–417, https://doi.org/10.1016/0021-9169(91)90035-6, 1991. Thomas, R. M., Whitham, P. S., and Elford, W. G.: Response of high
frequency radar to meteor backscatter, J. Atmos.-Terr. Phys., 50, 703–724, https://doi.org/10.1016/0021-9169(88)90034-7, 1998. Tsutsumi, M., Tsuda, T., Nakamura, T., and Fukao, S.: Temperature
fluctuations near the mesopause inferred from meteor observa-tions with the middle and upper atmosphere radar, Radio Sci., 29, 599–610, https://doi.org/10.1029/93RS03590, 1994. Westman, A., Wannberg, G., and Pellinen-Wannberg, A.: Meteor
head echo altitude distributions and the height cutoff effect stud-ied with the EISCAT HPLA UHF and VHF radars, Ann. Geo-phys., 22, 1575–1584, https://doi.org/10.5194/angeo-22-1575-2004, 2004.