— sustainable food systems around the Baltic sea
Editors:
Helena Kahiluoto
Per G Berg
Arthur Granstedt
Holger Fisher
Olof Thomsson
Interdisciplinary Synthesis of the BERAS project
ThE powER of locAl
Centrum för uthålligt lantbruk
The Power of Local
- sustainable food systems around the Baltic sea
Interdisciplinary Synthesis Report of the BERAS project
Centrum för uthålligt lantbruk SLU
Box 7047 750 07 Uppsala
Centre for Sustainable Agriculture
Swedish University of Agricultural Sciences S-750 07 Uppsala
Authors are responsible for the factual contents of the report
Cover photo by Hans Månsson, Bild & Mening.
The photo is taken at a Farmers Market at Katarina Bangata in Stockholm in the autumn 2005.
ISBN: 91-576-7160-5 Antal sidor: 67 67 pages
Material and methods
This chapter introduces the cases and the disciplinary approaches and
methods. Details can be found in the work package reports (see List of work package reports of the BERAS project at the end of this report, for the
scope of each workpackage see Fig. 2). The actor participation and the
interdisciplinary process are also described.
The BERAS study had a case study approach, and this report presents
the interdisciplinary synthesis of the multidisciplinary study (see Concep-tual Framework for definitions). Ultimately, the BERAS study attempted
to clarify the potential impacts of enhanced localisation and recycling rather than to compare the average status of the present local, organic food systems and organic farms with the dominant food systems and agriculture. Those parts of the BERAS case study work utilised in the interdisciplinary synthesis are itemised below. For the case food systems and case farms utilised, see Table .
• Study of the initiatives in local, organic food and the interactions between actors conducted through interviews and workshops, with a historical perspective included
• The situation as perceived by actors in the local, organic food chains was compared with the situation in the dominant conven- tional food chains represented in the case food systems
• Monitoring of the purchase of local, organic food by consumer groups
• Investigation of present waste management and discussion of the potential for enhanced recycling
• Comparison of the state of the case farms with national statistics • Drawing up of scenarios on the basis of the case farms for exami- nation of the prerequisites and potential for and the effects of further localisation and enhancement of recycling on the case farms, and for assessment of the impact of converting all agricul ture within the drainage area of the Baltic Sea to recycling, organic agriculture
• Reviews of the literature
• Discussion of the obstacles and alternative solutions identified
with the above-mentioned approaches, carried out with stakehol-
ders for purposes of feed-back, revision and verification
Triangulation of data sources (e.g., cases), investigators, theories and
methods was carried out. The disciplinary work was done in interac-tion with an interdisciplinary process to create a synthesis that would provide answers to the common research questions.
case food systems: location, description and aspects studied
The BERAS study was based on case food systems in the eight partici-Helena Kahiluoto
Countr y Case scale Inhabit ants/km² countr y/county/municipality A ge d ist rib uti on in
the municipality (%)
U nem plo yment r at e1 (%) countr y/county Organic pr oduction (%) countr y/county/municipality Special f eatur es Sw eden Far ms, village (countr y) 20/1 51/23 0-1 4 15-2 4 25-44 45-65 Ov er 6 4 20 14 26 25 15 6,5/5,7 7/6/43 D ec la re d a s a n “ Ec olo gic al m un icip alit y” in 19 93 . A ntr op os op hy -in sp ire d m ov em en t w ith p io ne eri ng biodynamic f ar
ming and pr
ocessing. Finland Far ms, m un ic ip ali ty ( co un -tr y) 17/1 2/6 0-1 4 15-2 4 25-44 45-65 Ov er 6 4 15 10 22 31 22 8,8/1 2,5 7/7 ,9/1 6 D ec la re d as a n “E co lo gic al co un ty ” du rin g 19 80 ’s. P io ne er in g m un ic ip ali ty in o rg an ic pr oduction. Str
ong local identity
. Denmar k Fa rm s an d its c us to -mers, county 125/1 35/6 7 N o dat a a vailable 6,4/7 ,3 6/1 ,9/-Biodynamic far m and consumer mo vement, bo x sc heme st ar ted 1 99 4. Ger man y Fa rm a nd it s cu sto -mers 230/30/1 5 0-1 4 15-2 4 25-44 45-65 Ov er 6 4 17 11 33 16 23 10,3/1 8,4 4/-/-V illage wit h a for mer ly st at e-o wned far m in East G er m an y, no w o w ne d by a n en th us ia stic a nd activ e f ar mer . Est onia V illage 30/230/2 7 N o dat a a vailable 9,7/- 4/-/-A nth ro po so ph y- in sp ire d C am ph ill co m m un ity , initiativ e f
or adults wit
h special needs.
Lit huania Municipality , county 52/85/2 7 0-1 4 15-6 4 Ov er 6 4 21 56 23 11 ,4/8,5 0,3/-/1 ,0 Lo ca l m ar ke tin g th ro ug h or ga nic p ro du ce r cooper ativ e Latvia County 36/1 6/1 6 N o dat a a vailable 10,4/- 2/-/-90% of far ms ar e ver y small. Regional organic initiativ es wit h cooper ation be tw een f ar ms. Poland Municipality , county 12 4/78/1 84 0-1 9 20-29 30-49 50-65 0v er 6 4 28 15 29 16 12 19,0/1 7,8 -/-/-Pioneer ing in organic and local pr ocessing and mar ke ting initiativ es. Table 1 .
Demographic and socio-economic featur
es of the eight case food systems.
1
)Eur
ostat news r
elease 126/2005 and national statistics for 2004.
2
)Or
ganic farming as per
centage of the total utilised agricultural ar
ea in 2002. Eur
ostat, Eur
opean Envir
5 pating countries around the Baltic Sea and on 4 case farms, some of
them included in the case food systems and some of them outside (Fig. 5, Table 1). The former farms were organic farms typical for the case food
system, while the latter were organic farms with advanced recycling.
The farms with advanced recycling had at least 85% self-sufficiency in
fodder and also produced bread grain or other cash crops for human
consumption. The main focus was on one Swedish (Järna) and one Fin
-nish (Juva) rural food system, where initiatives had been taken by actors in local, organic food, the first more than 40 years ago (for the location of the case food systems, see Figure 5).
0 ,0 1 0 ,0 2 0 ,0 3 0 ,0 4 0 ,0 5 0 ,0 6 0 ,0 7 0 ,0 8 0 ,0
Latvia
LithuaniaPolandSwedenGermanyFinlandDenmarkEstonia
p rim a ry p ro d uc tio n s e c o nd a ry p ro d uc tio n s e rvic e s
Figure 6. Employment by industry. Employees in manufacturing and construction are included in secondary
production, and employees in trade and transport in services 2005 (http://www.tilastokeskus.fi/tup/maa
-num/12_tyolliset.xls).
80,0
60,0 70,0
50,0
10,0 20,0 30,0 40,0
0,0
primary production secondary production services
Latvia Finland
Ger man
y
Sweden
Poland
Lithuania Est
onia Denmar
k
Food systems, especially their demographic, social, cultural, econo-mic and political characters, and the role and structure of agriculture
differ markedly in the eight countries (Table 1, Fig. 6). It follows from
this that the locality and degree of recycling, as well as the obstacles to
the further development of locality and recycling, vary significantly.
Sweden, Finland, the former West Germany and Denmark were indu-strialised early under conditions of market economy, thanks in part to policies aimed at reducing the cost of food, raising farm income and releasing labour for other industries. Their agriculture is intensive and based on external inputs. In the former Soviet countries Estonia, Latvia
and Lithuania and in the former German Democratic Republic (GDR),
agriculture was industrialised only after the second world war and as part of a planned economy. But some small-scale subsistence farming continued to exist. In these countries, and in Poland, the switch to a market economy occurred as late as 990, when large, market-oriented farms emerged. In Poland, where most farms were privately owned even before the political upheaval in 989, agriculture is clearly less industrialised than in EU and other post-communist countries. In 000, only half of Polish farms produced primarily for the market, and 70% of farms were smaller than 5 ha. With the admission of the Baltic countries and Poland to the EU in 004, agriculture faced the challenge of integration.
The available field area per capita in the Baltic Sea drainage area
7 ha in Latvia and Lithuania according to the HELCOM reports for the year 000. In Sweden and Finland, there is a strong tendency for crop production and animal husbandry to be regionally separated, while the whole Denmark is devoted to animal production. Two thirds of Danish animal production is exported, and half of the fodder is imported. Most farms in the Baltic countries are mixed farms. Agriculture in the Baltic countries collapsed after 99 due to the loss of the Soviet market, and all three countries relied on subsidised imports from the EU until they themselves joined to EU. In the Baltic countries and Poland, industrial food systems exist side by side with the local ones, organic farming is in its initial stages, though developing quickly, but the organic market is almost non-existent. In Sweden, Denmark, Germany and Finland, local food systems have a marginal position, though they are gaining ground as a viable option; the organic branch has an established share and is growing at a varied rate. The nutrient surplus on the drainage area and thus the load from agriculture to the Baltic Sea is clearly highest in Denmark, but high also in Sweden and Finland. It is lower in Poland and Germany and very low in the three Baltic countries. The load per capita from Polish agriculture is only a third of that from agriculture in Sweden and Finland.
The representativeness of the cases for each country, and for rural food systems around the Baltic Sea, varies markedly, but together the cases provide a representative picture. For example, Järna in Sweden
is located close to the Stockholm market (Figure 5). The region has a
high proportion of immigrants. The average farm size is considerably larger than the average in Sweden and proportions of the land in the region in both agriculture and urban use are high. Järna also has some
special cultural features (Table 1). Juva in Finland, on the other hand,
represents a rural county where economic growth and productivity of work are among the lowest in the country. Agriculture, especially milk production, and forestry are of greater importance than in Finnish rural areas in general. Although food processing is well-developed in Juva,
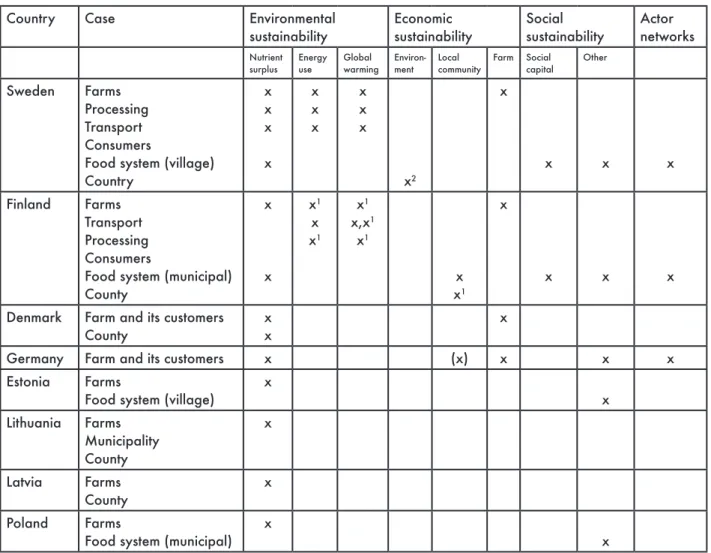
an exceptionally low proportion (5%) of the primary agricultural pro -duction of the county is processed in the region. Table shows which aspects of each case food system were studied in BERAS.
Disciplinary approaches
The indicators of sustainability (see Conceptual framework, Sustainability)
Country Case Environmental
sustainability Economic sustainability Social sustainability Actor networks
Nutrient
surplus Energyuse Globalwarming Environ-ment Localcommunity Farm Socialcapital Other
Sweden Farms
Processing Transport Consumers
Food system (village) Country
x x x
x x x x
x x x
x2
x
x x x
Finland Farms
Transport Processing Consumers
Food system (municipal) County
x
x x1
x x1
x1 x,x1
x1
x x1
x
x x x
Denmark Farm and its customers
County xx x
Germany Farm and its customers x (x) x x x
Estonia Farms
Food system (village) x x
Lithuania Farms
Municipality County
x
Latvia Farms
County x
Poland Farms
Food system (municipal) x x
Table 2. Use of the case food systems in the assessment of environmental, economic and social sustainability.
1) Results are based on a regional agro-economic (RegAE) model.
2)Results are based on a literature rewiev.
Assessment of ecological sustainability
For assessment of ecological sustainability, fields, farms, processing and
packaging, transportation, and waste management of the food system were investigated. Assessments were made as follows:
• Nutrient loads from fields were obtained by direct measurements.
• N and P balances on farms were calculated.
• Nutrient surpluses of the organic, recycling farms were compared with statistics representative of the present dominant farming system. The comparison was performed on the basis of the
primary nutrient efficiency (PNE), which indicates the ratio of
harvested nutrients to input nutrients from outside the system
(here the farm) to crop production.
• Material, N and P flows in the waste management system were identified.
9 med on farms and for different product chains including proces- sing, packaging and transportation. The consumption of primary
energy resources and global warming potential (GWP) were then
calculated.
• Use of non-renewable energy and GWP in the cases was compared
with average figures for the dominant food chains presented in
literature.
• Pesticide use and its development were approached through tional statistics.
Assessment of economic sustainability
There were six different economic analyses making use of different theoretical frameworks and methods.
• Two studies on farm economics were based on production econo- mics where the data consisted of real farm-level costs. The method was cost calculation and linear programming maximising total gross margin.
• Scenarios were developed to assess the potential gains and income forgone by enhanced localisation and recycling and evaluate the effects of incentives. Sensitivity of farm activities to changes in ces and subsidies were studied indirectly on the basis of validity ranges. Numerous institutional and environmental constraints were analysed.
• A scenario was developed to describe regional economic and environmental impacts through an extended regional
output model (RegAE).
• A literature review was carried out on the costs at societal level of reducing nutrient emissions to the Baltic Sea and on the willing- ness-to-pay for this reduction.
• A study on social capital utilising the concepts of trust and resilience and data from in-depth interviews with entrepreneurs. • A consumer expenditures survey of households committed to environment and health was carried out, on the basis of food purchase diaries, and compared with national average.
Assessment of social sustainability
Since the social reality of any food system is created by actors involved in these systems, and by the relations between the different actors and
the wider social context, the alternative food systems (AFS’s) were
approached through the perspectives and perceptions of the involved actors.
Interviews based on an argumentative attitude approach were con-ducted with farmers, processors, traders, consumers and politicians in Finland, Sweden, Poland, Estonia and Germany. In all countries, the studies were conducted along the lines of qualitative attitude research
(organic mode of production and local distribution), and especially, how
do they evaluate them in terms of social sustainability? Social sustaina-bility was further viewed in terms of
• social capital/trust in the networks (see also Assessment of econo- mic sustainability),
• viability of local community, and
• equity/fairness in the distribution of control and benefits among
the actors, especially from the farmers point of view.
Actor participation
Obstacles and alternative solutions were identified on the basis of actor
interviews and workshops and the disciplinary studies described above. Semi-structured interviews and meetings were conducted in Sweden and Finland. Key informants were utilised in addition to open
partici-pation. In Sweden (Järna), meeting formats were based on Open Space Technology (first meeting addressed to positive considerations and the second to the changes needed to improve the system) and a variation of
Appreciative Inquiry. Instead of focusing on problems, the choice was
made focus first on the moments of innovation and breakthrough in the
development of the local food system at Järna. Through this approach the participants sought to discover what makes the Järna food system a positive example. The meetings were documented.
In Finland (Juva), an open meeting was arranged for all interested
actors along the food chain. Key actors were invited personally, but in addition there was an open invitation. Afterwards the discussion was closely analysed. In addition, in both Sweden and Finland, constraints on the use of local, organic food in households were monitored. A mee-ting of actors was organised at the end of the project to present, obtain feedback on, and discuss the main results and appropriate conclusions, especially the obstacles to and alternative solutions for sustainable
loca-lisation and recycling. All the main food system actor groups (farmers,
retailers, processors, institutional kitchens, municipality executive
board) were represented. Meetings between researchers and individual
actors or actor groups were also organised throughout the study.
Interdisciplinary process
BERAS was designed as a multidisciplinary study, and to begin with
there were no plans for an interdisciplinary approach. During the first
year of the study, however, it became evident that there was a tendency for the different disciplines to formulate their own research questions
and hypotheses from their own disciplinary perspectives and scientific
about a sustainable way to localise and recycle, taking into consideration the impacts on all the dimensions, and if alternative solutions were to be
presented. Klein’s (1990) classic generic model for an interdisciplinary
research process was therefore applied as far as was possible given that the design, structure and organisation of BERAS were not primarily aimed at interdisciplinary work. Hence the interdisciplinary process was considered the method to obtain the interdisciplinary synthesis, which is presented in this report. The model was as follows:
1. Problem definition
a. Defining the problem (question, topic, issue)
b. Determining all knowledge needs
c. Setting the integrative framework and appropriate questions . Division of tasks
a. Specifying particular studies to be undertaken b. Role negotiation in teams
c. Gathering current knowledge
d. Resolving disciplinary conflicts by working towards common
vocabulary
e. Communicating through integrative techniques . Integration and evaluation
a. Collating all contributions and evaluating their adequacy, relevance and adaptability
b. Integrating the individual pieces to determine a pattern of mutual relatedness and relevance
c. Confirming or disconfirming the proposed solution (answer)
d. Deciding about future management or disposition of the task project
The main deviation from the generic model was that the interdisciplinary research was started late and performed as a secondary task beside the multidisciplinary research and development, which was the main ap-proach of the study. Thus, specifying particular studies to be undertaken and role negotiation in teams were weak points as these had already
been specified in the teams from a disciplinary point of view, and there
were few opportunities for complementation. Nevertheless, the process