INVERSE BORN ALGORITHM
D.K. Hsu*, James H. Rose, and D.O. Thompson Ames Laboratory, USDOE
Iowa State University Ames, Iowa 50011 I. INTRODUCTION
Considerable progress has been made in recent years in the development of signal processing algorithms for use in ultrasonic non-destructive evaluation which yield the size, shape, and orien-tation of a flaw. This kind of flaw information is necessary in order that failure p~edictions of materials and components can be made from non-destructive tests. The signal processing algorithms
that have been developed for ultrasonics are based upon both direct and inverse approximate solutions to the elastic wave scattering problem, and cover various ranges of the parameter ka where k =
~TI
is the wave number of the ultrasound and a is a flaw size dimension. In order to use these algorithms effectively in the determination of flaw parameters, it has been found necessary to obtain measurements of the flaw at several viewing angles. At this time, there is no ultrasonic transducer available which permits this to be done efficiently and conveniently in the long and inter-mediate wavelength end of the spectrum. This region has been shown*Permanent address: Physics Department, Colorado State University, Fort Collins, CO 80523. This material is also based on work supported by the National Science Foundation under Grant No. SPI-8165038.
The Ames Laboratory is operated for the U.S. Department of Energy by Iowa State University under Contract No. W-7405-ENG-82. This work was supported by the Director of Energy Research, Office of Basic Energy Sciences.
996 D. K. HSU ET AL.
to be quite rich in flaw information and is appropriate to ultra-sonic NDE in many practical applications (e.g., thick wall sections). Thus, the ultimate purpose of this work is to develop a composite transducer which will satisfy this need and which will permit the efficient utilization of various signal processing algorithms that have been developed. The immediate purpose of this present article is to discuss various steps that have been taken in the preparation of the intermediate frequency data protocol which is essential to the design of the desired transducer.
The use of the inverse Born approximation (IBA) to characterize flaws in elastic media has recently been studied both experimentally and theoretically by several groups [1,2]. In its general form the IBA coherently sums the longitudinal to longitudinal (L+L) (or transverse to transverse) scattering amplitude for all angles of incidence. As noted by Rose et al. [3], ellipsoidally shaped flaws can be characterized by treating each scattering record independently. '.chis algorithm (the one dimensional inverse Born approximation, l-D IBA) uses the L+L scattering amplitude in a single direction as the input. Its output is an estimate of the distance from the center of the flaw to the front surface tangent plane. The l-D IBA has been studied experimentally for the case of voids and less extensively for inclusions. In this paper we continue the experi-mental characterization of the l-D IBA. Two particular features of the algorithm were chosen for study. First, we used the algorithm to size a set of several different types of inclusions. It will be shown from this study that the algorithm can size an inclusion accurately using pitch-catch as well as pulse-echo data. For some of the inclusions studied, characteristic reasonances occurred in the flaw's excitation spectrum. The effect of these reasonances on the inversion algorithm was studied.
II • EXPERIMENTAL TECHNIQUE
In order to make a systematic study of the quantitative charac-terization of inclusion flaws, it is desirable to have a set of samples containing inclusions of known size, shape, orientation and material property. We have developed a sample fabrication technique
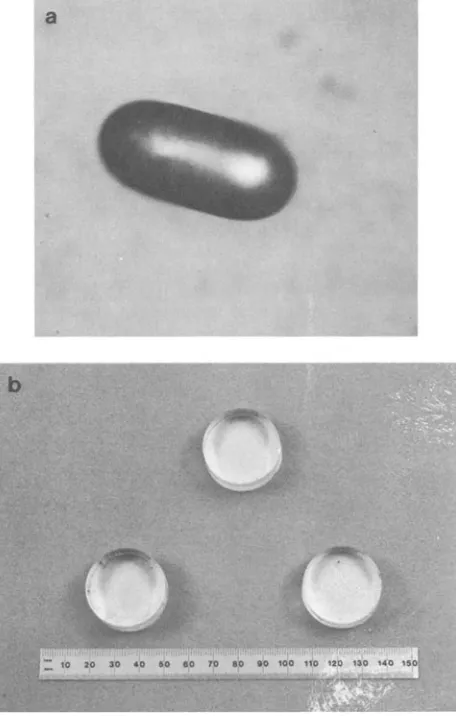
in which spherical and nonspherical inclusions of various size and material are imbedded in a thermoplastic host. Since these samples are transparent, they have the distinct advantage of allow-ing comparisons to be made between the ultrasonically reconstructed results and the direct optical measurements. This is particularly convenient for studying arbitrarily oriented nonspherical inclusions.
The starting material of the host is Buehler's TRANSOPTIC, a thermoplastic resin that cures under heat and pressure. The disk-shaped samples, 3.2 cm in diameter and approximately 1 cm in thick-ness, were formed by compression molding in a mounting press. Inclusion materials were tin-lead solder, stainless steel and tungsten carbide. The size of the inclusions ranged from 50 to
300 ~m and the depth of the inclusion was usually a few millimeters.
Figure lea) shows a microscope photograph of a stainless steel in-clusion and Fig. l(b) shows the finished samples. In addition to being transparent, these samples can be easily machined and are very inexpensive to produce. They provide the experimenter with the freedom of investigating a variety of flaw configurations.
The experiments were carried out in a circular immersion tank equipped with translational and rotational adjustments. Three transducers were positioned above the water tank, two of them mounted on goniometers, for pulse-echo and pitch-catch experiments at various angles. The transducer was driven by a Panametrics 5052
pulser-receiver to produce a broad-band ultrasonic pulse. The received signal was digitized in a Tektronix 7912 digitizer and the signal processing was done on a Tektronix 4052 desktop computer.
The implementation of the one-dimensional inverse Born approxi-mation followed the procedure described in Ref. 2. The determination of the zero of time (equivalent to locating the center of the flaw) was realized by estimating the cross-sectional area of the flaw in
the scattering direction; the zero of time was taken to be at the maximum cross-sectional area of the flaw. The effective radius was obtained by estimating the characteristic function (defined ideally as y(r)
= 1
inside the flaw and y(r)= 0
outside) from the l-D IBA asy (r)
00
sin Kr
= constant x f A (k) =;;;...:..;~
Kr
998 D. K. HSU ET AL.
a
b
: 10
Fig. 1. (a) - Photograph of a 47 x 96 ~m (semi-axes) stainless steel inclusion.
[image:4.482.127.355.153.511.2]where K is the wave number of the ultrasound, A(k) is the real part
of the longitudinal (1+L) scattering amplitude and K is the difference
between the incident and the scattered wavevectors:
1;1
=Ik.-k I.
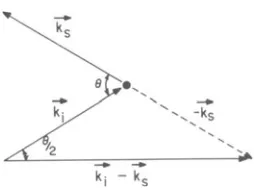
For pulse-echo scattering K is s~mply equal to 2k and for pit~h-~atchscattering K is equal to 2k cos
2'
wheree is the angle between the
transmitting and the receiving transducers, as shown in Fig. 2. The criterion used in estimating the effective radius was to take the value of r at one half the maximum value of the characteristic function.
Fig. 2. Change in wavevector in pitch-catch scattering.
III. RESULTS ON SPHERICAL INCLUSIONS
A. Characteristic Resonance of Spherical Inclusions
In applying the one-dimensional inverse Born approximation to the sizing of included flaws, one is naturally concerned with possible characteristic resonances of the inclusion. Resonant oscillations occurring in the intermediate frequency range of O.5<ka<2.5 (where a is a characteristic dimension of the flaw) could cloud data
[image:5.482.176.303.266.361.2]1000 D. K. HSU ET AL.
physical principles apply in terms of the dimensionless parameter ka. One therefore needs to address the question of what characteristic resonances might occur for a given inclusion and how would these resonances affect the inverse Born algorithm and the sizing results.
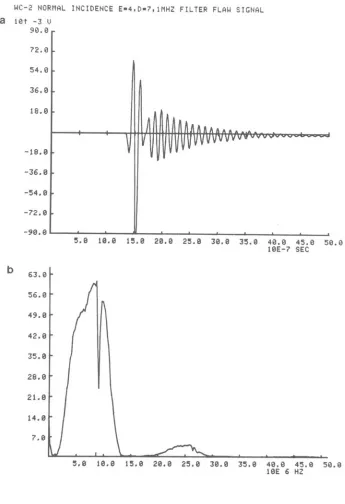
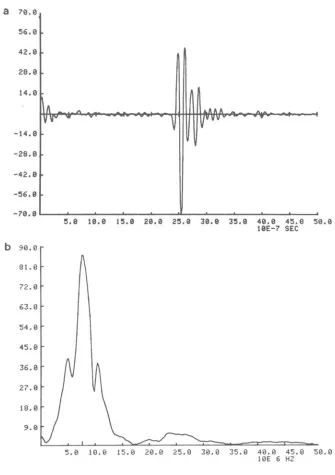
For inclusions with a high degree of geometric symmetry imbedded in an elastic medium of substantially lower acoustic impedance, sharp resonances or ringing are expected. A tungsten carbide sphere imbedded in a thermoplastic host represents such a case where the acoustic impedance of the inclusion is 35 times greater than that of the host. Given the large impedance mismatch we expected that the normal modes of vibration would be closely related to those of a free standing tungsten carbide sphere in vacuum. Figure 3 shows the scattered signal from a 198 ~m radius tungsten carbide sphere in plastic and
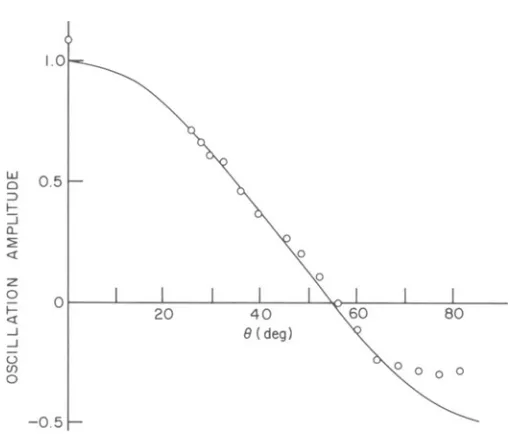
its frequency spectrum. We have measured the angular dependence of the amplitude of the 8.9 MHz resonance and the results are shown in Fig. 4. The amplitude went through zero at 9 = 55° and reappeared with the opposite phase. The angular dependence is in good agreement with the associated Legendre polynomial PZ(cos 9) = ~(3cos29-1) which goes through zero at 9=55°. This resonance was attributed to the oblate-prolate mode (S20) in the mixed mode family [6]. Measurements made in a higher frequency range revealed additional resonances at 13, 16.7 and 19.7 MHz and these were attributed to the S30' S40 and S50 modes, respectively. In Table I, we compared the k a values of tfiese resonances with the k a values taken from the mod~ chart com-piled by Fraser and LeCraw f7] for a free isotopic spherical reso-nator and obtained good agreement. (Here k is the wave vector of
the shear wave in the inclusion and a is th~ radius of the sphere). Our experimental results were also in good agreement with acoustic reflection measurements made with a hydrophone on large tungsten carbide spheres suspended in water [5].
In the mixed mode family, the lowest frequency resonance, the S20 mode, of a free sphere occurs at k a~2.7 and this value is essentially independent of the matfiria~ properties fte.g., Poisson's ratio). Rewriti~g k a=2. 7 as kl <V R, IVl.) =2.7 where V J/. is the longi-tudinal velocity in ~he host, V is t«e shear ve1ocl.ty in the inclusion and k is the longitudinal wave vector in the host, one can therefore see that the R20.mode of osci11ationhwou1d occur at a ka value less than 2.7 if VR,5Vl. and at ka>2.7 if VR,<Vl.. Since 0.5<ka<2.5 is usually taken toSbe the minimum frequen~y bandwidth requirement for the one-dimensional inverse Born algorithm, a reso-nance occurring at ka<2.7 might degrade the inversion algorithm; however, the strength and sharpness of the resonance must also be
taken into account in assessing its influence on the inverse Born algorithm. For the tungsten carbide sphere, the S2Q resonance occurs at ka=4 and is not expected to interfere severely ~1tb the inverse
WC-2 NORMAL INCIOENCE E-4.0-7,lMHZ FILTER FLAW SIGHAL a HH -3 I)
90.0 72.0
54.9
36.9
18.9
-18.9
-36.9
-54.8
-72.9
-98.8
5.9 19.9 15.9 29.9 25.9 39.9 35.9
b 63.0
56.9
49.9
42.9
35.9
28.9
21.9
14.9
7.8
5.8 19.9 15.9 29.9 25.9 39.9 35.8
49.9 45.9 58.9 19E-7 SEC
48.8 45.9 50.9 18E 6 HZ
Fig. 3. (a) Time domain backscattering signal of a 198 ~m radius
tungsten carbide spherical inclusion.
[image:7.482.73.418.76.580.2]1002 D. K. HSU ET AL.
w 0 ,5 D
:J
I-::J c..
:;:
«
z
0
°
i= «...J ...J
U 0
V) 0 0
0 0
-0,5
Fig. 4. Angular dependence of the amplitude of the trailing oscil-lations in Fig. 3(a). Here 9 is the angle between the transmitting transducer and the receiving transducer. The solid line represents (3cos 29-l).
Table I. Resonance modes of a tungsten carbide spherical inclusion.
Mode f expt (MHz)
820 8.9
830 13.0
840 16.7
850 -19.7
k a (expt) s
2.6 3.8 4.9 -5.7
k a(mode chart) s
2.68 3.91 5.01 6.06
NOTE: 8hear velocity in tungsten carbide used in k a was computed from manufacturer supplied data on Poisson r~tio and
[image:8.482.109.364.75.293.2]In sizing the 198 ~m radius tungsten carbide sphere, we used a
5 MHz (nominal center frequency) transducer and the resonance at 8.9 MHz was almost unobservable. Born inversion gave a radius estimate of approximately 170 ~m. In this experiment some diffi-culties were encountered because of the "ring down" noise of the transducer below 2 MHz. Using a 10 MHz transducer, we also performed an inversion of the pitch-catch scattering data taken at 9=55° where the resonant oscillations vanish and obtained 188 ~m as an estimate of the radius. Using this estimated radius and the mode chart value of k a=2
5
68, the shear velocity in tungsten carbide was deduced to be 3.9 ~ 10 cm/sec. This compared favorably with the handbook value of 3.98 x 105 cm/sec (or 4.3 x 105 cm/sec computed from manufacturer[8] supplied mechanical property data).
Experiments were performed to size a 114 ~m solder sphere im-bedded in plastic. Figure 5 shows the time domain and frequency domain scattering data. Born inversion gave a radius estimate of
92 ~m. Although characteristic resonances occurred in the frequency range used in the Born inversion, the degradation did not appear to be serious. Qualitatively this could be explained by the fact that resonances of the solder sphere were not very strong or sharp. B. Born Inversion of Pitch-Catch Scattering Data
As shown in Fig. 2, the ~hange of wavevector for pitch-catch
scattering is given by 2k coSZ where 9 is the angle between the trans-mitting transducer and the receiving transducer. Equation (1) applies
to pulse-echo scagtering and pitch-catch scattering with K set equal
to 2k and 2k cos
2'
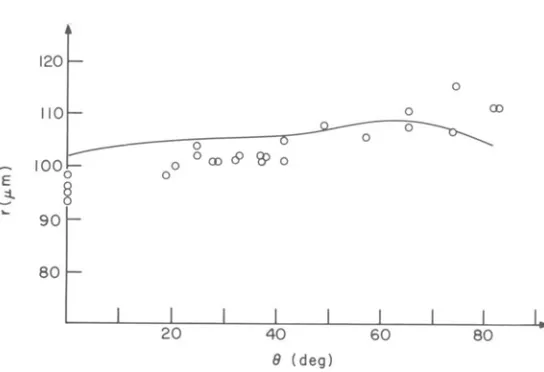
respectively. In the case of pitch-catch, the ~lg~rithm yields an estimate of the tangent plane distance in the k.-k direction. We applied the l-D inverse Born algorithm topitch-c~tcR waveforms scattered from a 95 ~m radius solder sphere imbedded in plastic and the results are shown in Fig. 6. For comparison the solid curve represents one-dimensional Born inversion results of theoretical scattering amplitudes of a 95 ~rn radius solder sphere in
plastic. The theoretical scattering amplitudes were obtained via a numerical evaluation of the series solution of Ying and Truell [9]. In carrying out the l-D Born inversion of the theoretical data, a band-width of 0.5<ka<2.2 was used, in agreement with the experimental conditions. The agreement between the experiment and the theory was reasonably good.
IV. EQUIVALENT ELLIPSOID RECONSTRUCTION
1004
b 90.0
81.0
72.0
63.0
54.0
45.9
D. K. HSU ET AL.
5.9 10.9 15.9 20.0 25.0 30.0 35.0 40.0 45.0 50.0
10E 6 HZ
Fig. 5. (a) Backscattering signal of a 114 ~m radius solder sphere
inclusion.
[image:10.482.73.408.89.564.2]120
o
110 o CD
~---o'--~
o
E 1000 ::I..
§
..
::t
20 40 60 80 I.
8 (degl
Fig. 6. Radius estimates by the one-dimensional Born inversion in
the pitch-catch configuration for a 95 ~m radius solder sphere inclusion. The dots are experimental results and the solid curve is obtained by inverting the exact theore-tical scattering amplitude with a limited bandwidth.
TANGENT PLANE
z'
, ,
,
,
OBSERVATION
I
TANGENT POINT
F---,L..--__ y'
x'
LOCUS OF TANGENT PLANE DI STANCES
[image:11.482.106.378.110.296.2] [image:11.482.123.353.458.563.2]1006 D. K. HSU ET AL.
three Euler angles of the equivalent ellipsoid [10] that fits the experimental results most closely and hopefully also represents a good approximation to the flaw.
For a given ellipsoid arbitrarily oriented in the laboratory system of coordinates (x',y',z'), its orientation can be specified in terms of three Euler angles ~, 9 and~. Three successive
rota-tions through the Euler angles in the sequence described in Ref. 11
bring the laboratory coordinates to coincide with the principal axes coordinates (x,y,z) of the ellipsoid. For a given observation direction specified by polar angle a' and azimuthal angle a', the tangent plane distance r is given by e
where
I
=
allJ
=
a21 K=
a31r e
sina'cosa' sina'cosa' sina'cosa'
(2)
+
a12 sina'sina'+
al3cosa'+
a22 sina'sina'+
a23 cosa'+
a32 sina 'sina'+
a33 cosa'and aij are elements of the coordinate rotation matrix in ~=Ax'.
Each a . is a function of the three Euler angles ~, 9 and~. The
input !ata to the nonlinear least squares iteration routine therefore takes the form of (a',a' ,r ) where r is the tangent plane distance obtained from the one-dimefisional Bofn inversion for the observation direction specified by a' and
st.
Based on Eq. (2), the iteration procedure determines the six parameters a , a , a , ~, 9 and ~ ofthe ellipsoid that best fits the data in the reas~ squares sense. We used a Marquardt's nonlinear least squares program in the Tektronix statistirs package and performed the iteration on a Tektronix 4052 desktop computer. The iteration result contains tangent plane dis-tances of the fitted ellipsoid for all directions and can be displayed together with the experimentally determined r for comparison. e
Although the iteration result contains all the geometric infor-mation of the equivalent ellipsoid, it should be realized that, unless the scattering direction is along one of the principal axes, the tangent plane distance is generally different from the "tangent point distance" (i.e., the distance from the center to the point of contact with the incident wave front on the surface of the ellipsoid, denoted as r in Fig. 7). A three-dimensional display of r does not resemble
e
surface is effectively "illuminated" by the incident waves in the observation aperture and thereby helps assessing the degree of con-fidence of the equivalent ellipsoid reconstruction. It can be shown that the coordinates of the tangent point in the laboratory frame are given by
x ' = -1 (all ax I 2 + a 21 a 2J + a 31 a z K) 2
0 r e y
y, ' = -1 (a l2 a 21 + a 22 ay 2 J + a 32 a/K) (3)
0 r e x
z ' = -1 (a13 ax I 2 + a23 ay 2 J + a 33 a z K) 2
0 r e
The coordinates of the tangent point are functions of the six para-meters resulted from the least squares iteration and the polar and azimuthal angles of the observation direction. It can further be shown that the "tangent point distance" r is given by
(4)
A display of r as a function of direction, together with the corres-ponding experimental points, will therefore serve as a visual
reali-zation of the size, shape and orientation of the flaw and graphically depicts the extension of flaw shape from the illuminated region to the "unseen" region.
VI. RESULTS OF ELLIPSOIDAL RECONSTRUCTION
To test the validity of the ellipsoidal reconstruction technique, we first applied it to the degenerate case of a spherical inclusion. Using Born inversion results of the 95 ~m radius solder sphere
(Fig. 6), the ellipsoidal reconstruction yielded good results: a = 91 ~m, a = 89 ~m and a = 95 ~m. Experiments were then per-f~rmed on an
I
pproximate1y pfo1ate spheroidal inclusion (Fig. l(a» and the reconstruction was carried out for it. The utility of the method was next demonstrated in the reconstruction of an oblate1008 D. K. HSU ET AL.
(1) Prolate spheroidal inclusion
A stainless steel inclusion with an approximate shape of a pro-late spheroid (47 x 96 ~m semiaxes, Fig. l(a)) was imbedded in a plastic disk with its major axis tilted about 7° with respect to the parallel faces of the sample. Measurements were made at 25 scatter-ing directions within a conical aperture of 39° half angle in the solid host. Tangent plane distances for various observation direc-tions as obtained from the Born inversion are displayed in Fig. 8
where a' and
S'
are, respectively, the polar angle and the azimuthal angle of the observation direction in the laboratory system. Results of the ellipsoidal reconstruction are shown in Table II. It should be pointed out that, for small 9, equal and opposite values of ~ and ~ correspond to compensating rotations about the z axis and areessentially equivalent to
Q
=
°
and ~=
0.In the three-dimensional reconstruction of the flaw shape from a collection of one-dimensional inverse Born results at different observation directions, the effects of aperture size and number of observation directions are of interest. Using the data set shown in Fig. 8, we performed the ellipsoidal reconstruction with decreasing aperture size and number of data points. The results are also shown in Table II. It is undesirable to take data only at S'
= 0,
n/2,n, and 3n/2 since this leads to nonuniqueness in the iterative fit
p'=leo·
46
.. P' = 0
Fig. 8. Experimental results of the 47 x 96 ~m (semiaxes) inclusion. The numbers beside the circles are the tangent plane
dis-tance (in ~m), a' and
S'
are the polar angle and the [image:14.482.126.348.380.576.2]Table II. Results of the ellipsoidal reconstruction for the 47 x
96 um (semi-axes) inclusion.
Ellipsoidal Reconstruction Actual
parameters
A B C D
a x 47 um 40 27 28 0
a 96 141
Y 119 123 122
a z 47 50 54 53 56
9 -7° 14 8 9 2
rJ
0 -71 -48 -47 71jJ 0 69 47 46 8
A: 25 data points within a conical aperture of 39° half angle were used in the iteration.
B: 17 data points within a conical aperture of 26° half angle.
c:
9 data points, one at ex'=
0 and 8 at ex'=
26°.D: 6 data points, one at ex'
=
0, one at ex'=
19° and 4 at ex' 11°.to the ellipsoid. The iteration scheme was found to be reasonably robust in terms of limited aperture and density of observation directions.
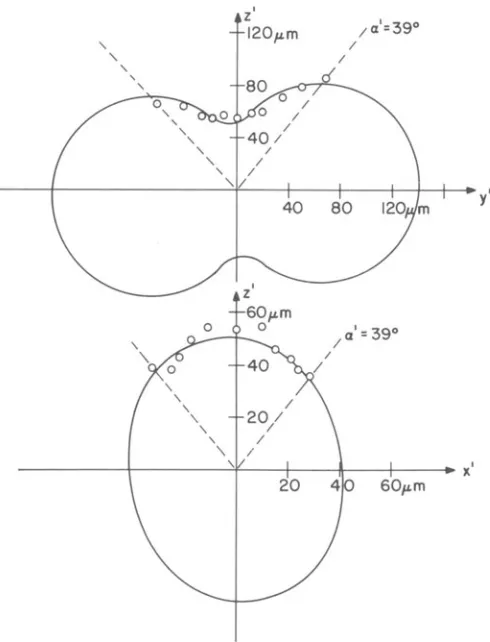
Figure 9 shows the tangent plane distance r as a function of the polar angle in the y'z' plane together with ~xperimental points that fallon this plane. A similar plot for the x'z' plane is also shown in Fig. 9. Using Eq. (4) we further obtained the true repre-sentation of the ellipsoid surface in terms of the "tangent point distance" r. Figure 10 shows the y'z' cross-section of the recon-structed ellipsoid where the dots represent experimental points. As can be seen, the illuminated section of the surface covered by the tangent points subtends a much greater angular span than the 39°
half angle aperture in the solid. A prolate spheroid with its major axis parallel to the sample surface therefore provides a high
[image:15.482.55.425.57.383.2]1010
"
"
"
,,
z' 120~m
I
/ a'= 39°
/
40 80
D. K. HSU ET AL.
'/ '
---+---~--_+----~--_+--- K'
[image:16.482.120.365.155.476.2]z'
60f<
o
Fig. 10. y'z' cross-section of the equivalent ellipsoid for the 47 x 96 ~m (semi-axes) inclusion after the r +r trans-formation. Experimental points lying in theey'z' plane are represented by open circles.
(2) Oblate spheroidal void in titanium
Although the results of the ellipsoidal reconstruction of the stainless steel inclusion in plastic are quite encouraging. it is necessary to demonstrate the validity of the technique for flaws in a realistic structural material. To this end we have carried out experiments on a 200 x 400 ~m oblate spheroidal void in a
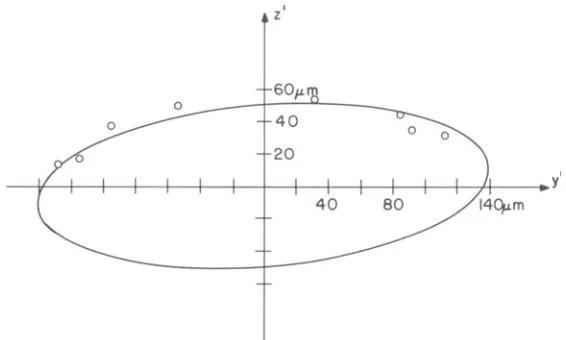
diffusion-bonded titanium disk (provided by the DARPA/AFML program in quanti-tative non-destructive evaluation). Measurements were made for 21 observation directions in a conical aperture of 42° half angle in titanium (or go in water). Table III lists the inverse Born r e values for these directions and Table IV shows the ellipsoid para-meters obtained from the iteration based on the data in Table III. Figure 11 shows the y'z' cross-section of the reconstructed ellipsoid together with experimental points in the y'z' plane.
[image:17.482.100.383.72.242.2]1012 D. K. HSU ET AL.
Table III. Tangent plane distance r of the 200 x 400 ~m (semi-axes) oblate spheroidal ~oid in titanium as obtained from l-D Born inversion.
>z
al 0° 37° 90° 180° 217° 270°13° 181 ~m 228 186 178 176 194
22° 231 243 232
---
252 22432° 275
---
291---
286 28542° 325 341 320
---
327 351NOTE: Measurements were also made at al
= 0 and repeated trials
gave r
=
201, 217, 201 and 176 ~m.e
Table IV. Results of ellipsoidal reconstruction of the 200 x 400 ~m
(semi-axes) oblate spheroidal void in titanium.
Actual Ellipsoid fit
a x 400 ~m 482 ~m
a 400 397
Y
a 200 179
z
G 0° _2°
cJ 53
[image:18.482.57.424.100.301.2] [image:18.482.68.398.383.592.2]Zl
100
o
-4--+---~---+--~~--+---1----+--~----r-~~-+yl
Fig. 11. Ellipsoidal reconstruction of the 200 x 400 ~m (semiaxes)
oblate spheroidal void in titanium. The ellipse represents the y'z' cross-section of the equivalent ellipsoid and the circles are experimental points confined in the y'z' plane.
caused by the 90 ° difference in the two sets of results and because
e
is small the two sets of results are identical. Hence. although the reconstruction scheme is based on the assumption that the flaw can be reasonably approximated by an ellipsoid. no ~ prioriknowledge about the order of magnitude of the parameters is required.
(3) Near-surface inclusion
The equivalent ellipsoid reconstruction scheme has recently been applied to the case of a near-surface inclusion. A 52 ~m x 106 ~m
inclusion (approximately prolate spheroidal in shape) was located 220 ~m below the flat surface of a sample and tilted 10° with respect
[image:19.482.109.380.107.258.2]1014 D. K. HSU ET Al.
Table V. Iteration results from two different "initial guesses" for the 200 x 400 ~m (semi-axes) oblate spheroidal void in titanium. Six data points were used, 5 at a' = 22° and
one at a' = O.
Initial Converged Initial Converged
a x 300 ~m 436 1000 ~m 310
a 400 310 500 436
Y
a 200 199 10 199
Q 4° 5.7° 30° 5.7°
rJ 305 47 170 47
1jJ 24 -14 310 -104
Table VI. Ellipsoidal reconstruction results of the 52 x 106 ~m (semi-axes) spheroidal inclusion.
Parameter Actual va1ues1
a x a y
a z
Q
1) from optical measurements.
52 ~m 106 ~m
52 ~m
o
o
Iteration results
57. 5 ~m 120. 3 ~m 42.1 ~m
[image:20.482.58.426.87.325.2] [image:20.482.57.419.374.595.2]Table VII. Ellipsoidal reconstruction of a flat circular crack using Opsal's theoretically calculated scattering amplitude.
Ellipsoidal Reconstruction Ideal
Result
Face on, edge on, n=60 ° edge on, n=40° 51 points 49 points 25 points
a x 1.0 1.052 1.002 0.995
a y 1.0 1.052 1.002 0.995
a 0.16 0.16 0.131 0.371
Z
e
0° 0° 2.6°lor
(4) Flat circular crack (theoretical data)
A flat circular crack may be regarded as an extreme case of an ellipsoidal void with a =a and a =0. Theoretical calculation of the L+L scattering fromza ~ircula~ flat crack has been made by
J. Opsal [13J. Figure 12 shows the tangent plane distances obtained from the one-dimensional Born inversion of the theore.tical data
(using the imaginary part of the scattering amplitude) [14J with a bandwidth of k max a
=
10. Using these theoretical values of tangent plane distances of a circular flat crack, we have tested the ellip-soidal reconstruction scheme in two ways. For a face-on observation configuration, we imposed a finite aperture of 50° half angle and assumed axial symmetry about the Z axis. For an edge-on observation [image:21.482.59.427.130.354.2]1016
"
'-" "
" "
'-" " "
,
z
/a' :500
0 .5
o 0 .2 0.4 0 .6 0 .6 1.0
D. K. HSU ET AL.
Fig. 12. Tangent plane distance as a function of polar angle a' obtained from band limited Born inversion of Opsal's theoretical data of a flat circular crack. Insert shows the "wedged pie section" aperture for the edge-on
[image:22.482.137.342.223.412.2]VII. CONCLUSION
We have made an extensive study of the determination of geometric parameters (size, shape and orientation) of included flaws using the one-dimensional inverse Born approximation. Encouraging results were obtained even with a limited interrogation aperture. We have
inves-tigated the degradation of the I-D Born inversion algorithm due to characteristic resonances of the inclusion flaw and due to surface-related scattering signals and found that, for the inclusions in our study, the degradation was not serious provided adequate frequency bandwidth was available. For inclusions in realistic structural materials, one would probably not expect high degrees of geometric symmetry in flaw shape and vast mismatch of impedance between the flaw and host material, strong and sharp characteristic resonances are therefore considered less likely.
In the course of developing a reconstruction scheme in terms of an equivalent ellipsoid, we have considered the general case of an arbitrarily oriented ellipsoidal flaw and analyzed in detail the tangent plane distance, the tangent point distance and the transfor-mation between them. The method developed has performed quite well in determining the size, shape and orientation of ellipsoid-like flaws. We have demonstrated the reconstruction technique for an inclusion in the bulk, for a void in metal and for an inclusion near a fluid-solid interface.
In order to assess the degree of confidence of the flaw para-meters obtained by the ellipsoidal reconstruction, a three-dimensional display of the reconstructed flaw together with the experimental data would be very useful. Such a display would serve as a visual
realiza-tion of the goodness of the fit as well as the locarealiza-tion and the extent of the illuminated area on the flaw surface. One can then judge the confidence of the reconstruction by studying the "extrapolation" from the illuminated area to the "unseen" portion of the surface. We are in the process of developing a three-dimensional display of our results. It is of future interest to investigate flaws with low leverage for reconstruction, i.e., flaws with very limited area of illumination by the available interrogation aperture. It would also be of interest to apply the ellipsoidal reconstruction technique to more extreme cases of ellipsoids such as penny-shaped and rod-like flaws when a wide frequency bandwidth becomes available for scattering experiments. ACKNOWLEDGEMENTS
1018 D. K. HSU ET AL.
REFERENCES
1. R. C. Addison, R. K. E1s1ey and J. F. Martin, in Review of Progress in Quantitative NDE, Eds. D.
o.
Thompson and D. E. Chimenti, Pub. by Plenum Pressl,
251 (1981). 2. R. B. Thompson and T. A. Gray, in Review of Progress inQuantitative NDE, Eds. D. O. Thompson and D. E. Chimenti, Pub. by Plenum Press 1, 233 (1981).
3. J. H. Rose, R. K. E1s1ey~ B. Tittmann, V. V. Varadan and V. K. Varadan. in Acoustic, Electromagnetic and Elastic Wave Scattering, Eds. V. V. Varadan and V. K. Varadan, Pergamon Press, pp. 605-614 (1980).
4. Y. Sato and Tatsuo Usami, Geophys. Mag. 31, 15 (1962). 5. W. G. Neubauer, R. H. Vogt, and L. R. Dragonette, J. Acoust.
Soc. Am., ]2, 1123 (1974), ibid]2, 1130 (1974).
6. B. A. Auld, Acoustic fields and waves in solids, see Vol. 2, 232-239 (1973) for a discussion of normal modes. -7. D. B. Fraser and R. C. LeCraw, Rev. Scientific Instrum., ~,
1113 (1964).
8. Industrial Tectronics, Inc., Ann Arbor, Michigan.
9. C. F. Ying and R. True11, J. App1. Phys. 27, 1086 (1955). 10. For a probabilistic inversion algorithm for crack-like flaws
in terms of these parameters, see R. K. Els1ey, in Review of Progress in Quantitative NDE, Eds. D.
o.
Thompson and D. E. Chimenti, Plenum Press 1 (1981).11. H. Goldstein, Classical Mechanics, Addison Wesley, 1959, p. 107.
12. D. K. Hsu, J. H. Rose, R. B. Thompson and D.
o.
Thompson, submitted to Appl. Phys. Lett.13. J. L. Opsal, in Proc. DARPA/AFML Review of Progress in Quantitative NDE, 292 (1980).