This is a repository copy of Multispectral classification techniques for terahertz pulsed imaging: an example in histopathology.
White Rose Research Online URL for this paper: http://eprints.whiterose.ac.uk/670/
Article:
Berry, E., Handley, J.W., Fitzgerald, A.J. et al. (6 more authors) (2004) Multispectral classification techniques for terahertz pulsed imaging: an example in histopathology. Medical Engineering and Physics, 26 (5). pp. 423-430. ISSN 1350-4533
https://doi.org/10.1016/j.medengphy.2004.02.011
[email protected] https://eprints.whiterose.ac.uk/
Reuse
See Attached
Takedown
If you consider content in White Rose Research Online to be in breach of UK law, please notify us by
White Rose Consortium ePrints Repository
http://eprints.whiterose.ac.uk/This is an author produced version of a paper published in Medical Engineering and Physics. This paper has been peer-reviewed but does not include the final publisher proof-corrections or journal pagination.
White Rose Repository URL for this paper: http://eprints.whiterose.ac.uk/archive/00000670/
Citation for the published paper
Berry, E. and Handley, J.W. and Fitzgerald, A.J. and Merchant, W.J. and Boyle, R.D. and Zinov'ev, N.N. and Miles, R.E. and Chamberlain, J.M. and Smith, M.A. (2004)
Multispectral classification techniques for terahertz pulsed imaging: an example in histopathology. Medical Engineering and Physics, 26 (5). pp. 423-430.
Citation for this paper
To refer to the repository paper, the following format may be used:
Berry, E. and Handley, J.W. and Fitzgerald, A.J. and Merchant, W.J. and Boyle, R.D. and Zinov'ev, N.N. and Miles, R.E. and Chamberlain, J.M. and Smith, M.A.
Multispectral classification techniques for terahertz pulsed imaging: an example in histopathology. Author manuscript available at:
http://eprints.whiterose.ac.uk/archive/00000670/ [Accessed date]. Published in final edited form as:
Berry, E. and Handley, J.W. and Fitzgerald, A.J. and Merchant, W.J. and Boyle, R.D. and Zinov'ev, N.N. and Miles, R.E. and Chamberlain, J.M. and Smith, M.A. (2004)
Multispectral classification techniques for terahertz pulsed imaging: an example in histopathology. Medical Engineering and Physics, 26 (5). pp. 423-430.
Multispectral classification techniques for terahertz pulsed
imaging: an example in histopathology
Classification of article: Communication
Journal subject area: Imaging and Image Processing
1
Elizabeth Berry, 2James W Handley, 1*Anthony J Fitzgerald, 3WJ Merchant, 2Roger D
Boyle, 4†NN Zinov'ev, 4Robert E Miles, 4J Martyn Chamberlain, 1Michael A Smith
1
Academic Unit of Medical Physics, University of Leeds, Leeds, LS1 3EX.
2
School of Computing, University of Leeds, Leeds, LS2 9JT
3
Department of Histopathology, Leeds Teaching Hospitals NHS Trust, Leeds, LS1 3EX
4
School of Electronic and Electrical Engineering, University of Leeds, Leeds, LS2 9JT
*Present address Teraview Ltd, Cambridge
†
Present address National Physical Laboratory, Teddington, Middlesex
Correspondence: Dr E Berry, Academic Unit of Medical Physics, University of Leeds,
Wellcome Wing, Leeds General Infirmary, Great George Street, Leeds, LS1 3EX. Tel: 0113
392 2438 Fax: 0113 234 7619 email: [email protected]
Keywords: terahertz pulsed imaging, multispectral classification, clustering, histopathology,
Abstract
Terahertz pulsed imaging is a spectroscopic imaging modality using pulses of
electromagnetic radiation (100 GHz to 10 THz), and there has been recent interest in studying
biomedical specimens. It is usual to display parametric images derived from the measured
pulses. In this work, classification was achieved by applying multispectral clustering
techniques to sets of parametric images. It was hypothesised that adequate information for
clustering was carried in a small number of parametric images, providing these were
weighted by complementary physical properties. Materials prepared for histopathological
examination were chosen because their condition remained stable during long imaging
periods and because their dehydrated state led to greater penetration of the radiation. Two
specimens were examined in this pilot study, one of basal cell carcinoma and one of
melanoma. Unsupervised ISODATA classification using three selected parametric terahertz
pulsed images was compared qualitatively with k-means classification using the shape of the
whole time series, and with conventional stained microscope slides. There was good
qualitative agreement between the classifications. Classifications were consistent with the
morphological appearances expected, but further work is required to determine if tumour
discrimination is possible. The results have implications for the future development of the
technique as the need for only a small number of features could lead to considerably reduced
acquisition times.
Introduction
Terahertz radiation is the part of the electromagnetic spectrum between the far infrared and
There has been a recent surge of interest in using such radiation because of the development
of new, relatively compact, methods of generating and detecting coherent terahertz
radiation1,2. Pulsed sources of radiation are ideal for spectroscopy3,4, and the use of terahertz
frequency radiation for these investigations is attractive because in molecules the separations
between rotational energy levels, and between vibrational energy levels, correspond to this
frequency band5. It is also possible to form images using pulsed sources of terahertz
radiation6,7. Although such images have potential to display information about the spatial
distribution of the spectroscopic data, there is a reduced frequency resolution compared with
purely spectroscopic investigations.
In intact samples, or for tissue in vivo however, the reduction in spectral resolution is not such
a concern as would be the case for specially prepared samples. This is because there is a
possibility that strong water absorption may mask signature features from other molecules.
Additionally, it is expected that smoothing of spectral features will arise from the presence of
a mixture of several molecules, and because different chemical environments will exist even
for a single molecule.
The absence of strong spectral features means that an appropriate way to display image data
is by using parametric images generated from the acquired data that consists of a time series
at each pixel. Parametric images are used in other areas of medical imaging. For example in
nuclear medicine, parametric images of amplitude and phase of ejection from the left
ventricle can be obtained from cardiac multiple gated acquisitions (MUGA). In magnetic
resonance imaging (MRI), parametric images are used to illustrate uptake of contrast medium
in dynamic studies. In terahertz pulsed imaging, a parametric image might show a parameter
reference pulse that has traversed the same path but with no sample present. Parameters may
also be calculated in the frequency domain, following Fourier transformation of the pulse.
An example would be the transmittance, or relative intensities of sample and reference at a
particular frequency, which is commonly used in spectroscopy and optics. Typical
parameters, with explanations of how they relate to physical properties of a material, are
described by L ffler et al.8. As many parameters may be used, each acquired data set can
lead to a family of parametric images.
If multiple parametric images are generated from each data set, it is then necessary to
combine the information from the images in order to maximise the use of the information
present. This is a common problem in image analysis, and one solution is to use
multispectral classification methods. It is assumed that a particular class will be made up of
members that have similar values for each of a number of features. In a multi-dimensional
feature space, all the members of a particular class will be clustered together. In the case of
parametric images, the features are the parameters and the feature values are the pixel values.
Multispectral classification techniques work by assigning pixels to classes based on their
similarity to other pixels already assigned to that class. Such classifiers have been used very
successfully with MRI data9,10 for classification in the brain. In MRI, several different pulse
sequences are used to obtain sets of images with different contrast properties, and this means
that a registration step is often required before multispectral classification, to compensate for
movement of the subject between the acquisitions. Terahertz pulsed imaging data is even
better suited to this sort of analysis. There is no need for a registration step because the sets
of images to be used come from a single scanning sequence and are thus in spatial
registration. For the optimisation of clustering in feature space, well separated clusters are
properties of the material. Although several physical properties can affect the values of the
parameters8, particular parametric images have greater dependence on a particular physical
property, and such images should be valuable for clustering. The choice of appropriate
parametric images is discussed in the theory section below.
Theory
Multispectral classification
In this article we develop the use of the parametric images in terahertz imaging by proposing
that the information from separate parametric images be combined using multispectral
classification. Image analysis tools that can perform multispectral classification are readily
available, and for these it is necessary to have generated two or more images that are spatially
registered to one another. Note that, more generally, clustering classification analysis can be
performed without the explicit generation and display of images. For example, to ensure that
the entire shape of the pulse at each pixel was taken into account, the parameters used might
be the set of time series amplitudes or the coefficients of the Fourier transform. This would
lead to a feature space where the number of dimensions was equal to the number of points or
coefficients.
Automated classifiers fall into two groups, supervised and unsupervised. In the former,
pixels known to belong to particular classes are used for initialisation, and all other pixels are
assigned to classes on the basis of their similarity to members of this initial training set. In
contrast, unsupervised classifiers do not use a training set, though they are not entirely free of
user input as it is necessary to define input parameters, to set stopping criteria for example.
Two similar algorithms were used. The first of these was the ISODATA algorithm,
originally described by Duda and Hart11. It was chosen as it is available for unsupervised
classification in the AnalyzeTM biomedical image analysis software (AnalyzeDirect.com,
Lenexa, Kansas, USA), and so could be readily applied to a small number of parametric
images. In the ISODATA algorithm, the starting locations for the class centroids are set to
cover a broad range of feature space, and each pixel is put into the class whose centroid is
closest (in Euclidean distance) in feature space. Once each pixel has been assigned, the
centroid locations are updated and the algorithm is repeated. The stopping criterion is a set
percentage of pixels that have changed class from the previous iteration. The merge criterion
allows small classes to be discarded and merged with the nearest class centroid, based on a
user defined minimum separation for classes. This minimum separation is called the
threshold for the merge and is expressed as a distance in feature space. Definition of clusters
using Euclidean distance is justified where the feature space is isotropic with an even spread
of data.
In order to allow comparison with classifications based on information from a large number
of features, such as the time series amplitudes, the widely used k-means clustering algorithm
was employed. The algorithm is unsupervised and broadly similar to the ISODATA
approach, the main difference being that a pre-defined number of classes is found. In the
k-means algorithm, pixels are assigned to one of k classes, whose centres are defined by the
mean value of the feature vector for that class. The initial k cluster centres are chosen
randomly, then each pixel is assigned to the class to which it is nearest. The mean value of
the feature vector is re-calculated for each class and pixels re-assigned. The algorithm is
Choice of parametric images for ISODATA algorithm
Although the terahertz frequency band includes regions conventionally approached using the
optical properties (300 GHz to 115 THz) or the dielectric properties (15 GHz to 300 GHz) of
materials, in this work the behaviour was considered to be entirely optical in character. This
is consistent with guidance on radiofrequency electromagnetic fields12, in which exposures
are treated as quasi-optical for all frequencies over 6 GHz. Attenuation of terahertz radiation
takes place by reflection, scattering and absorption. If scattering may be neglected, then the
refractive indices and linear absorption coefficients of the materials along the beam path will
determine the degree of attenuation, as these properties determine the degree of reflection and
absorption as defined by the Fresnel coefficients13. For uniform thickness, single layer,
geometry the pulse delay will be determined solely by the refractive index. The pulse height
will be strongly dependent on absorption coefficient, particularly if reflection losses are small
compared with attenuation from absorption as is expected in this case. In analogy to MRI,
the two parametric images could be described as refractive index-weighted and absorption
coefficient-weighted images – whilst the images do not map absolute values of refractive
index and absorption coefficient, these are the parameters that affect the contrast most
strongly. A further time domain parameter that is simple to calculate is the full width at half
maximum (FWHM) of the pulse. This will be affected by both the refractive index
(especially where the medium is strongly dispersive) and the absorption coefficient, and was
chosen as the third image parameter because of its potential to provide complementary
information.
The purpose of this pilot study was to investigate the feasibility of using multispectral
expected tumour morphology could be generated from multispectral classification using the
three complementary time domain features described above. It was hypothesised that
adequate information for clustering is carried in a small number of parametric images,
providing these are weighted by complementary physical properties. As no reference
classification was available, the validity of the classifications made using only three features
was qualitatively assessed by comparison with those produced using a larger number of
features. The use of a small number of features is desirable as with suitably adjusted
acquisition methods it could lead to considerably reduced acquisition times.
Methods
In this preliminary work materials prepared for histopathological examination, but sliced less
thinly, were chosen. This choice of prepared tissue was primarily because basic terahertz
imaging equipment, as used in this work, is slow. Image acquisition could extend well over
24 hours, a period during which the condition and hydration of untreated biological materials
would be expected to change. Tissue already prepared for microscopy had been treated by
dehydration and fixed with formalin, so it was not expected that the physical properties
would change during imaging. The stability of the samples would also allow for repeat
imaging on another date. An associated benefit was that de-hydration of the tissue would
lead to an increased depth of penetration of terahertz radiation compared with its untreated
state, allowing the transmission mode of imaging to be used, which is simpler to analyse than
the alternative reflection mode. Diagnosis in histopathology is based on morphological
appearance under the microscope. Once samples have been stained with haematoxylin and
eosin, which are taken up in varying degrees by different types of cell, different tumours have
characteristic appearances. It is known that contrast in terahertz images between tissues in
is removed, as is the case in the samples used here, then the contrast may be more closely
associated with the features identified by the pathologist, which are associated with the
distribution of cell types. This makes the samples particularly attractive for the application
of classification techniques.
Local research ethics committee approval was given to use human tissue in this study. Two
biopsy samples were chosen. In each case they had previously been prepared in the routine
manner by dehydration, formalin fixation and mounting in paraffin wax. Diagnosis was
made by the pathologist from a thin slice taken from the block of prepared tissue and the
remaining tissue was then stored in case further samples were required for clinical purposes.
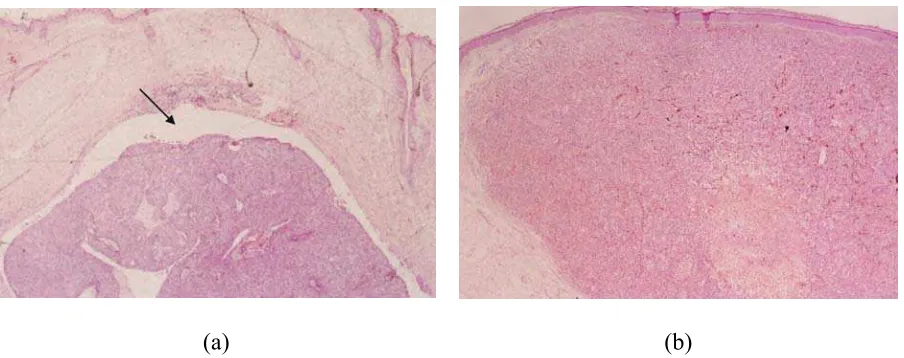
One sample was diagnosed as a nodular basal cell carcinoma (BCC), the other as melanoma.
In both cases a large group of cells within the dermis, displacing the normal structures of the
skin, was seen (Figure 1). In the case of the BCC a characteristic low cellularity,
fibromyxoid stroma was seen separating the tumour from normal structures (Figure 1a
arrowed).
[image:11.595.74.526.483.662.2](a) (b)
Figure 1. Stained slides, magnification 2.5, used for diagnosis of (a) BCC and (b)
melanoma; these are from the same tissue samples but do not represent the same slice or area
than the tumour, and the epidermis is at the top of the image with the direction into the skin
running from top to bottom. The arrow indicates a characteristic low cellularity, fibromyxoid
stroma separating the tumour from normal structures in the BCC.
For this study a further, thicker slice (1 mm) was removed from the block and mounted in
wax, for terahertz pulsed imaging. As this was done at some time after the initial diagnosis it
was not possible to spatially register the new slice to the microscope slides used for
diagnosis.
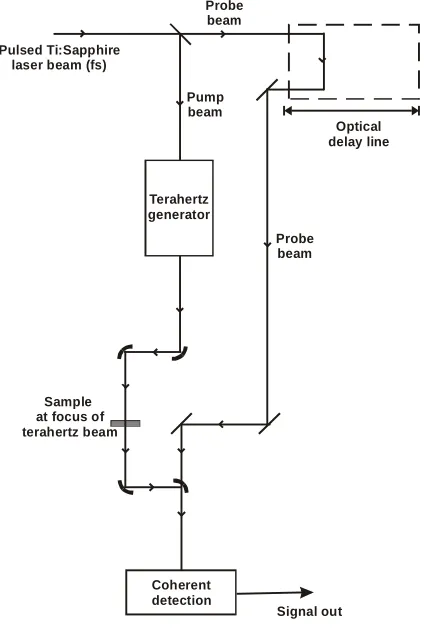
Pulsed terahertz imaging15 was performed using imaging equipment shown schematically in
Figure 2. The method used is the pump and probe technique, which is commonly applied in
optical spectroscopy. The beam of an ultrafast pulsed infrared laser is divided into two, and
one part is used as the pump to generate terahertz pulses, while the other is part of a coherent
detection scheme used to measure the amplitude of the terahertz electric field after
transmission through the subject. The optical delay line allows sampling in time of the
terahertz pulse at each pixel, meaning that the total acquisition time increases as more time
points are acquired, whilst raster scanning of the sample leads to an array of time series ready
for the production of parametric images. In each case 64 time points were acquired at 0.15 ps
intervals, and a reference pulse was acquired in the same way through an area containing only
the mounting wax. For the melanoma a 7 x 7 mm area was imaged, with 39 pixels in each
direction. For the basal cell carcinoma, a 10 x 10 mm area was imaged with 56 pixels in each
Coherent detection
Probe beam Probe
beam
Pump beam Pulsed Ti:Sapphire
laser beam (fs)
Optical delay line
Sample at focus of terahertz beam
Signal out Terahertz
[image:13.595.193.405.73.387.2]generator
Figure 2. Schematic layout of a terahertz pulsed imaging system in transmission mode. The
terahertz beam generated from an antenna or non-linear crystal is collimated and then focused
on the sample using off axis parabola mirrors15.
Three time domain parametric images were generated: (i) Pulse time delay relative to
reference pulse (refractive index weighted), (ii) pulse amplitude relative to reference pulse
(absorption coefficient weighted) and (iii) the full width at half maximum of the pulse. The
feature space for these images was made suitable for the ISODATA method by re-scaling
into the range 0 to 255. This meant that any merge threshold (distance in feature space)
Unsupervised ISODATA clustering with merging was applied to the groups of three images,
using the AnalyzeTM software. For the first classification, a single merge threshold of 70 was
used for the whole image. A second set of classifications was obtained using the two stage
merge process described below, so that small changes in composition within the tumour were
identified without multiple classes also being defined in the background regions. The merge
threshold of 70 was retained for the entire image except for the innermost region defined at
this threshold. For this region the merge threshold distance was halved to a value of 35 to
highlight structural differences that may be of value for tumour discrimination. For
comparison, a classification using many features was performed using unsupervised k-means
clustering (without any merging) on the full set of time series amplitudes of the two datasets;
64 features were used and 8 classes were defined.
Results
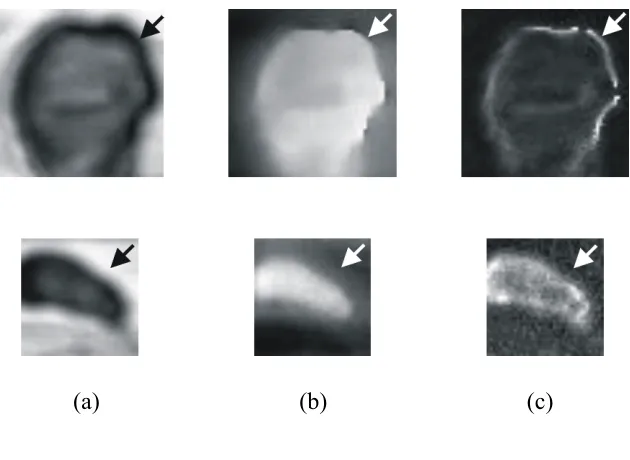
The three time domain parametric images for the BCC and melanoma samples are shown in
Figure 3. The terahertz images show the tumour mass as an area of higher attenuation
(Figure 3a), with particularly strong attenuation around the borders especially noticeable on
the BCC image. Further investigation will be needed to determine if the bright regions in the
FWHM image of the BCC (Figure 3c), are associated with the characteristic clefts seen
(a) (b) (c)
Figure 3. Time domain parametric images for the BCC (top row) and melanoma (bottom
row) samples. The arrows indicate the location of the epidermis and direction into the skin.
The reference pulse was transmitted through the wax surrounding the sample. (a) Relative
pulse amplitude, dark values represent high attenuation compared with the reference, which
appears bright. (b) Time delay relative to reference pulse, dark values represent small delay
times compared with that of the reference pulse, brighter areas represent longer time delays
(c) FWHM of pulse peak, dark values represent a pulse width similar to that of the reference
pulse, brighter areas have larger FWHM.
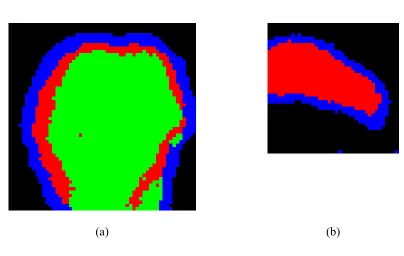
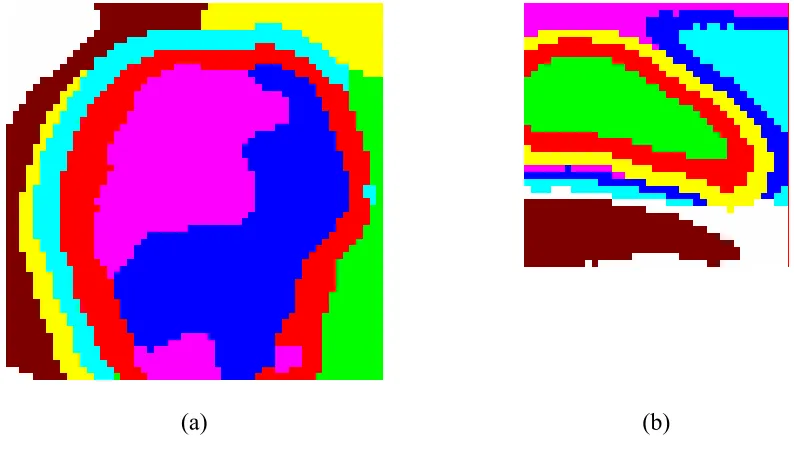
The classified images from the ISODATA algorithm are shown in Figures 4 and 5. Boundary
regions, shown in blue, have been classified in both cases. These are several pixels in width
and are unlikely to be fully explained by partial volume effects. For the merge threshold used
here, two regions were defined for the melanoma and three for the BCC. Figure 5 shows the
structure of the BCC is more organised than that of the melanoma, which is consistent with
the appearances of the stained slides seen in Figure 1.
Results from a k-means classification using time series features appear in Figure 6. These
show the same shapes as the ISODATA classification using three features, and for the BCC
the well-defined internal structures are also seen. There are more classes defined in the
background regions of these images because the number of classes was fixed at eight, without
the merging options used for the ISODATA algorithm.
[image:16.595.80.484.325.581.2](a) (b)
Figure 4. Classifications resulting from three parametric images, using the unsupervised
(a) (b)
Figure 5. Classifications resulting from three parametric images, using the unsupervised
ISODATA algorithm with two merge steps. A threshold of 35 was used to sub-classify the
innermost region of each classification in Figure 4. (a) BCC (b) melanoma.
[image:17.595.85.482.465.697.2](a) (b)
Figure 6. Results of k-means clustering into eight classes using the 64 time series values.
Discussion
In spite of a surge of interest in biomedical applications for terahertz imaging and although
such data have appeared in conference presentations, at the time of writing only one image of
histopathologically prepared human tissue has appeared in the literature16. This work
demonstrated terahertz imaging of a human liver sample containing several tumours. The
appearances were consistent with our findings, with the tumours seen as regions of higher
absorption in both a pulsed terahertz image (integrated from 0.2 to 0.5 THz) and continuous
wave imaging at 230 GHz. As the density of the metastases and normal tissue were
measured to differ by only 5% to 10%, the authors concluded that the higher absorption was
caused by differing chemical composition. Only one parametric image was presented and no
classification methods were applied. Veterinary histopathology samples were used by L ffler
et al8 to demonstrate the various parameters that can be used for imaging. They hypothesised
that the enhanced boundary seen on certain parametric images of a mast cell tumour was the
result of diffraction or scattering, and investigated the phenomenon further using the
technique of dark-field imaging17. The boundary regions seen in our classified images are
consistent with these findings. To establish if the feature is an artefact that may be ignored,
or if in some cases it carries information that may help in tumour discrimination, will require
further studies. These may use a range of spatial resolutions and boundary properties,
together with detection of radiation that has been scattered out of the incident direction.
The larger of the two datasets presented here took 34 hours to acquire, using the optical delay
line shown in Figure 2. Developments in instrumentation have already led to reduced
acquisition times1, but further reductions to allow real time imaging could be achieved by
development of rapid imaging techniques that avoid the need to acquire the full time series at
classification using only the three features and classification using multiple features to
represent the whole pulse. This supports the hypothesis that adequate information for
clustering is carried in a small number of parametric images, if these are weighted by
complementary physical properties. The results are encouraging for the development of a
custom designed acquisition to determine values for the three parameters alone. Furthermore,
the concept of using weighted images for classification reduces the computational demands
of the technique, compared with a method using absolute values of the physical properties.
While it is possible to extract physical properties from image data18,19, this is computationally
intensive.
The absence of training data meant that it was necessary to use unsupervised classifiers in
this work. Supervised classifiers have previously been successfully applied to terahertz
pulsed imaging data20, capitalising on the availability of large amounts of training data from
chicken and beef. Although such training data are not yet available for human tissue21, that
work taken together with the results presented here, indicate that the methods show much
promise, providing that clinically relevant differences between tissues exist.
Effort was concentrated on three complementary time domain images, as they were suited to
the direct application of multispectral techniques. There is also potential for using frequency
domain features, but pre-processing steps will be required to avoid artefacts occurring
because of the differing levels of noise and differing spatial resolution in the images22,16.
Terahertz images offer the possibility of providing information from deeper structures than
currently available to the pathologist from stained slides. Whilst the edges of the tumours
differences between tumour types that have been suggested in this pilot study require further
investigation, and in particular it is essential to include location-specific diagnoses using one
or more reference techniques, and samples of healthy tissue for comparison.
Conclusions
These results confirm that the families of images that can be generated from terahertz pulsed
imaging data sets are amenable to multispectral classification, and that classification can be
made using a subset of the total information available. Further investigation is indicated.
Acknowledgements
We are grateful for financial support from the Engineering and Physical Sciences Research
Council and from the European Union under the Teravision Project (IST-1999-10154). The
References
[1] Grischkowsky DR and Mittleman DM. Introduction in 'Sensing with terahertz
radiation', Ed. Mittleman DM. Springer, Berlin, Heidelberg, New York, 2003:
1-38
[2] Auston DH and Nuss MC. Electrooptic generation and detection of femtosecond
electrical transients. IEEE Journal of Quantum Electronics 1988; 24: 184-197
[3] Grischkowsky D, Keiding S, van Exter M, and Fattinger C. Far-infrared
time-domain spectroscopy with terahertz beams of dielectrics and semiconductors.
Journal of the Optical Society of America B-Optical Physics 1990; 7: 2006-2015
[4] Kindt JT and Schmuttenmaer CA. Far-infrared dielectric properties of polar
liquids probed by femtosecond terahertz pulse spectroscopy. Journal of Physical
Chemistry 1996; 100: 10373-10379
[5] Smye SW, Chamberlain JM, Fitzgerald AJ, and Berry E. The interaction between
Terahertz radiation and biological tissue. Physics in Medicine and Biology 2001;
46: R101-R112
[6] Hu BB and Nuss MC. Imaging with Terahertz Waves. Optics Letters 1995; 20:
1716-1719
[7] Wu Q, Hewitt TD, and Zhang XC. Two-dimensional electro-optic imaging of THz
[8] Löffler T, Siebert K, Czasch S, Bauer T, and Roskos HG. Visualization and
classification in biomedical terahertz pulsed imaging. Physics in Medicine and
Biology 2002; 47: 3847-3852
[9] Lundervold A, Taxt T, Ersland L, and Fenstad AM. Volume distribution of
cerebrospinal fluid using multispectral MR imaging. Medical Image Analysis
2000; 4: 123-136
[10] Vinitski S, Gonzalez C, Mohamed F, Iwanaga T, Knobler RL, Khalili K, and
Mack J. Improved intracranial lesion characterization by tissue segmentation
based on a 3D feature map. Magnetic Resonance in Medicine 1997; 37: 457-469
[11] Duda RO and Hart PE. 'Pattern classification and scene analysis', John Wiley and
Sons Inc, New York , 1973.
[12] Institute of Electrical and Electronic Engineers. 'Standard for safety levels with
respect to human exposure to radiofrequency electromagnetic fields, 3 kHz to 300
GHz (IEEE C95.1 1999 Edition)', Institute of Electrical and Electronic Engineers,
New York , 1999.
[13] Hecht E and Zajac A. 'Optics', Addison-Wesley Pub. Co, Reading, MA , 1974.
[14] Mittleman DM, Gupta M, Neelamani R, Baraniuk RG, Rudd JV, and Koch M.
Recent advances in terahertz imaging. Applied Physics B-Lasers and Optics 1999;
[15] Mittleman DM. Terahertz Imaging in 'Sensing with Terahertz Radiation', Ed.
Mittleman DM. Springer-Verlag, Berlin Heidelberg New York, 2003: 117-154
[16] Knobloch P, Schildknecht C, Kleine-Ostmann T, Koch M, Hoffmann S, Hofmann
M, Rehberg E, Sperling M, Donhuijsen K, Hein G, and Pierz K. Medical THz
imaging: an investigation of histo-pathological samples. Physics in Medicine and
Biology 2002; 47: 3875-3884
[17] Löffler T, Bauer T, Siebert KJ, Roskos HG, Fitzgerald A, and Czasch S. Terahertz
dark-field imaging of biomedical tissue. Optics Express 2001; 9: 616-621
[18] Dorney TD, Baraniuk RG, and Mittleman DM. Material parameter estimation
with terahertz time-domain spectroscopy. Journal of the Optical Society of
America A-Optics Image Science and Vision 2001; 18: 1562-1571
[19] Duvillaret L, Garet F, and Coutaz JL. Highly precise determination of optical
constants and sample thickness in terahertz time-domain spectroscopy. Applied
Optics 1999; 38: 409-415
[20] Ferguson B, Wang S, Gray D, Abbott D, and Zhang XC. Identification of
biological tissue using chirped probe THz imaging. Microelectronics Journal
2002; 33: 1043-1051
[21] Berry E, Fitzgerald AJ, Zinovev NN, Walker GC, Homer-Vanniasinkam S,
tissue measured using terahertz pulsed imaging. Proceedings of SPIE: Medical
Imaging 2003; 5030: 459-470
[22] Fitzgerald AJ, Berry E, Miles RE, Zinovev NN, Smith MA, and Chamberlain JM.
Evaluation of image quality in terahertz pulsed imaging using test objects. Physics
Tables
No tables included
Abbreviated title
Multispectral classification of THz images
Figure captions
Figure 1. Stained slides, magnification 2.5, used for diagnosis of (a) BCC and (b)
melanoma; these are from the same tissue samples but do not represent the same slice or area
as the sample used to obtain the terahertz images. In each case normal tissue appears lighter
than the tumour, and the epidermis is at the top of the image with the direction into the skin
running from top to bottom. The arrow indicates a characteristic low cellularity, fibromyxoid
stroma separating the tumour from normal structures in the BCC.
Figure 2. Schematic layout of a terahertz pulsed imaging system in transmission mode. The
terahertz beam generated from an antenna or non-linear crystal is collimated and then focused
on the sample using off axis parabola mirrors15.
Figure 3. Time domain parametric images for the BCC (top row) and melanoma (bottom
row) samples. The arrows indicate the location of the epidermis and direction into the skin.
The reference pulse was transmitted through the wax surrounding the sample. (a) Relative
pulse amplitude, dark values represent high attenuation compared with the reference, which
appears bright. (b) Time delay relative to reference pulse, dark values represent small delay
(c) FWHM of pulse peak, dark values represent a pulse width similar to that of the reference
pulse, brighter areas have larger FWHM.
Figure 4. Classifications resulting from three parametric images, using the unsupervised
ISODATA algorithm with a single merge step (threshold distance 70) (a) BCC (b) melanoma.
Figure 5. Classifications resulting from three parametric images, using the unsupervised
ISODATA algorithm with two merge steps. A threshold of 35 was used to sub-classify the
innermost region of each classification in Figure 5. (a) BCC (b) melanoma.
Figure 6. Results of k-means clustering into eight classes using the 64 time series values.