White Rose Research Online
[email protected]
Universities of Leeds, Sheffield and York
http://eprints.whiterose.ac.uk/
This is the author’s version of an article published in
Monthly Notices Letters of
the Royal Astronomical Society, 366 (2)
White Rose Research Online URL for this paper:
http://eprints.whiterose.ac.uk/id/eprint/75492
Published article:
Wareing, CJ, O'Brien, TJ, Zijlstra, AA, Kwitter, KB, Irwin, J, Wright, N, Greimel, R
and Drew, JE (2005)
The shaping of planetary nebula Sh 2-188 through
interaction with the interstellar medium.
Monthly Notices of the Royal
Astronomical Society, 366 (2). 387 - 396 . ISSN 0035-8711
Mon. Not. R. Astron. Soc. 366, 387–396 (2006) doi:10.1111/j.1365-2966.2005.09875.x
The shaping of planetary nebula Sh 2
−
188 through interaction
with the interstellar medium
C. J. Wareing,
1T. J. O’Brien,
1Albert A. Zijlstra,
2K. B. Kwitter,
3J. Irwin,
4N. Wright,
5R. Greimel
6and J. E. Drew
71Jodrell Bank Observatory, University of Manchester, Macclesfield, Cheshire SK11 9DL 2School of Physics and Astronomy, University of Manchester, Oxford Road, Manchester M13 9PL 3Department of Astronomy, Williams College, 33 Lab Campus Drive, Williamstown, MA 01267, USA 4Institute of Astronomy, Cambridge University, Madingley Road, Cambridge CB3 0HA
5University College London, Department of Physics & Astronomy, Gower Street, London WC1E 6BT
6Isaac Newton Group of Telescopes, Apartado de corras 321, E-38700 Santa Cruz de La Palma, Tenerife, Spain 7Imperial College of Science, Technology and Medicine, Blackett Laboratory, Prince Consort Road, London SW7 2BW
Accepted 2005 October 28. Received 2005 October 27; in original form 2005 September 2
A B S T R A C T
Sh 2−188 is an example of strong interaction between a planetary nebula (PN) and the in-terstellar medium (ISM). It shows a single arc-like structure, consisting of several filaments, which is postulated to be the result of motion through the ISM. We present new Hαimages from the Isaac Newton Telescope Photometric Hα Survey of the Northern Galactic Plane which reveal structure behind the filamentary limb. A faint, thin arc is seen opposite the bright limb, in combination forming a closed ring. Behind the faint arc a long wide tail is detected, doubling the size of the nebula. The nebula extends 15 arcmin on the sky in total. We have developed a ‘triple-wind’ hydrodynamical model, comprising of the initial ‘slow’ asymptotic giant branch (AGB) wind and the later ‘fast’ stellar wind (the interacting stellar winds model), plus a third wind reflecting the motion through the ISM. Simulations at various velocities of the central star relative to the ISM indicate that a high velocity of 125 km s−1 is required to
reproduce the observed structure. We find that the bright limb and the tail already formed during the AGB phase, prior to the formation of the PN. The closure of the ring arises from the slow–fast wind interaction. Most of the mass lost on the AGB has been swept downstream, providing a potential explanation of the missing-mass problem in PNe. We report a proper motion for the central star of 30±10 mas yr−1in the direction of the bright limb. Assuming
the central star is moving at 125±25 km s−1, the distance to the nebula is estimated to be
850+−500420pc, consistent with a spectroscopic distance to the star. Expansion velocities measured from spectroscopic data of the bright filaments are consistent with velocities measured from the simulation. Sh 2−188 is one of the largest PNe known, with an extent of 2.8 pc. The model shows that this size was already set during the AGB phase.
Key words: stars: AGB and post-AGB – stars: mass-loss – planetary nebulae: individual: Sh 2−188 – planetary nebulae: individual: S188 – planetary nebulae: individual: Simeiz 22 – ISM: structure.
1 I N T R O D U C T I O N
The accepted theory of planetary nebula (PN) formation is the inter-acting stellar winds (ISW) model (Kwok 1982; Balick 1987) where a fast wind (∼103km s−1) from the hot central star of a PN blows
into the slow wind (∼10 km s−1) produced during the preceding
E-mail: [email protected]
asymptotic giant branch (AGB) phase. The inner regions of the slow wind are compressed into a dense shell and ionized by the energetic ultraviolet (UV) radiation of the central star. The familiar ring-like appearance of PNe is then observed. Structures in the neb-ula are normally attributed to asymmetries in the slow wind, related to physical properties of the central star, such as rotation or binarity. Observations of PNe have shown several cases where the outer shell shows the only departure from symmetry. For those cases, the cause of the asymmetries has been proposed to be an interaction
C
2005 The Authors. Journal compilationC2005 RAS
at University of Leeds on May 8, 2013
http://mnras.oxfordjournals.org/
with the interstellar medium (ISM). Interaction of PNe with the ISM was first discussed by Gurzadyan (1969). An early theoretical study by Smith (1976) assumed a thin-shell approximation and the ‘snowplough’ model of Oort (1951). Isaacmann (1979) used the same approximation with higher velocities and ISM densities. Both of these studies concluded similarly that a nebula fades away before any disruption of the nebular shell becomes notable.
In contrast, Borkowski, Sarazin & Soker (1990) found that many PNe with large angular extent show signs of PN–ISM interaction, and that all nebulae containing central stars with a proper motion greater than 0.015 arcsec yr−1 do so. Soker, Borkowski & Sarazin
(1991) hydrodynamically modelled the interaction. The PN shell is first compressed in the direction of motion and then in later stages this part of the shell is significantly decelerated with respect to the central star. Both conclude that the interaction with the ISM becomes dominant when the density of the nebular shell drops below a certain critical limit, of typically nH=40 cm−3 for a PN in the Galactic
plane.
Villaver, Garcia-Segura & Manchado (2003) (hereafter referred to as VGM) pointed out the PN–ISM interaction had only been stud-ied by considering the relative movement when the nebular shell had already formed. They performed 2D hydrodynamic simulations fol-lowing the full AGB phase followed by the PN phase (Vassiliadis & Wood 1993, 1994), with a conservative relative velocity of the cen-tral star of 20 km s−1and conservative conditions of the surrounding
ISM of nH=0.1 cm−3. VGM concluded that interaction provides
an adequate mechanism to explain the high rate of observed asym-metries in the external shells of PNe. Further, they conclude that stripping of mass downstream during the AGB phase provides a possible solution to the problem of missing mass in PN whereby only a small fraction of the mass ejected during the AGB phase is inferred to be present during the post-AGB phase. Observational ev-idence for the effect of the ISM on AGB wind structures was found by Zijlstra & Weinberger (2002).
The PN Sh 2−188 (Sharpless 1959) is among the most extreme examples of ISM interaction. The nebula has a one-sided (semicir-cular), filamentary appearance. It is a large nebula, with a reported 340-arcsec diameter (Acker et al. 1992); the present paper shows it to be considerably larger. It is located in the Galactic plane at l=128◦,
b= −4◦. New data are presented showing the faint back of the shell and an extended Hαtail. The unusual appearance suggests a high proper motion and makes Sh 2−188 an important test case for PN– ISM interaction at high velocity. We have developed a ‘triple-wind’ model using a initial slow AGB wind, a subsequent fast post-AGB (PN) wind, and adding a third wind reflecting the movement through the ISM into the ISW model. We use a hydrodynamic scheme de-veloped by Wareing (2005), to investigate whether this triple-wind model can reproduce the nebular shape of Sh 2−188 without re-quiring magnetic fields. We support the results of the model with a proper-motion study of the candidate central star.
2 O B S E RVAT I O N S
2.1 Sh 2−188
Sh 2−188 (PNG 128.0−04.1, also known as Simeiz 22) was photographed in 1965 by Gaze & Shain (1965). Spectroscopic work (Parker 1964; Lozinskaya & Esipov 1971; Johnson 1975; Kwitter 1979) revealed the object to have an extremely high [NII]
[image:3.612.315.557.86.148.2]λ6583/Hαλ6563 line ratio. Further spectroscopic data on the fila-mentary structure (Rosado & Kwitter 1982) indicated filament den-sities of a few hundred H cm−3 and found abundances similar to
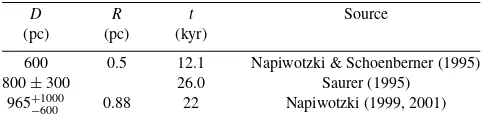
Table 1. Estimates of the distance to, radius of and age of Sh 2−188.
D R t Source
(pc) (pc) (kyr)
600 0.5 12.1 Napiwotzki & Schoenberner (1995)
800±300 26.0 Saurer (1995)
965+−1000600 0.88 22 Napiwotzki (1999, 2001)
Peimbert type I PN, where the large overabundances of He and N result from Carbon-Nitrogen-Oxygen(CNO) enrichment of the stellar envelope prior to shell ejection (Peimbert 1981). Mapping at radio wavelengths (Israel & Felli 1976; Salter et al. 1984) found only a weak source which appeared to have a flat (thermal) spec-trum. This observational evidence, along with the relatively bright optical appearance and PN abundances, constituted a convincing argument to classify the object as a PN, rather than a supernova remnant where non-thermal radio emission would be expected.
Kwitter, Jacoby & Lydon (1988) identified the candidate cen-tral star of the nebula with geometric, colour and apparent mag-nitude methods. The star is displaced from the geometric centre of the nebula. They estimate a percentage probability of finding an unrelated blue star in the nebula to be 1–2 per cent at most. In their spectroscopic investigation of central stars of old PNe, Napiwotzki & Schoenberner (1995) classified the candidate central star as hydrogen-rich. Borkowski et al. (1990) suggested that the fila-ments are most probably thin, sheet-like layers of shock-compressed nebular gas, parallel to the line of sight. The majority of the fila-ments are aligned along the crescent-shaped outer rim, but they noted a few appear to be along the nebular symmetry axis, possibly indicating stellar motion in that direction, as similar filaments do in Abell 35.
Table 1 shows various recent estimates of the distance and phys-ical parameters of the nebula. Various historphys-ical estimates can be found in table 5 of Saurer (1995). We do not list statistical distances (e.g. Cahn, Kaler & Stanghellini 1992): the Shklovski method (con-stant PN mass) particularly is of too low accuracy. Saurer (1995) calculated an extinction distance based on published UBV photom-etry of stars in the angular vicinity used to construct a reddening distance relationship for the line of sight towards the nebula. Most recently, the Non-Local Thermodynamic Equilibrium (NLTE) mod-elling method of Napiwotzki (1999, 2001) has implied the nebula is ancient with the central star at the turning point before the UV flux switches off and the star enters the white dwarf cooling regime. The parameters of Sh 2−188 are still subject to large uncertainties. Consistently though, this nebula is found to be an evolved object and as such is included in the Atlas of Ancient PNe (Tweedy & Kwitter 1996).
Tweedy & Kwitter (1996) note the existence of faint structure to the north-west of the bright nebula. They favour a simple explanation that the gas in this direction has diffused away. They infer a highly inhomogeneous ISM to the south-east producing the bright filaments but essentially absent to the north-west. A more likely model is one of a high peculiar velocity through a uniform ISM, and this is explored below.
2.2 Hαobservations
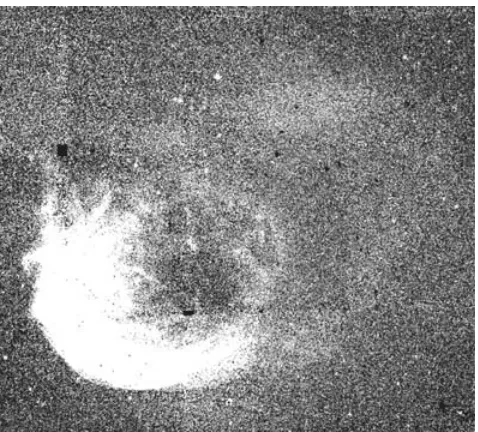
Fig. 1 shows an image of Sh 2−188 created by a mosaic of new Hαλ6563 observations taken as part of the Isaac Newton Telescope Photometric HαSurvey of the Northern Galactic Plane (IPHAS)
at University of Leeds on May 8, 2013
http://mnras.oxfordjournals.org/
PNe shaping through interaction with the ISM
389
Figure 1. An image of Sh 2−188 created by a mosaic of images taken as part
of the IPHAS survey in 2003 (see text). The faint central star is approximately 0.5-arcmin east of the brightest star in the centre of the nebula. North is up and east to the left. The image is 9.0×8.5 arcmin2.
Figure 2. Same as Fig. 1 but with scaling chosen to reveal faint structure. North is up and east to the left. The image shows a faint ring completing the bright semicircular arc and tails stretching away connecting in the north-west. The ring is centred approximately at RA=1h30m25s, Dec.= +58◦2530
(J2000). The image is 18.0×17.0 arcmin2.
(Drew et al. 2005). The IPHAS survey entails wide-field imaging through Hα, r- and i-band filters. It uses the Wide-Field Cam-era (WFC) at the 2.5-m Isaac Newton Telescope (INT), located at La Palma. The goal of the survey is to image the entire North-ern Galactic Plane between−5◦ and+5◦, to study emission-line stars and nebulae. The WFC consists of four 4k×2k CCDs, in an L-shaped configuration. The pixel scale is 0.33 arcsec and the instantaneous field is about 0.3 deg2. Exposure times are 120 s for
Hαand 10 s for iand rfor the observations presented here. Each pointing is supplemented by a second one offset by 5-arcmin SW, to
cover the gaps between the CCDs. The pointings together provide a tiled pattern that minimizes the gaps, but because of the L-shaped CCD configuration small gaps do appear.
The area around Sh 2−188 was observed on 2003 October 13 and 14. The seeing varied between 1 and 1.5 arcsec. The airmass was between 1.2 and 1.4. Data reduction was done using the pipeline procedures, which correct for the bias, flat-fielding, non-linearity and geometric distortions. A detailed description can be found in Drew et al. (2005). Fields around the position of Sh 2−188 were retrieved and mosaiced together using the Virtual Observatory soft-ware packageMONTAGE. The pixel scale was binned to 1 arcsec. A 40-arcmin field was mosaiced. The rwas subtracted from the Hα image to bring out the faint emission in this crowded field.MON
-TAGEtends to leave gradients across the full field, an artifact of the
process of background matching of fields taken with different sky brightness. This linear gradient was subtracted.
The final image in Fig. 1 shows the bright portion of the nebula in the south-east, which describes a semicircular arc with a diameter of 10 arcmin. Due to seeing variations between the rand Hαframes, small core-halo residuals can be seen at the positions of bright stars. Stars can also leave positive or negative residuals due to the stellar absorption features in the Hαand/or r filter. The bright residual star just behind the brightest part of the shell is an M5 giant, where the r filter covers a TiO absorption band. We stress that this is not an emission-line star, nor is it the central star of the PN. The central star of the PN is approximately 0.5-arcmin east of this star. Negative residuals tend to identify stars with strong Hαabsorption. The rectangular hole is one of the gaps left by the tiling pattern.
IPHAS provides both images and a source catalogue, as described in Drew et al. (2005). The catalogue contains stars and small resolved objects but not large-scale nebulosities. Coordinates are derived by globally matching the stellar sources with all-sky astrometric cata-logues. The internal precision is within 0.1 arcsec, and agreement with external catalogues is 0.25 arcsec [e.g. United States Naval Observatory (USNO)] to 0.1 arcsec [Two-Micron All-Sky Survey (2MASS)]. We will use the IPHAS source catalogue below in the discussion on the proper motion of the central star.
[image:4.612.57.296.347.563.2]Structure first noted by Tweedy & Kwitter (1996) to the north-west of the nebula is now revealed by these observations to be a faint circular closure of the bright nebula with connecting tails stretching behind. Fig. 2 has scaling chosen to reveal this structure. From the front of the filamentary structure to the connecting tails the nebula is 15-arcmin long. The surface brightness of the tail is less than 1 per cent of that of the bright filaments. The tail seems to be stretching away from the nebula in opposition to an inferred direction of motion which could explain the one-sided brightening as an interaction with the ISM.
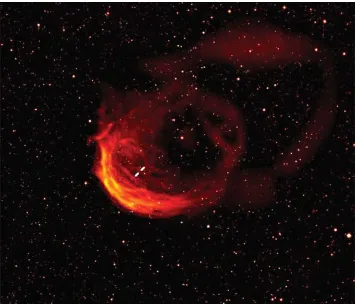
Fig. 3 shows an artificial combination of two three-colour images of the field. One is scaled to show detail in the bright filamentary structure and the other to show the faint structure. The rand the i bands are coded as blue and green, respectively, while Hαis coded as both red and yellow. The central star is indicated and is clearly displaced towards the bright arc from the geometric centre of the nebula.
3 T H E T R I P L E - W I N D M O D E L
A hydrodynamical code has been used to simulate the interaction with the ISM. The numerical scheme used to solve the hydrodynam-ics equations uses the second-order Godunov scheme due to Falle (1991). The scheme is in 3D cartesian coordinates, fully parallel and includes the effect of radiative cooling (Wareing 2005).
C
2005 The Authors. Journal compilationC2005 RAS, MNRAS 366, 387–396
at University of Leeds on May 8, 2013
http://mnras.oxfordjournals.org/
Figure 3. An artificial combination of Figs 1 and 2 showing the detail in the bright arc and the faint structure (with some blurring to allow combination of the images). The different IPHAS bands are colour-coded (see text). The Hαimage includes the continuum. The faint central star is indicated on the image between the markers.
The numerical domain consists of a cubic grid with 200 cells in each direction and uniform cell spacing. The central mass-losing star is placed at cell coordinates (50, 100, 100) and the simulation is performed in the frame of reference of the star. Mass loss is effected by means of setting the values of density, momentum and energy density in the cells in a spherical region of radius 53
4 cells centred
on the star. The radius of the source volume has been chosen by an experimental process whereby it is a balance between producing the most spherical nebula when modelling the stationary ISW model with spherically symmetric winds (i.e. reducing the pixelation of the cartesian grid) and not being large enough to interfere with the results of the simulation. The conditions within this region are reset at the beginning of every time-step to keep driving the wind. Movement through the ISM is parallel to the x-axis and material flows in at the (x = 1) boundary with a positive x-velocity. All other boundaries have conditions allowing material to flow out of the domain freely.
The hydrodynamic variables in the source volume are set accord-ing to the ISW model of the PN–ISM interaction. This follows the evolution of the AGB and post-AGB phases from the beginning of the AGB phase through the post-AGB or PN phase. In the triple-wind model, this evolution is combined with a constant movement through the ISM.
Mass loss via a stellar wind has been modelled as a spherically symmetric constant mass-loss rate ˙M with constant velocityv. In the ISM wind the density and velocity are constant.
Typical estimates from the literature are used for the wind param-eter values. The post-AGB fast wind paramparam-eters are: ˙Mfw = 5×
10−8Myr−1, v
fw=1000 km s−1and Tfw=5×10⁴K. The AGB
slow wind parameters are: ˙Msw=10−6Myr−1, vsw=15 km s−1
and Tsw=104K. The switch between the AGB wind and the
post-AGB wind is instantaneous and occurs after 105yr of AGB
evolu-tion, which is sufficiently long to allow a stable structure to develop. In view of the still considerable uncertainties on the detailed proper-ties and evolution of these winds, more detailed temporal variations were not modelled. In reality, one may expect the AGB wind to show increasing mass-loss rates with time, whilst the post-AGB may in-crease in velocity over time. However, the present assumptions are found to be sufficient to reproduce the basic structure of the nebula. The ISM itself is assumed to be homogeneous with characteristics of a warm neutral medium, the main constituent of the observed ISM:
TISM=2500 K and nH=1 cm−3(Burton 1988). The gas pressure
in all three winds is calculated assuming an ideal gas equation of state.
4 R E S U LT S
Various speeds of movement have been considered from 0 to 175 km s−1 in steps of 25 km s−1. The results of all these models
can be found in Wareing (2005). We present here only the case of 125 km s−1 which we find best fits the general morphology of
Sh 2−188. For comparison with observations we have considered the locations of the brightened arc and its faint completing ring, the location of the candidate central star (33 per cent of the geo-metric radius upstream of the ring centre), and the location of the connecting tails downstream of the nebula.
4.1 Post-AGB structure and evolution
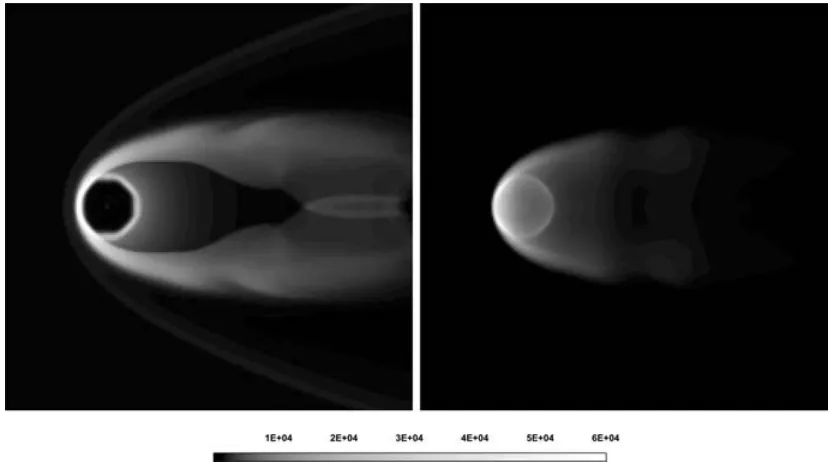
The left-hand panel of Fig. 4 shows density on a slice through the computational domain at (y = 100) 1000 yr into the post-AGB
at University of Leeds on May 8, 2013
http://mnras.oxfordjournals.org/
PNe shaping through interaction with the ISM
391
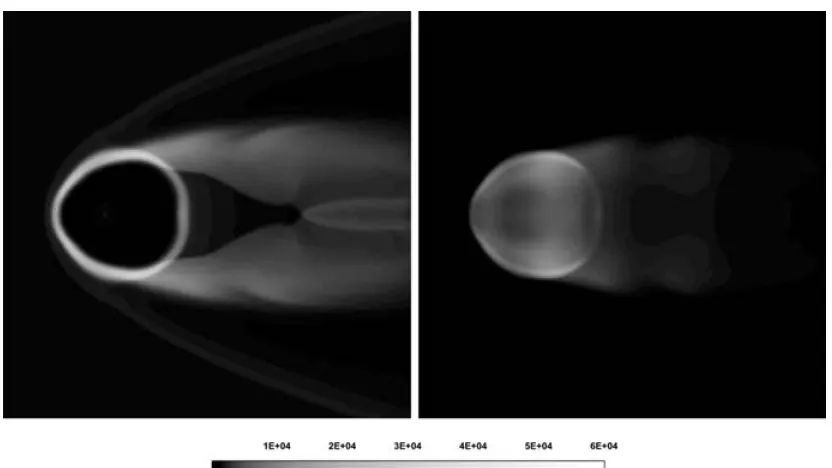
Figure 4. Shown on the left-hand panel is a slice through the data cube showing the logarithm of density at a point 1000 yr into the PN phase. On the right-hand panel is a representation of what the nebula might look like in emission. The images are 1 pc on a side. The scaling bar shown refers to the density slice and is presented in 10−6M
[image:6.612.100.515.352.585.2]pc−3.
Figure 5. Shown on the left-hand panel is a slice through the data cube showing the logarithm of density at a point 2000 yr into the PN phase. On the right-hand panel is a representation of what the nebula might look like in emission. The images are 1 pc on a side. The scaling bar shown refers to the density slice and is presented in 10−6Mpc−3.
(PN) phase. During the PN phase the wind decreases in density and increases in velocity resulting in an adiabatic shock that forms the bright shell of the PN. Before this point, the nebula would have been inside the AGB wind bubble created by the AGB wind bow shock. At the depicted time, the nebula has expanded enough to be interacting with the AGB wind bow shock. Whilst the nebular shell has a constant temperature all the way round, the upstream part of the shell is now compressing the AGB wind bow shock and thus has a far higher density. Velocities in this higher density region
range up to 20 km s−1. The right-hand panel of Fig. 4 is a synthetic
image obtained by squaring the density and collapsing the data cube along the line of sight. This is a simple approximation and does not account for temperature or optical depth. The nebula appears to be brightened upstream where the higher densities are located. The downstream portion of the nebula ring is faint yet clear behind the bright arc with the tails connecting together further downstream.
Fig. 5 shows the state of the PN–ISM interaction 2000 yr into the PN phase. At this stage, the object is most reminiscent of Sh 2−188.
C
2005 The Authors. Journal compilationC2005 RAS, MNRAS 366, 387–396
at University of Leeds on May 8, 2013
http://mnras.oxfordjournals.org/
Figure 6. Shown on the left-hand panel is a slice through the data cube showing the logarithm of density at a point 3000 yr into the PN phase. On the right-hand panel is a representation of what the nebula might look like in emission. The images are 1 pc on a side. The scaling bar shown refers to the density slice and is presented in 10−6M
pc−3.
The upstream arc is brightened, there is a faint completion of the nebular ring and the tails connect together downstream. Velocities in the upstream bright arc range from 20 to 70 km s−1. Importantly,
the central star is now displaced 10 per cent of the geometric ra-dius upstream of the geometric centre. The IPHAS observations of Sh 2−188 reveal the central star to be approximately 33 per cent of the geometric radius upstream of the geometric centre. The faint con-nection of the ring downstream is the part of the nebula responsible for this displacement. As the PN shell expands, it is slowed upstream by interaction with the AGB wind shock whereas downstream, the PN shell is progressing quicker through undisturbed AGB material, thus causing the geometric centre to move downstream.
The structure of the PN–ISM interaction after 3000 yr of the PN phase is shown in Fig. 6. The nebula is now departing from circular symmetry and hence appearing less like Sh 2−188. The brightest regions are moving downstream to where the PN shell is still interacting with the shocked AGB material in the tails. The velocities in these regions range between 20 and 50 km s−1as do the
velocities in the shocked high-density material at the head of the bow shock. The apparent displacement of the central star is approaching 30 per cent of the geometric radius, similar to the star in the case of Sh 2−188. Eventually, after the UV flux of the central star has turned off and the star has entered the white dwarf cooling regime, the fast wind will cease. At this time the whole nebula is swept downstream, and the star begins to desert its nebula as it continues to move at high speed, leaving its tail behind.
4.2 AGB structure and evolution
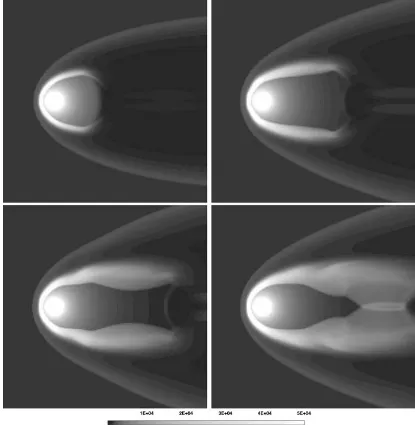
The formation and evolution of the bow shock which so strongly influences the PN shaping is of interest. Fig. 7 shows a slice of the computational domain through the position of the central star at var-ious times in the AGB phase. The panels illustrate the development of the bow shock and tail structure. Note that the true structure can be thought of as a rotation of the slices about the symmetry axis through the central star. Compression and deformation of the slow
wind against the ISM rapidly forms a bow shock ahead of the star as shown in Panel A, 12 500 yr after the start of the AGB phase. In Panel B, 25 000 yr into the AGB phase, material stripped by ram pressure from the head of the bow shock is flowing downstream and beginning to form tails behind the nebula. Eventually, 37 500 yr into the AGB phase, the flow collimates these tails downstream of the nebula and they appear to join. At this point in time the structure has reached a stable state with the position of the reverse shock ahead of the central star being predicted by a simple ram pressure balance argument. The temperature of the shocked ISM material at the head of the bow shock is approximately 200 000 K. This is in agreement with strong shock theory which predicts the temperature to be (3/16) (mv2
ISM/k), in this case a temperature of 205 500 K.
Radiative cooling in the simulation has compressed this region. The shocked AGB material is 10 times more dense and at a temperature of a few thousand K. The bow-shock material cools as it is ram pressure stripped downstream. The structure shown in the fourth panel of Fig. 7 is the state after 50 000 yr of the AGB phase, with material clearly flowing back down the tails. This structure does not change for the next 50 000 yr. The injected stellar wind balances the material moving downstream.
An instability at the head of the bow shock causes material to move down the tails in waves. This instability can be attributed to vortex shedding at the head of the bow shock, but the high-flow velocity does not allow the vortices to form fully downstream. In our simulations of lower velocity central stars, this vortex shed-ding has been seen to destroy the smooth tail structure. This effect is not in the scope of this paper and will be discussed at length elsewhere.
4.3 Proper motion of the central star
Our simulation reproduces the observed features as described above, if the central star has a peculiar velocity of 125 km s−1. If the star
is within 1 kpc as predicted by various authors (see Table 1) and moving as we predict at 125 km s−1, it should have an appreciable
at University of Leeds on May 8, 2013
http://mnras.oxfordjournals.org/
PNe shaping through interaction with the ISM
393
Figure 7. Logarithmic density plots showing the development of the bow-shock structure and tails during the AGB phase of evolution for a central star with a peculiar velocity of 125 km s−1. The images are 1pc on a side. Panel A (upper left hand) is after 12 500 yr, panel B (upper right hand) after 25 000 yr, panel
C (lower left hand) after 37 500 yr and panel D (lower right hand) after 50 000 yr. Density is presented in 10−6M
pc−3.
Table 2. A summary of observations of the central star of Sh 2−188 used in the estimation of proper motion. Thevalues give the
measurement uncertainties. The IPHAS star has a magnitude of r=17.4 and r−Hα=r−i=0.0.
Epoch α δ α δ Source
(hh mm ss.s) (dd ) (arcsec) (arcsec)
1976.9 01 30 33.113 58 24 50.680 0.128 0.094 USNO-B1 (Monet et al. 2003)
1992.8 01 30 33.185 58 24 49.540 1.0 1.0 Tweedy & Kwitter (1996)
2003.8 01 30 33.203 58 24 50.290 0.165 0.165 IPHAS r band (Drew et al. 2005)
angular shift on the sky over a relatively short epoch. The heliocen-tric radial velocity is reported asvr= −26±10 km s−1. Corrections
for the Solar motion and Galactic rotation approximately cancel. Thus, a tangential velocityvt=122 km s−1with respect to the local
standard of rest (LSR) would be expected.
With this in mind, we have performed a proper-motion analysis of the central star via astrometric methods. The observations used for this are detailed in Table 2. Initially we looked for a shift between
the IPHAS observations discussed earlier and the observations of Tweedy & Kwitter (1996) taken in late 1992 at the 36-in. Burrell Schmidt telescope on Kitt Peak, using unbinned IPHAS images with a pixel size of 0.333 arcsec. Observations of Tweedy & Kwitter (1996) have a pixel size of 2.05 arcsec, which was insufficient to detect a shift in the position of the candidate central star.
Following this we found that the central star was listed in the USNO-B1 catalogue (Monet et al. 2003) (star number
C
2005 The Authors. Journal compilationC2005 RAS, MNRAS 366, 387–396
at University of Leeds on May 8, 2013
http://mnras.oxfordjournals.org/
[image:8.612.91.524.581.642.2]1484−0053964). This catalogue obtained data from scans of 7435 Schmidt plates taken for various sky surveys over the past 50 yr. The candidate central star had been observed in 1976.9 to a high positional accuracy. We fitted the positions in the catalogue to stars around the nebula up to a radius of 10 arcmin. The rms of the fit was 0.04 arcsec. We detected a significant shift of the candidate central star of 0.8 arcsec. This shift equates to a proper motion of the central star of Sh 2−188 of 26±11 mas yr−1in right ascension
(RA) and of−15±10 mas yr−1in declination (Dec.). The 1992.8
epoch position encompasses the expected position of the central star at that time.
This proper motion corresponds to a total displacement in the plane of the sky of 30±10 mas yr−1, with a position angle of 120◦±
20◦east through north. The proper-motion corrections due to Galac-tic rotation and due to the Solar motion approximately cancel in this direction. Assuming the central star is moving at 122±25 km s−1,
the distance to the nebula is estimated to be 850+500
−420pc. This distance
range is in good agreement with the estimates of Napiwotzki (1999, 2001) and Saurer (1995). The measured proper motion is in the di-rection expected from our simulation supporting the identification of the central star of Sh 2−188.
Although the agreement of our simulation with observation is encouraging, this should not be overstated. We have investigated a large parameter range in velocity, but the range of possible density contrasts is very large and we do not claim the final result is unique. In fact, now the distance has been determined, we can also compare the physical size of the nebula with the simulation: this reveals that the initial solution predicts a far smaller nebula than is observed. A solution to this discrepancy is discussed in Section 5.
5 T H E S I Z E O F T H E N E B U L A
If, as the proper motion combined with the simulation predicts, the central star is at 850 pc, there is a discrepancy over the physical size of the nebula between the observations and simulation. The observa-tions show the nebula is 2.5 pc in diameter whereas in the simulation it is only around one-tenth of this size. The large difference requires a change to the assumed values of the physical parameters. Since the proper-motion distance and other distance determinations agree, we keep the velocities unchanged and adjust the densities. This ap-proach is also suggested by the fact that observed AGB (super) wind velocities vary by not much more than a factor of 2, whilst the mass-loss rates can vary by a factor of 100. A similar argument can be made for the ISM density versus the peculiar velocity.
A simple rescaling of the simulation allows one to change the densities and radii, without changing the dimensionless model re-sults. We wish to generalize the model holding the velocities in the simulation constant and increase the size of the nebula by a factor of 10. The size of the nebula is defined by the size of the AGB wind bubble which is in turn described by a simple ram pressure balance argument. To move the physical position of the ram pressure bal-ance point (reverse shock of the AGB wind bow shock) 10 times further upstream requires a factor of 100 increase from the ratio of slow-wind mass loss to ISM density, when keeping velocities con-stant. Increasing mass, length and time by a factor of 10 decreases density by a factor of 100. Thus the simulation domain and nebula are 10 times larger. The time-scales also increase by a factor of 10: now 500 000 yr on the AGB is required for a stable morphology to develop. This is in line with the 495 000 yr AGB evolution predicted analytically by Vassiliadis & Wood (1993, 1994). The surrounding ISM has dropped in density from 1 to 0.01 cm−3, a value consistent
with the warm ionized medium (WIM) rather than warm neutral
medium. The rescaling shows that we do not in any way predict the loss rate in the slow wind, only the ratio between the mass-loss rate and ISM density. The snapshots of the nebula and AGB evolution presented in the results section become 10 times older and Sh 2−188 now appears most like the simulation after 20–30 000 yr of PN evolution. Thus, the distance, diameter and age are all in accordance with Napiwotzki (1999, 2001) and Saurer (1995).
Cooling times and cooling effects in the simulation are related to density and so decreasing the density by a factor of 100 alters the cooling. We have rerun the simulation with this rescaling and found that the altered cooling produces the same morphology as the initial simulation, thus the rescaling seems entirely reasonable.
6 D I S C U S S I O N
The triple-wind model can reproduce the appearance of the nebula Sh 2−188. Accepting the model, the nebula has a peculiar motion with respect to the local ISM of 125 km s−1. The peculiar motion
is mostly in the plane of the sky with the radial velocity around
−25 km s−1. The star is located close to the Galactic plane
sug-gesting the star belongs to the disc population. The average trans-verse motion of a PN-forming central star in the Galactic disc is 40–60 km s−1 (Binney & Merrifield 1998; Dgani & Soker 1998;
Skuljan, Hearnshaw & Cottrell 1999). The tail of the distribution extends up to 130 km s−1(Skuljan et al. 1999; Feast & Whitelock
2000). The velocity of the central star is therefore high, yet not un-feasibly high. It would be less extreme if the star were a thick disc star which have local average velocities of 50–75 km s−1(Binney &
Merrifield 1998).
High peculiar velocities are more likely in older stellar popula-tions. This is in conflict to the type I classification of the nebula: the nitrogen enrichment indicates a more massive progenitor. However, the high [NII]/Hαratio may be caused by shock excitation, and does not necessarily imply an N overabundance. Further evidence of shock excitation is provided by the observation that the sulphur lines are stronger than Hβλ4861 lines at all points where they have been measured (Kwitter 1979).
The central star of Sh 2−188 belongs to the tail of the velocity distribution of (older) disc stars. Its rarity is borne out in the unique filamentary, one-sided appearance of the nebula, which is without parallel among known Galactic PNe. The simulations presented in Wareing (2005) show that a velocity of less than 75 km s−1 does
not result in connecting tails behind the nebula and between 50 and 100 km s−1vortex shedding from the head of the bow shock seems
to destroy the smooth tail structure observed in the nebula. A speed in the region of 125 km s−1(using increments of 25 km s−1) is thus
the lowest speed from the simulations at which the morphology of Sh 2−188 is reproduced.
The observed fragmentation of the bow shock can be understood in terms of the effect predicted by Dgani & Soker (1994, 1998) (hereafter referred to as DS). They postulated that Rayleigh–Taylor instabilities would fragment a bow shock in the direction of motion. Magnetic fields would suppress certain modes of fragmentation and accentuate others, changing the appearance. Sh 2−188 is located in the Galactic plane and thus DS interpreted its fragmentation as being an effect of fluid and magnetic field instabilities. Importantly, DS conclude that fragmentation of a substantial part of the halo occurs only for a proper motion of greater than 100 km s−1. This provides
a lower limit to the proper motion of Sh 2−188 and supports the proper motion inferred from the simulation of 125 km s−1. There
is no fragmentation in the simulation which could be attributable to a lack of resolution, the lack of magnetic field or a lack of a
at University of Leeds on May 8, 2013
http://mnras.oxfordjournals.org/
PNe shaping through interaction with the ISM
395
gravitational field. Further, there is in reality temporal evolution of the slow wind, with thermal pulses at the end of the phase. It is pos-sible that these pulses of high mass loss could stratify and fragment the bow-shock structure before the PN phase. As long as the life-time of these stratifications allows them to survive late into the PN phase (which is questionable), the fast wind could reveal and fur-ther fragment them in a similar manner to the observed filamentary structure.
Spectroscopic data of the bright filaments taken by Rosado & Kwitter (1982) revealed velocities between 20 and 70 km s−1. The
velocities in the simulation show the same range in the high-density regions at the head of the bow shock which in reality is thought to have fragmented forming the observed filamentary structure. This agreement between the simulation and observations is very encour-aging, although no more velocity data on this object are available to us for a more detailed comparison at this time. It should be noted that in our model these velocities are not related to the nebular ex-pansion, but instead to the flow of shocked material from the head of the bow shock back down the tails.
The faint emission completing the bright arc is particularly im-portant. In the simulation this structure has a transitory nature and moves quickly away from the central star: it traces the interaction between the fast post-AGB wind and the slow AGB wind (else-where in the nebula this front has merged with the ISM shock). One reason for the fast movement of this shock is the high ratio of post-AGB/AGB momentum which we use.
The distance downstream of the ring from the central star com-pared to the distance upstream of the bright arc defines the shift of the geometric centre and provides a calibrator for the simula-tion presented here. The rescaling of the simulasimula-tion predicts the age of the nebula between 20 and 25 000 yr. Napiwotzki (1999, 2001) suggests that the star is 22 000 yr into the post-AGB phase.
The simulation is not entirely in agreement with the observations. The progressive displacement of a star from the geometric centre of a nebula is an indicator of evolution and in the case of large nebulae, advanced evolution (Tweedy & Kwitter 1996). The central star of Sh 2−188 appears to be approximately 33 per cent of the geometric radius towards the bright arc from the geometric centre. The rescaled simulation indicates that after 20 000 yr of PN evolution, the star should appear 10 per cent of the geometric radius upstream of the geometric centre. 10 000 yr later, the simulation shows the central star approaching 30 per cent of the geometric radius upstream, in better agreement with the observations. However, by this time, the simulation predicts the bright regions of emission will have begun to shift downstream to where the PN shell is interacting with the tail. A better representation of the time-dependent stellar winds may be needed to resolve this issue. Napiwotzki (1999, 2001) locate the star near the start of the white dwarf cooling track. At this point, the wind is expected to cease. The forward ram shock will no longer be supported by internal pressure and will retreat. The nebula will be blown downstream and disintegrate, and the white dwarf will appear to move out of its nebula. This phase is not included in the simulation. However, it implies that the Sh 2−188 morphology has a limited life expectancy.
Interaction with the ISM considerably alters the amount of mass within the circumstellar envelope during the AGB and post-AGB phases. The simulation reaches a point of stability during the lifetime of the AGB evolution (Vassiliadis & Wood 1993, 1994): a longer AGB wind does not increase the mass of the shell. After 20 000 yr of the PN phase, an investigation of the (rescaled) simulation reveals that 0.6 Mhas been introduced into the spherical region of the nebula. This is made up of 0.5 Mlost by the star and 0.1 Mof
ISM material entering the cross-section of the nebula. An integration of the data cube over a roughly spherical region centred on the central star with the nebular radius estimates 0.236 Mremaining within the PN boundary. Thus, 0.364 Mof material has been swept downstream into the tail of the nebula. In fact, the observed tail of the nebula is far older than the nebula itself as it is made up of AGB and ISM material swept downstream. It is likely that most of the ISM material introduced into the stellar region has been swept downstream, but still a minimum of 0.264 Mof stellar material has been mixed with the ISM downstream providing an efficient method of returning stellar material directly to the ISM.
Observations have revealed a missing-mass problem in PNe whereby only a small fraction of the mass ejected during the AGB phase is inferred to be present during the post-AGB phase. Stel-lar evolution calculations predict that stars with initial masses in the range of 1–5 Mwill end as PN nuclei with masses around 0.6 M. Most of the mass is lost during the AGB phase and should be easily observable as ionized mass during the PN stage. How-ever, observations of Galactic PNe have revealed on average only 0.2 Mof ionized gas. Several PNe have been shown to have em-bedded molecular clumps which could contain much of this missing mass and these clumps have been shown to survive ablation by stel-lar winds and therefore could survive into the PN phase (Pittard et al. 2005). The stripping of mass downstream of a moving PNe as inves-tigated here also provides an attractive solution to this missing-mass problem; the Dumbbell nebula appears to have clumps of material surrounding the bright nebula inside what would appear to be an AGB wind bow shock (Meaburn et al. 2005) combining both of these solutions to the missing-mass problem.
Observations (Napiwotzki 1999, 2001) have indicated that the central star of Sh 2−188 has a mass of 0.6 M. These observations, in combination with the mass injected into our simulation and the addition of mass lost prior to the superwind phase (a typical estimate for low-mass stars being0.5 M) allows us to estimate a mass of
∼1.5 Mfor the progenitor star.
Villaver, Garcia-Segura & Manchado (2002) discussed evolution of AGB stars and the interaction of their dust shells with the ISM. Typically, AGB stars form large shells (up to 4 pc in diameter) around them. Evidence for such an AGB–ISM interaction front was found by Zijlstra & Weinberger (2002), who found a M3 III AGB star surrounded by such a detached shell of 4-pc diameter. The ISM influence is defined by the density and hence pressure in the ISM, which drops off exponentially from nH=2 cm−3(Spitzer 1978) at a
scale height of 100 pc (Binney & Merrifield 1998). The regular shells can be influenced strongly by the movement through the surrounding ISM. The AGB evolution of the central star of Sh 2−188 shows a structure extensively altered from these regular dust shells. Much of the AGB material has been swept downstream.
At a distance of 850 pc, the nebula is 60 pc below the Galactic plane. We would expect the ISM density in the region of Sh 2-188 to be around nH=2 cm−3, so it would seem our rescaling choice of
nH=0.01 cm−3is at odds with this. However, large regions of the
Galactic plane in between spiral arms are dominated by such low-density gas, including the volume around the Sun (Frisch 1995). In fact, the NE2001 model (Cordes & Lazio 2002), used commonly in the pulsar community to predict the galactic distribution of free electrons, predicts an electron density in the direction of Sh 2−188 of ne=0.013 cm−3at a distance of 850 pc. This is in very good
agreement with our prediction, but it should be stressed that this is only one choice of AGB mass-loss rate to ISM density ratio. A higher mass-loss rate would increase the ISM density, although this would have implications for the mass in the nebular region. The
C
2005 The Authors. Journal compilationC2005 RAS, MNRAS 366, 387–396
at University of Leeds on May 8, 2013
http://mnras.oxfordjournals.org/
direction of motion indicates the star is moving almost entirely in Galactic longitude and has travelled 64 pc during the AGB and post-AGB phases. Therefore the assumption of constant ISM properties during the AGB and post-AGB evolution of the central star may not be correct.
7 C O N C L U S I O N S
We have successfully reproduced the morphology and the available kinematic data of Sh 2−188 and understood its formation in terms of the ‘triple-wind’ model. Following the AGB evolution of the cen-tral star has been crucial in fitting the whole structure, in particular the tail behind the nebula which is comprised of purely AGB ma-terial. The triple-wind model of Sh 2−188 has predicted a velocity of the candidate central star of 125 km s−1. Velocities from
spectro-scopic data on the bright filaments (Rosado & Kwitter 1982) are in agreement with velocities measured from the simulation. A proper-motion study of the central star has shown it to be moving at 30.0± 10.0 mas yr−1 in the direction of the head of the bright arc. The
combination of these two measurements has resulted in estimates of D=850+500
−420pc, d∼2.5 pc and tPN=22 500±2500 yr. These
estimates are in agreement with the distance and age estimates of Saurer (1995) and Napiwotzki (1999, 2001). The prediction of ISM density in the vicinity of Sh 2−188 is also in agreement with the NE2001 model of Cordes & Lazio (2002). The triple-wind model explains the geometric displacement of the central star and indi-cates that the faint closure of the bright arc is a transitory structure which evolves downstream of the nebula. The PN–ISM interaction has caused approximately two-thirds of the mass expected in the region of the star to be swept downstream providing a solution to the missing-mass phenomenon in PN and a valuable way of mixing ISM and stellar material several pc downstream of the central star.
The success of the triple-wind model to fit this extreme object gives confidence in our ability to fit objects with lower speeds. It is now clear that the outer halo structure of PNe contain the effects of ISM interaction and should not be modelled as stand-alone structures. Further, the ISM interaction is an important method of mixing stellar material back into the ISM. The next generation of telescopes, particularly Atacama Large Millimeter Array (ALMA), will be able to reveal cool dust structure in the Universe and shed light on circumstellar AGB material. Further simulations consider-ing temporal evolution of the stellar winds, magnetic fields and/or gravity may shed light on why we have not reproduced the observed fragmentation in Sh 2−188.
AC K N OW L E D G M E N T S
CJW was supported by a PPARC research studentship. The numer-ical computations were carried out using the Jodrell Bank Observa-tory COBRA supercomputer. This paper uses data obtained from the IPHAS survey, carried out at the INT on the island of La Palma. The INT is operated by the Isaac Newton Group in the Spanish Obser-vatorio del Roque de los Muchachos of the Instituto de Astrofisica de Canarias. The authors acknowledge the IPHAS collaboration, consisting of, in addition to authors of this paper: A. Aungwerowijt, M. Barlow, R. Corradi, D. Frew, B. G¨ansicke, P. Groot, A. Hales, E. Hopewell, M. Irwin, C. Knigge, P. Leisy, D. Lennon, A. Mam-paso, M. Masheder, M. Matsuura, L. Morales-Rueda, R. Morris, Q. Parker, S. Phillips, P. Rodriguez-Gil, G. Roelofs, I. Skillen, D. Steeghs, Y. Unruh, K. Viironen, J. Vink, N. Walton, A. Whitham and A. Zurita. Useful comments from Sir Francis Graham-Smith,
Ian Browne and Alan Pedlar at Jodrell Bank led to a useful dis-cussion with Michael Kramer, also at Jodrell Bank, over electron densities. Finally, thanks to the referee, John Dyson, for excellent constructive comments which led to the supportive comparisons with available spectroscopic data.
R E F E R E N C E S
Acker A., Marcout J., Ochsenbein F., Stenholm B., Tylenda R., 1992, Stras-bourg – ESO catalogue of galactic planetary nebulae. European Southern Observatory, Garching
Balick B., 1987, AJ, 94, 671
Binney J., Merrifield M., 1998, Galactic Astronomy. Princeton Univ. Press, Princeton, NJ
Borkowski K. J., Sarazin C. L., Soker N., 1990, ApJ, 360, 173
Burton W. B., 1988, in Kellermann K., Verschuur G. L., eds, Galactic and Extragalactic Radio Astronomy. Springer, New York, p. 295
Cahn J. H., Kaler J. B., Stanghellini L., 1992, A&AS, 94, 399 Cordes J. M., Lazio T. J. W., 2002, preprint (astro-ph/0207156) Dgani R., Soker N., 1994, ApJ, 434, 262 (DS)
Dgani R., Soker N., 1998, ApJ, 495, 337 (DS) Drew J. E. et al., 2005, MNRAS, 362, 753 Falle S. A. E. G., 1991, MNRAS, 250, 581
Feast M. W., Whitelcok P. A., 2000, MNRAS, 317, 460 Frisch P. C., 1995, SSRv, 72, 499
Gaze V. F., Shain G. A., 1965, Izv. Krym. Astrofiz. Obs., 15, 11
Gurzadyan G. A., 1969, Planetary Nebula. Gordon & Breach, New York, p. 235
Isaacmann R., 1979, A&A, 77, 327 Israel F. P., Felli M., 1976, PASP, 87, 89 Johnson H. M., 1975, PASP, 87, 89 Kwitter K. B., 1979, PhD thesis, UCLA
Kwitter K. B., Jacoby G. H., Lydon T. J., 1988, AJ, 96, 997 Kwok S., 1982, AJ, 258, 280
Lozinskaya T. A., Esipov V. F., 1971, Soviet Astr.-AJ, 15, 353
Meaburn J., Boumis P., Christopoulou P. E., Goudis C. D., Bryce M., Lopez J. A., 2005, RMxAA, 41, 109
Monet D. G. et al., 2003, AJ, 125, 984 Napiwotzki R., 1999, A&A, 350, 101 Napiwotzki R., 2001, A&A, 367, 973
Napiwotzki R., Schoenberner D., 1995, A&A, 301, 545
Oort J. H., 1951, Problems of Cosmical Aerodynamics. Central Air Docu-ment Office, Dayton
Parker R. A. R., 1964, ApJ, 139, 493
Peimbert M., 1981, Physical Processes in Red Giants. D. Reidel, Dordrecht, p. 409
Pittard J. M., Dyson J. E., Falle S. A. E. G., Hartquist T. W., 2005, MNRAS, 361, 1077
Rosado M., Kwitter K. B., 1982, RMxAA, 5, 217
Salter C. J., Greve A., Weiler K. W., Birkle K., Dennefeld M., 1984, A&A, 137, 291
Saurer W., 1995, A&A, 297, 261 Sharpless S., 1959, ApJS, 4, 257
Skuljan J., Hearnshaw J. B., Cottrell P. L., 1999, MNRAS, 308, 731 Smith H., 1976, MNRAS, 175, 419
Soker N., Borkowski K. J., Sarazin C. L., 1991, AJ, 102, 1381
Spitzer L. Jr., 1978, Physical Processes in the Interstellar Medium. Wiley, New York, p. 234
Tweedy R. W., Kwitter K. B., 1996, ApJS, 107, 255 Vassiliadis E., Wood P., 1993, ApJ, 413, 641 Vassiliadis E., Wood P., 1994, ApJS, 92, 125
Villaver E., Garcia-Segura G., Manchado A., 2002, ApJ, 571, 880 Villaver E., Garcia-Segura G., Manchado A., 2003, ApJ, 585, L53 (VGM) Wareing C. J., 2005, PhD thesis, Univ. of Manchester
Zijlstra A. A., Weinberger R., 2002, ApJ, 572, 1006
This paper has been typeset from a TEX/LATEX file prepared by the author.
at University of Leeds on May 8, 2013
http://mnras.oxfordjournals.org/