Rochester Institute of Technology
RIT Scholar Works
Theses
12-14-2018
Transcriptome-Wide Analysis of VSV Strains with
Varying Ability to Block NF-κB
Thomas M. Russell [email protected]
Follow this and additional works at:https://scholarworks.rit.edu/theses
This Thesis is brought to you for free and open access by RIT Scholar Works. It has been accepted for inclusion in Theses by an authorized administrator of RIT Scholar Works. For more information, please [email protected].
Recommended Citation
Transcriptome-Wide Analysis of VSV
Strains with Varying Ability to Block NF-κB
by
Thomas M. Russell
A Thesis Submitted in Partial Fulfillment of the
Requirements for the Degree of Master of Science in
Bioinformatics
Thomas H. Gosnell School of Life Sciences
College of Science
Rochester Institute of Technology
Rochester, NY
Rochester Institute of Technology Thomas H. Gosnell School of Life Sciences Bioinformatics Program
To: Head, Thomas H. Gosnell School of Life Sciences
The undersigned state that Thomas Russell, a candidate for the Master of Science degree in Bioinformatics, has submitted his thesis and has satisfactorily defended it.
This completes the requirements for the Master of Science degree in Bioinformatics at Rochester Institute of Technology.
Thesis committee members:
Name Date
_________________________________________ _________________ Maureen C. Ferran, Ph.D.
Thesis Advisor
_________________________________________ _________________ Feng Cui, Ph.D.
_________________________________________ _________________ Matthew Morris, Ph.D.
_________________________________________ _________________ Julie A. Thomas, Ph.D.
Abstract
Vesicular stomatitis virus (VSV) is a negative sense, single-stranded RNA (ssRNA) virus that is
currently studied for its uses as a vaccine viral vector and its potential in oncolytic therapy. The
M protein of VSV is the active participant in the virus’s abrogation of the host innate immune
response. This activity is thought to be due to the M protein’s ability to downregulate overall
host transcription by blocking nuclear transport. A VSV mutant containing a D52G mutation in
the M protein (22-20) has been shown to block nuclear transport while being defective as a
suppressor of NF-κB activation. It is thus believed that while previous M protein mutant viruses
are defective in both host transcription suppression and NF-κB activation, 22-20 is deficient in
only one of these activities. This study aims to identify differentially expressed genes (DEGs)
and pathways through transcriptome analysis of host response to VSV mutants. Our research
leads us to believe that 22-20 does in fact down regulate overall host transcription, while being
inefficient in suppressing NF-κB mediated immune response pathways. We also discovered
important DEGs in the apoptosis pathway, including the antiapoptotic protein Mcl1, where
downregulated by 22-20 to a greater degree than another mutant, 22-25. This combination of
factors, deficiency in NF-κB suppression and increased apoptotic activation, could make 22-20
T
ABLE OFC
ONTENTSABSTRACT ... 3
INTRODUCTION ... 7
INTRODUCTION TO THE VIRUS ... 7
THE INFECTIOUS CYCLE OF VSV ... 9
TYPE IINTERFERON RESPONSE ... 12
INDUCTION OF AN IFN RESPONSE ... 12
VIRAL EVASION OF THE IFNRESPONSE ... 14
VSV AND THE IFNRESPONSE ... 15
PROJECT FOUNDATION ... 16
BROADER IMPACTS ... 20
MATERIALS AND METHODS ... 21
CELLS, VIRUSES, AND INFECTIONS ... 21
RNAISOLATION ... 21
RNA-SEQ ... 21
DATA QC AND ANALYSIS ... 22
INTERNAL RNA-SEQ WORKFLOW ... 23
DIFFERENTIAL EXPRESSION AND BIOLOGICAL PATHWAY ANALYSIS ... 23
RESULTS ... 24
HEATMAP ANALYSIS ... 25
VENN DIAGRAM COMPARISON ... 26
KEGG AND GENE ONTOLOGY ANALYSIS ... 27
DISCUSSION ... 52
FUTURE WORK ... 57
CONCLUSION ... 57
REFERENCES ... 58
Abbreviations and Acronyms Antigen presenting cells ... 12
cDNA: Complimentary DNA ... 21
CEC: Chicken-embryo cells ... 17
DEG(s): Differentially expressed gene(s) ... 19
dsRNA: double stranded RNA ... 12
EBOV: Ebola virus ... 14
EMEM: Eagle’s Minimum Essential Medium ... 21
FDR: False discovery rate ... 27
G: Glycoprotein ... 7
GFF: General feature format ... 22
GO: Gene Ontology ... 48
IFN: Interferon ... 12
IRF: Interferon regulating factor ... 13
ISG: Interferon stimulated genes ... 14
IκBs: Inhibitors of κB ... 13
L: Large polymerase protein, catalytic ... 7
logFC: Log fold change ... 27
M: Matrix protein ... 7
MDS: Multidimensional scaling ... 24
MOI: Multiplicity of infection ... 21
N: Nucleoprotein ... 7
NLS: Nuclear localication signal ... 13
P: Phosphoprotein, non-catalytic ... 8
PAMPS: Pathogen associated molecular patterns ... 12
PRRs: Pattern recognition receptors ... 12
PTM: Post-translational modification ... 14
RLR: RIG-I like receptors ... 12
RNP: Ribonucleoprotein ... 7
snps: Single-nucleotide polymorphisms ... 23
ssRNA: Single-stranded RNA ... 10
TLR: Toll-like receptors ... 12
VSV: Vesicular Stomatitis Virus ... 7
Introduction
Introduction to the Virus
Vesicular stomatitis virus (VSV) is the prototypical member of the family Rhabdoviridae. Unlike
many viruses, VSV can infect a diverse number of vertebrate and invertebrate hosts, and even
some species of plants. Although the virus has a broad host range, its preferred hosts include
horses, mules, cattle, bison, sheep, goats, and pigs. Clinical signs of infection include the
formation of vesicles, on the skin on the muzzle, tongue, teats and above the hooves of
susceptible livestock. Although VSV typically causes a non-fatal infection in mammals, it creates
a burdensome socio-economic issue when it infects these livestock. In contrast to rabies, a
closely related virus that is also a member of the Rhabdovirus family, VSV rarely infects humans
outside of select cases, and only causes self-limiting, flu-like symptoms (3).
Like other members of the Rhabdoviridae family, the VSV particle is bullet shaped (Figure 1)
and is composed of two main components: the nucleocapsid or ribonuleoprotein (RNP) core
group and the envelope group (3). Each component has specialized functions. The
nucleoprotein (N) encapsidates the viral RNA, thus forming the RNP core. This binding protects
the genome from degradation once inside the host cell. The matrix (M) protein is a bridging
molecule between the central RNP and the plasma membrane. It is also responsible for several
other functions including regulation of apoptosis and inhibition of host RNA polymerase II and
III activity. The transmembrane glycoprotein (G) protein is essential for attachment of the virus
to the cellular receptor. Together, the catalytic large (L) protein and the non-catalytic
production of new viral RNA during replication and transcription. This complex adds a poly A tail
to one end of each viral mRNA and also adds a modified cap structure to the other end, which
[image:9.612.73.540.170.432.2]enables its recognition by the host ribosomes (3).
Figure 1. Diagram of VSV (ViralZone, SIB Swiss Institute of Bioinformatics)
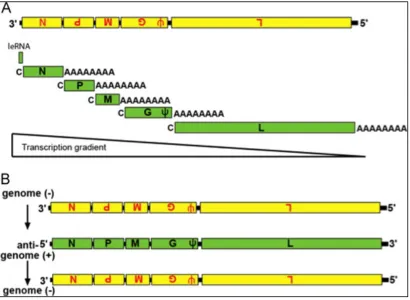
The RNA genome is approximately 11 kb long and encodes 5 major genes in the following
order: 3’- N – P- M – G – L – 5’ (Figure 2). Transcription of the viral genome is polar and
sequential, meaning there is a single transcription initiation site at the 3’ end of the genome
and transcription of each gene depends on transcription and termination of the gene
immediately upstream. For example, transcription of the P gene is dependent on the proper
transcription and termination of the N gene. This polar and sequential mode of transcription
results in attenuation of viral transcription because the viral polymerase is more likely to fall off
the genome as it travels farther from the 3’end. In other words, efficiency of transcription
monocistronic mRNA is the most abundant while much less L mRNA is transcribed. This
transcriptional attenuation results in production of a gradient of viral proteins (4). On average,
there is 20%-30% more of the previous protein than the one following it (3). The proportional
generation of these proteins is extremely important, since changing the order, decreases viral
[image:10.612.72.530.227.400.2]fitness.
Figure 2. Vesicular stomatitis virus genome (ViralZone, SIB Swiss Institute of Bioinformatics)
The infectious cycle of VSV
Adsorption:
The infectious cycle begins with the pH dependent, adsorption of the virion via the G protein to
the cell surface receptor (3). This receptor is thought to be the LDL receptor (LDLR) along with
other members of the LDL family (5) This family of receptors is found on many cell types and
explains why VSV has such a broad host range (5).
Penetration and uncoating:
The pH and temperature dependent process of virus penetration, proceeds through the cell
membrane quickly via receptor mediated endocytosis (3). Next the virus is uncoated (also a pH
Transcription:
VSV is a negative sense, single stranded RNA (ssRNA) virus, which means the genome is
anti-sense to mRNA therefore the host ribosomes are unable to recognize the 5’ end of the genome
and initiate translation. First the viral polymerase must produce 5 monocistronic mRNAs from
the input genome using a start and stop mechanism (Figure 3A). For example, the polymerase
initiates transcription at the beginning of the N gene, generates a positive sense copy of the
coding region, and then stops transcription at the end of the N gene and adds a modified cap
and a polyA tail. The polymerase then reinitiates (starts) and the P gene and generates an
mRNA encoding the P gene, which is capped and polyadenylated. As mentioned previously,
[image:11.612.92.502.376.676.2]transcription is polar and sequential, therefore once this process is complete, the polymerase
has produced a gradient of capped, monocistronic, polyadenylated viral mRNAs that can be
recognized by the host ribosomes and translated into viral proteins (3).
Replication:
Once enough viral proteins have been produced, the RNA polymerase switches gears and uses
the input negative sense genomes as a template to generate full-length positive sense RNA
anti-genomes. These positive genomes are then replicated by the polymerase into full length,
negative sense molecules that will be packaged into virions as genomes during assembly (Figure
3B). An interesting question about the infectious cycle of negative sense RNA viruses is how the
viral polymerase knows when to switch from transcription to replication. Evidence suggests
that when the intracellular concentration of the N protein reaches a certain threshold, it will
initiate the polymerase to create a template for the genomic RNA, thus beginning replication.
This is logical as the amount of N is crucial since un-encapsidated RNA is rapidly degraded. This
entire process of replication occurs within the cytoplasm of the host cell (3).
Assembly and Budding:
Post-translational glycosylation of G targets it for insertion into the cellular plasma membrane,
where it functions as an “anchor” for the process of assembly. The M Protein binds with high
affinity to membrane-bound G and then recruits the ribonucleoprotein cores (viral RNA plus N
and lesser amounts of L and P) to join the complex, which are then released from the cell during
a process called budding (3). This implies that the M protein is important for both assembly of
the virion and eventual release of virions. The result of assembly and budding is the creation of
Type I Interferon Response
Type I interferons (IFN-α and IFN-β) are a crucial component of the innate immune system.
These cytokines are considered the first line of defense against viral infection.In fact, IFNs are
not active against other foreign bodies aside from viruses. For the purposes of this research, we
will focus on IFN-β (IFN) which are known to induce an antiviral state in cells making them
resistant to subsequent viral attack. Once the IFN response is activated, the IFN protein is
produced and secreted outside the cell. It can then bind to IFN receptors on the cell surface of
both the infected cell and uninfected, neighboring cells (Figure 4). This binding then activates a
complex signal transduction cascade that results in the activation of over 300 genes that
function to block overall protein production inside the cell and therefore limit production of
viral proteins (7). In addition to creating an antiviral state in the cell, IFN induction also helps
the host mount an adaptive immune response by activating lymphocytes (i.e. macrophages, T
and B-Cells and natural killer cells) and antigen presentation cells (APCs) (8).
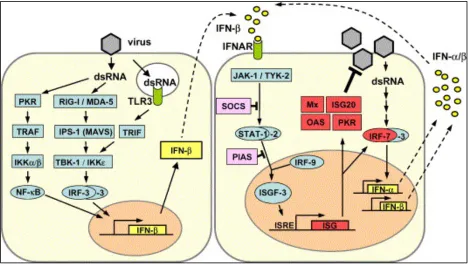
Induction of an IFN response
Inducers of the Type I IFN response are “pathogen-associated molecular patterns” (PAMPS). As
illustrated in Figure 5, these inducers include double stranded RNA (dsRNA) which (7) can be
produced by viruses as a replicative intermediate, and are recognized by “pattern recognition
receptors” (PRRs)(8). There are several families of PRRs that induce IFN, which have been
broken down into two main groups; toll-like receptors (TLR) and RIG-I like receptors (RLR). TLRs
come in different forms to detect viral infection of the cell. TLRs are transmembrane proteins
located on the intracellular endosomes membranes of many cells including leucocytes,
binds to dsRNA, which is not commonly produced by mammalian cells and thus is an indicator
of viral infection. TLR-7 binds to viral ssRNA found in the cytoplasm (7). Finally, TLR-4 has been
known to bind to the G protein of VSV (7). The TLR-4 pathway eventually initiates responses by
Interferon Regulating Factor 3 (IRF-3) and NF-κB, both of which are important transcription
factors that must be activated before IFN can be produced (7).
RLRs are expressed in some immune cells and most non-immune cells (fibroblasts, myeloid and
epithelial cells), and these receptors contain an RNA binding domain that recognizes
virus-specific RNA within the cytoplasm. RIG-I, the prototypical molecule for this group, has been
shown to detect in vitro transcribed dsRNAs. Another member, MDA5, which has a very similar
composition to RIG-I, recognizes poly(I:C) which is a simulated dsRNA, but not the in vitro
transcribed dsRNA. RNA viruses are also differentially recognized by RIG-I and MDA5 (10).
Evidence suggests that RIG-I is the RLR that recognizes VSV RNA in infected cells (11), therefore
the RIG-I dependent pathway is the focus of the work proposed here. As shown in Figure 5,
once a RLR binds to viral RNA it triggers a signal transduction cascade that activates
transcription factors (NF-κB, c-Jun, and IRF-3) that are essential for induction of early IFN-α
gene expression (Figure 4) (2). Normally NF-κB family members are sequestered in the
cytoplasm and tightly bound to Inhibitors of κB (IκBs), which keeps the molecule inactive by
masking the nuclear localization signal (NLS). After RLR-dependent activation, the IκBs are
degraded and the NLS on NF-κB is revealed, allowing it to be translocated to the nucleus where
it can induce IFN mRNA production (12). The IFN mRNA is then translated into IFN protein,
which as previously mentioned, is secreted outside the cell where it binds to its receptors on
cascading pathway that induces the production of Interferon-stimulated genes (ISG), the
formulation of which creates many hundred more products, including RIG-I, which in turn
replicates the process in a positive feedback loop (7). RIG-I knockout mouse fibroblast cells
show that IFN production was diminished following VSV infection, which led to a 1.5 log
increase in viral titers observed in these test mice (7).
Viral Evasion of the IFN Response
To combat this extremely effective form of defense, viruses have developed ways to circumvent
the host’s IFN response. For example, some viruses have evolved mechanisms to hide their RNA
from RIG-I such as post-translational modification (PTM) of the RNA, competitive viral protein
binding, and sequestering RNA into organelles other than the cytoplasm (11). Influenza A and
Ebola virus (EBOV) use a sequestering method to hide its RNA from PRRs, though the
VSV and the IFN Response
VSV is exquisitely sensitive to the effects of IFN-β. In fact, one molecule of IFN is sufficient to
block successful VSV infection (14). In response, VSV also has its own methods of evading the
IFN response. It is believed that the M protein is the most active participant in evasion of the
IFN response within VSV-infected cells. VSV strains that encode an N-terminus mutation in M
protein that changes a methionine to an arginine at position 51 [M(M51R)] are not able to
inhibit host gene expression or suppress the IFN response, however viruses encoding this
mutation are still able to effectively replicate and assemble virions (7, 15). Research indicates
that the M protein alone can down-regulate host mRNA production, since it is sufficient to
[image:16.612.72.541.102.368.2]also able to inhibit the host RNA-dependent polymerase II (16). It has been postulated that VSV
inhibits host gene expression by binding to and interfering with the function of Rae1 and
nucleoprotein Nup98, cellular components of the nuclear pore that are required for mRNA
transport to the cytoplasm (7). These two nuclear pore proteins are complexed in the cell, and
M binding to Nup98 is indirectly mediated by Rae1. Further study is necessary to determine the
whether this binding has a direct impact on gene expression(7). An important mutant strain for
this research has been T1026R1 (R1), which encodes the M(M51R) mutation. Infection with R1,
as well as other strains encoding this mutation in M, results in induction of a robust IFN
response, however these viruses are delayed in their ability to inhibit host gene expression. Due
to these correlated activities, it has been hypothesized that the IFN response is suppressed
because M limits global host gene expression (17).
Project Foundation
It is believed that M limits the IFN response through its ability to inhibit global host
transcription (18), while others propose that the M protein also inhibits NF-κB, which in turn
abrogates IFN expression through downstream suppression (12). This belief is based on the
following: (1) M inhibits virus-mediated NF-κB activation when expressed during infection or
independently, (2) the M(M51R) mutation found in R1 abrogates this function, and (3) M
targets a step upstream of the IκB kinase (IKK) in the canonical NF-κB activation pathway. These
findings indicate that there may be two independent abilities of M involved in the abrogation of
IFN response. One is the ability of the M protein to inhibit global host transcription and the
second is the blocking of NF-κB activation, through which, the VSV M protein evades the RIG-I
However, another study shows that the M protein is not involved in suppression of the IFN
response in chicken-embryo cells (CEC) (14). Researchers compared the IFN-inducing capacity
of 36 plaque-derived subpopulations of field isolate VSV-IN no. 22 and found that only isolate
22-20 was an excellent inducer of IFN, while its sister plaques induced little to no IFN in these
cells. Interestingly, genome sequencing determined that the M gene of 22-20 was identical to
another sister isolate, 22-25 (14). Since CEC are sensitive to the effects of the M protein on host
[image:18.612.73.444.72.439.2]transcription (19), it was concluded that the M protein does not play a role in suppression of Figure 5. RIG-I pathway during infection. (Adapted from reference (1) with
the IFN response by VSV. These results could be explained if two viral functions, M-mediated
inhibition of host transcription and regulation of an early step in IFN gene induction, are
involved in regulation of IFN gene expression. While VSV mutant R1 may be defective in both
functions, isolate 22-20 may be defective in only one - the one responsible for limiting IFN
induction at an early step of transcription. As described above, it has been reported that in
addition to inhibiting host gene expression, the M protein prevents activation of NF-κB (12). To
determine if 22-20 is indeed defective in an early step of IFN gene induction, 22-20 and 22-25
have been further characterized. To begin, the genomes of both viruses were sequenced.
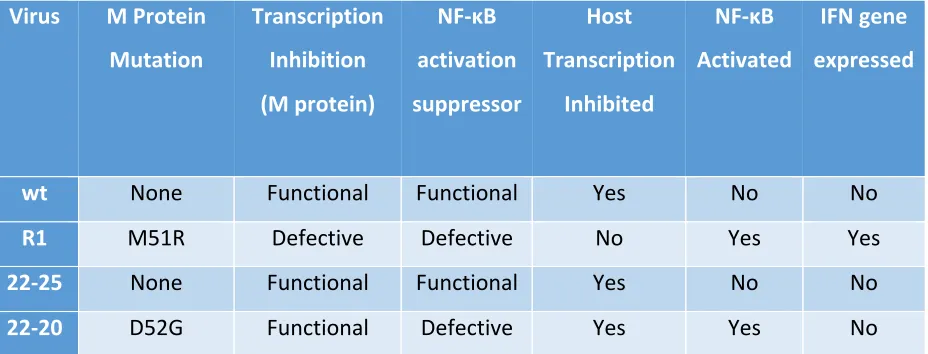
A single coding mutation was identified in the M gene of 22-20, which changed the highly
conserved aspartic acid residue at position 52 of the M protein to a glycine [M(D52G)].
Interestingly, this mutation is located one amino acid away from the M(M51R) mutation found
in R1. It was also determined that both 22-20 and 22-25 inhibited host gene expression,
indicating that the M(D52G) mutation did not perturb this function of M. Immunofluorescences
studies show that 22-25 prevents activation of NF-κB, while 22-20 activates this transcription
factor. Finally, little to no IFN mRNA or IFN protein was detected in 22-20 or 22-25–infected
cells; likely due to M-mediated inhibition of host gene expression. The researchers posit that
the M51R mutation in R1 M results in a virus that is defective in two functions, inhibition of
NF-κB activation and host gene expression, while the M(D52G) mutation in 22-20 results in a virus
that is only defective in an early step of IFN gene induction, preventing NF-κB activation (Table
Virus M Protein Mutation
Transcription Inhibition (M protein)
NF-κB activation suppressor
Host Transcription
Inhibited
NF-κB Activated
IFN gene expressed
wt None Functional Functional Yes No No
R1 M51R Defective Defective No Yes Yes
22-25 None Functional Functional Yes No No
22-20 D52G Functional Defective Yes Yes No
The overall goal of this work is to use RNA-Seq to investigate host genome expression in mouse
L929 cells infected with 22-20 or 22-25. As both viruses inhibit global host gene expression, this
comparative transcriptome analysis will identify differentially expressed genes (DEG) that are
involved in NF-κB activation and identify this and other host pathways that are perturbed
during early VSV infection. There seem to be few M protein mutations that abrogate one
cytopathic effect of the VSV M protein, while maintaining the ability to inhibit host gene
expression. Therefore, comparing this set of viruses offers a unique opportunity to understand
the actions of M protein during initial infection. This includes identifying which genes involved
with the NF-κB response are differentially expressed and ascertain the effect that the M protein
may have on host pathways during infection. RNA-Seq will allow us to determine the effect of
the [M(D52G)] mutation on the ability of M protein to abrogate the IFN response while still
[image:20.612.77.541.104.281.2]Broader Impacts
VSV has become increasingly attractive as a platform for the generation of recombinant viral
vaccines for several reasons: (1) the general human population lacks antibodies to the virus; (2)
human infections are rare and when they do occur the symptoms are mild; (3) the virus is not
genotoxic; (4) replication occurs in the cytoplasm therefore insertion into the host genome is
not a concern; (5) the virus is amenable to editing thanks to the development of a reverse
genetics system to create recombinant viruses (20). Recombinant VSV has already been used as
a vaccine vector for deadly viruses such as Marburg and Ebola virus (21). The Ebola virus
vaccine made with recombinant VSV (rVSV-ZEBOV) has gone through phase 1 and 2 trials, with
minimal side effects (22). A more recent test in Guinea, Africa showed that, after thousands of
tests with the pseudotyped VSV, not one patient became infected with the Ebola virus (23). It
has also been shown that, using a booster type immunization, pseudotyping VSV with the
glycoprotein of lymphocytic choriomeningitis virus (VSV-GP), has circumvented the rapid
creation of antibodies against the wt VSV, making it an even better viral vector (20).
For many of these same reasons, researchers are trying to use VSV as an anticancer agent. VSV,
and several other viruses are being considered for this type of therapy, creating the burgeoning
field of oncolytics; the use of certain viruses to selectively destroy cancer cells. The majority of
human cancer cells lack an IFN response, making infection by mutant M51R VSV more likely
(24). This, in turn, will produce cell death by apoptosis, leading to tumor reduction. Healthy
Materials and Methods
Cells, viruses, and infections
Monolayer of mouse fibroblast L929 (ATCC CCL-1) were grown in complete media containing
Eagle’s Minimum Essential Medium (EMEM) supplemented with 10% Horse Serum (HS). VSV
field isolates 22-20 and 22-25 were generous gifts from Philip Marcus (University of
Connecticut) and have been previously described. The heat resistant strain of the Indiana
serotype of VSV was used as the wild type (wt) virus (31, 32). All viruses were grown on either
baby hamster kidney cells or Vero cells as previously described (33). Cells were infected with
each virus at a multiplicity of infection (MOI) of 5 PFU/cell unless otherwise stated. Virus was
adsorbed in MEM for 3 h at 37 °C in the absence of serum.
RNA Isolation
Total RNA was isolated from infected L929 cells at 1 hour and 3 hours post infection (hpi) using
the TRIZol Plus RNA Isolation Kit (Life Technologies) according to the manufacturer’s directions.
To ensure that the highest quality RNA is used in this analysis, 4 biological replicates of each
condition were isolated. RNA was quantitated via nanodrop and bioanalyzer. For each
condition, the 2 highest quality samples were used for RNA-Seq.
RNA-Seq
Full workflow integrated service (RNA-Seq through Data QC and Analysis) was provided by
ProteinCT Biotechnologies (Madison, WI). Complementary DNA (cDNA) libraries were prepared
using the Illumina TruSeq strand specific mRNA sample preparation system (Illumina). Briefly,
Strand specific libraries were constructed by first-strand cDNA synthesis using random primers,
sample cleanup and second-strand synthesis using DNA Polymerase I and RNase H. A single 'A'
base was added to the cDNA fragments followed by ligation of the adapters. Final cDNA library
was achieved by further purification and enrichment with PC. The quality of the cDNA library
was checked using the Agilent 4200 TapeStation. The libraries were sequenced (Single end
100bp reads) using the Illumina HiSeq4000. Ten samples per lane were run, with final counts
reaching over 20 million reads per sample.
Data QC and Analysis
The fastQC program was used to verify the quality of the raw Illumina reads. The GRCm38
(mm10) mouse reference genome and Ensembl gene annotations (v82) were used for read
mapping. The raw sequence reads were mapped to the reference genome using Subjunc aligner
from Subread (25), with majority of the reads (over 90% for all samples) aligned to the genome.
The output from Subread is a BAM file (.bam). This is the binary version of a SAM file (.sam),
which, in turn, is a tab-delimited text file that contains sequence alignment data. The alignment
BAM files were compared against the gene annotation general feature format (GFF) files. GFF
files (.gff) are formatted to describe multiple features of DNA, RNA and protein sequences.
Following comparison, the raw counts for each gene were generated using the featureCounts
tool from Subread, with over 90% of reads overall assigned to genes. The raw counts data were
normalized using the voom method from the R Limma package (26). Based on the differential
Internal RNA-Seq Workflow
This workflow closely follows the pipeline outlined in Pertea et. al. (27) with modifications. The
HISAT2 aligner software was used to map the raw data from the Illumina reads that was
provided by ProteinCT to the GRCm38 genome (with annotations for single-nucleotide
polymorphisms (snps) and transcripts) (28). This aligner also provided a high rate of alignment,
ranging from 85.16% - 95.16%. SAMtools (29, 30) was then used to convert the SAM output
files from HISAT2 into BAM files. These converted files were subsequently compared to the
Ensembl gene annotations (v90) GTF file using Stringtie (31). These gene assignments were also
well above 90%. The Stringtie output (estimated counts) were then converted to raw counts to
use as input for differential expression analysis using R Bioconductor packages.
Differential Expression and Biological Pathway Analysis
This section of the workflow closely follows that described in Law et. al. (32) with modifications.
The raw read counts were normalized using the edgeR package and the voom method in R
Limma package (26, 33, 34). Subsequently, the differential expression of genes was analyzed.
Enrichment analysis, including gene set testing and specific pathway enrichment, was
completed using the camera and kegga methods respectively from the R Limma package.
Visuals for pathway enrichment and gene expression were created using the R Pathview
Results
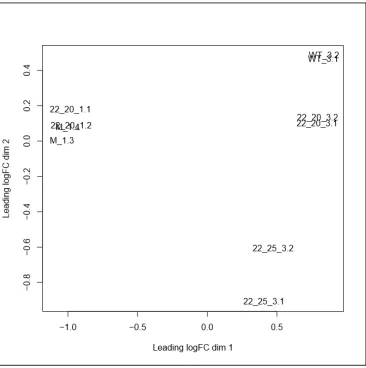
Multidimensional Scaling
Multidimensional scaling (MDS) of the transcriptome data was performed to determine sample
relationship similarity (Figure 6). The MDS plot suggests that the technical replicates cluster
closely together, indicating that this experiment should yield reliable results. This plot further
[image:25.612.123.489.272.640.2]indicates that gene expression in mock (1 hpi) and 22-20 (1 hpi) are similar, indicating that
there is not much change in host cell gene expression within the first hour of infection.
Likewise, of the 3 hpi samples, wt and 22-20 are more “related” to each other and 22-25 is the
most different.Overall, samples from different groups are well separated.Consequently, each
biological group (virus strain) clustered closely together and each condition (time), separate
from each other (Figure 6).
Heatmap Analysis
Variable analysis of the top 100 DEGs confirmed the trends in clustering of samples observed in
the multidimensional scaling (Figure 6). The analysis of the “top 100 DEG” illustrates the
differences in host gene expression between the infections at 3 hpi versus the mock infected
cells and even the infections at 1 hpi (Figure 7). Furthermore, a large number of genes in this
subset are down regulated in response to viral infection by the group at 3 hpi than those at 1
hpi.
This clustering of 1hpi and 3hpi genes, can also be seen with 1093 DEGs (Figure 8).
Furthermore, although our analysis and that of Protein CT used different parameters were used
by internal analytics to obtain gene subsets, this study confirms the groupings and patterns of
ProteinCT, even when considering clustering remains similar between a small subset (Figure 7)
and a large one (Figure 8). Biological groups clustered together, with 22-20 (1 hpi) associating
with Mock (1 hpi) and 22-20 (3 hpi) with wt (3 hpi). We also notice that the three infections at 3
hpi are more similar than the earlier infections, as is expected based on the previous results
(Figure 8). When considering the number of genes used in the ProteinCT overall heatmap, we
our analytical pipeline would provide similar results. We summarily found that our internal
analysis confirms this clustering of genes through variable analysis of the “top 1500 DEG”
(Figure 9) which were obtained using parameters similar to the “top 100 DEG” (Figure 7).
Venn Diagram Comparison
Further analysis finds that 12.99 %, of the overall number of genes (15,556), are similar
between the following three comparisons: 22-20 (3hpi) versus Mock; 22-25 (3hpi) versus Mock,
wt (3hpi) versus Mock (Figure 10). There are, however, far more genes that are differentially
expressed that are in common between the wt and 22-20 viruses than between wt and 22-25
viruses (869 versus 87, respectively). This demonstrates the association between 22-20 and wt
and may explain their clustering in both MDS and heatmap analyses (Figures 6-9). 22-20
maintains 508 differentially expressed genes in common with 22-25, independent of those in
common with wt. 19 genes were found to be differentially expressed between 22-20 and wt (7
up regulated, 12 down regulated, adjusted p- value < 0.05) (Figure 11). Of the 2528 genes in
common between 22-25 and 22-20, 137 total genes were found differentially expressed (71
upregulated, 66 downregulated, adjusted p-value < 0.05) (Figure 12). Here, we notice that
distinct groups of genes seem to be up or downregulated between 22-25 and 22-20 just as can
be seen between 22-20 and wt. It was also discovered that within the 22-25 versus 22-20
comparison, both hallmark gene sets for interferon alpha and gamma response were down
regulated (Table 2). This suggests that 22-25 downregulates both IFN Type I and IFN Type II
pathways, when compared to the effects of 22-20. Furthermore, it is evident that far more
genes in this gene set were downregulated by 22-25 than by 22-20 (Figure 13). Of the genes
expressed (adjusted p-value < 0.05) (Table 3). All 5 of these genes had a negative log fold
change (logFC) indicating downregulation.
KEGG and Gene Ontology Analysis
KEGG pathway analysis reveals that several important pathways, including NF-κB, RIG-I,
Autophagy and Apoptosis, include differentially expressed genes (Figures 14 – 21). 21 genes in
the NF-κB pathway were found to be differentially expressed (FDR < 0.05) by 22-20 (3hpi)
versus Mock (1hpi) with 8 upregulated and 13 downregulated (Table 4). This follows a trend
which indicates an overall down regulation of the pathway (Figure 14). The differences in the
induced gene expression for this pathway between 22-25 and 22-20 appear to consist of further
down regulation. Interestingly, there were no significant variations (adjusted p-value < 0.05)
found between 22-25 (3hpi) and 22-20 (3hpi) for the NF-κB pathway.
In the RIG-I pathway, 10 genes were found to be differentially expressed (adjusted p-value <
0.05) in 22-20 (3hpi) versus Mock (1hpi) with 4 upregulated and 6 downregulated genes (Table
5). Again, there appears to be larger amount of down regulation of genes than up regulation
regarding 22-25 versus 22-20 (Figure 17). In this instance, one gene, Cxcl10/IP10, was found to
be significantly downregulated between 22-25 (3hpi) and 22-20 (3hpi).
We also found 36 DEG in the Apoptosis pathway (adjusted p-value < 0.05) in response to 22-20
(3hpi) versus Mock (1hpi) with 12 upregulated and 24 downregulated (Table 6). By comparison,
3 DEG were found in response to 22-25 (3hpi) versus 22-20 (3hpi), all of which exhibited
upregulation. Two of these genes, Mcl1 and Atf4, were found to be significantly expressed by
Figure 7. Variable comparison of the Top 100 genes that are differentially expressed in VSV-infected L929 cells (RIT Internal Analysis). A subset of the top 100 DEGs were selected (based on an adjusted p-value <0.05) from the comparison between 22-20 (3 hpi) and Mock. The genes were sorted based on adjusted p-value, smallest to largest. The expression values for these same genes were analyzed across all samples and normalized to standard deviation units (z-score) by row (genes). Red:
increased expression, blue: decreased expression. The dendrogram at the top of the heatmap displays the hierarchical clustering of the virus sample replicates. The dendrogram to the left of the heatmap displays the hierarchical clustering of genes, with
X22.20.11 X22.20.12
M.14 M.13
X22.25.32 X22.25.31 X22.20.32 X22.20.31
WT .32 WT .31 Fos Nr4a1 Egr2 Pnrc1 Klhl24 Gm45774 Nuak2 Apln Cx3cl1 Rnd1 Tmco4 Slc39a10 Dnajb9 Tob1 Klf4 Kcne4 Hes1 Gm42793 Klf11 Mnt Csrnp1 Pde4b Lpin1 Gm14137 Klf9 Lmcd1 Pim1 Btg2 Dusp2 Fosb Sik1 Ier2 Gdf15 Tmem263 Spry2 Trib1 Phlda1 Dnajb1 E2f8 Ier3 Dusp1 Per1 Plk3 Zfp36l1 Klf16 Nfil3 Akap12 Mafk Cbx4 Dlx3 Ppp1r15a Hilpda Csf1 Mast4 Bcar3 Mtmr10 Tns3 Il4ra Ltbp1 Lgr6 Il18rap Ajuba Fgd3 Nol8 Eml1 St3gal1 Ripk2 Trib2 Socs5 Errfi1 Ubc Cyr61 Irs1 Amotl2 Myo10 Mical2 Slco2a1 Fam129b Rai14 Junb Lif Egr1 Arc Id3 Jun Sgk1 Id1 Bhlhe40 Tns2 AC164623.1 Zcchc24 Midn Irs2 H1f0 Ubb Klf10 Vegfa Pdk4 Cxcl1 Fosl2
−1 0 1
Row Z−Score
M_1.3
S22_20_1.2
M_1.4
S22_20_1.1 S22_20_3.1 S22_20_3.2
WT_3.1 WT_3.2
S22_25_3.1 S22_25_3.2
−2 −1 0 1 2
[image:30.612.74.525.72.532.2]Value Color Key
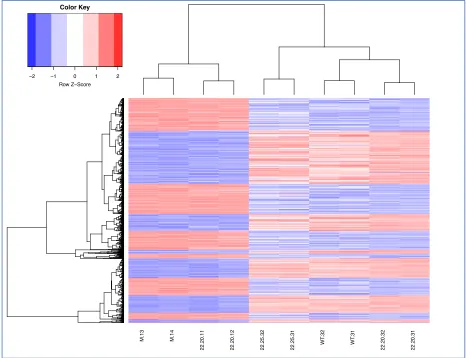
Figure 8. Variable comparison of the “overall top genes” that are differentially expressed in VSV-infected L929 cells (ProteinCT). The genes were selected based on the following parameters: a standard deviation (SD) of expression values larger than 30% of the mean expression values (Mean) and had a mean log counts-per-million (logCPM) > 1. These parameters were chosen to define the most significantly expressed genes within the experiment. 1093 genes met these criteria and were plotted against all samples. Red: increased expression, blue: decreased
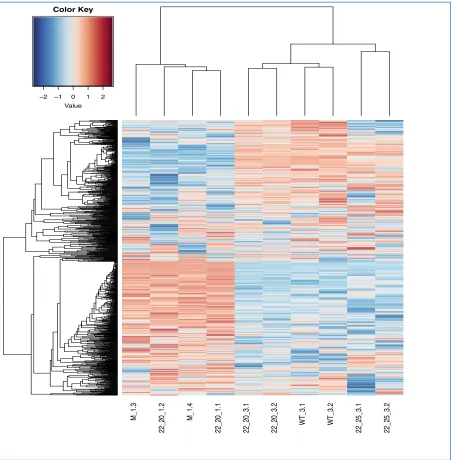
Figure 9. Variable comparison of the top 1500 genes that are differentially expressed in VSV-infected L929 cells (RIT Internal Analysis). DEGs were selected based on an adjusted p-value < 0.05. The genes were sorted based on adjusted p-value, smallest to largest. A subset of the top 1500 genes were selected from the comparison between 22-20 (3 hpi) and Mock. The expression values
for these same genes were analyzed across all samples and normalized to standard deviationunits
(z-score) by row (genes). Red: increased expression, blue: decreased expression. The dendrogram at the top of the heatmap displays the hierarchical clustering of the virus sample replicates. The dendrogram to the left of the heatmap displays the hierarchical clustering of these genes.
M.13 M.14
X22.20.11 X22.20.12 X22.25.32 X22.25.31
WT
.32
WT
.31
X22.20.32 X22.20.31
−2 −1 0 1 2
Row Z−Score
Figure 10. Venn Diagram of Viral-Modulated Gene Expression. The mRNA differential expressions of wt or mutant M viruses relative to mock-infected cells are depicted in three overlapping circles. DEGs were selected based on a cutoff adjusted p-value < 0.05 which includes both up and downregulated genes. The numbers indicate the mRNA counts in the indicated area. The number of genes not found significant is 10289 (lower right-hand corner).
22
−
20
22
−
25
wt
10289
709
557
87
517
869
508
WT .31 WT .32 X22.20.32 X22.20.31 Gm6473 AC149222.1
H2−T−ps
Gm9725 Pars2 Cx3cl1 Gm38056 Tmem70 Usp45 Smim20 Adam22 Pop5 Grhl1 Krr1 Kdm2a Ppp1r18 Nfkbiz Tsc22d2 Raver1
−1 −0.5 0 0.5 1 Row Z−Score
[image:33.612.73.542.71.422.2]Color Key
Figure 11: Variable comparison of DEGs between 22-20 (3 hpi) and wt (3 hpi) infected L929 cells. DEGs were selected based on an adjusted p-value < 0.05. Those genes that passed this cutoff, were selected from each sample within the group comparison of 22-20 (3 hpi) and wt (3 hpi). The
Figure 12. DEGs between 22-25 and 22-20. DEGs were selected based on an adjusted p-value < 0.05. Those genes that passed this cutoff, were selected from each sample within the group comparison of 22-25 (3 hpi) and 22-20 (3 hpi). The expression values for these same genes were analyzed across all samples and normalized to standard deviation units (z-score) by row (genes). Red: increased expression, blue: decreased expression. The dendrogram at the top of the heatmap displays the hierarchical clustering of the virus sample replicates. The dendrogram to the left of the heatmap displays the hierarchical clustering of genes, with gene names shown along the right side of the
X22.25.32 X22.25.31 X22.20.31 X22.20.32
Wnt16 Aph1c Cdo1 Gbp2 Gm6473 Gm28177 Gbp3 Rsad2 Fhdc1 Gm37120 Mss51 Ifit3 Cxcl10 Ifit1 Oasl1 Gm42549 Apol9a Zfp941 Mroh2a Zfp85 Pde4b Adam22 Pars2 2810408I11Rik Btg2 Smim20 Gm43031 Irf9 A430033K04Rik Zfp97 Abi3 Zfp960 Fam199x Nr6a1 Zfp472 Zfp11 Zfp87 Vkorc1 Gm16973 Zfp51 Cx3cl1 G0s2 Apex2 Pop5 Cyb561d1 Mterf4 Tmppe Eri2 Tmem186 Bbs12 Ier3 Tmem70 Usp45 Gm17300 Spsb1 Jrk Dnajb9 Utp23 Zfp84 Rictor Zfp623 Zfp719 Zfp407 Zfp748 Bcl6 Zfp202 Rbak Nrip1 D3Ertd254e Rbm15 Zbtb39 Gan Crebzf Tmem263 Zbed3 Dctn5 Marveld1 Sec61a2 Stbd1 Leng8 Nlk Brms1l Irf2bp1 Trappc5 Slc35c1 Siah2 Xrcc2 Tnpo1 Errfi1 Cldn12 Mcl1 Atf4 Itpripl2 Nufip2 Aff4 Arrdc3 Nfkbiz Arl2bp 2610005L07Rik Hivep1 Gm21811 Zkscan1 Zfp334 Socs3 Zbtb1 Akap13 Foxc2 Mrpl50 Inafm2 Podnl1 Emc6 Blcap Cstf2t Mob1a Pcf11 6820431F20Rik Nek6 Hsd17b12 AC164623.1 Btg1 Arglu1 B230219D22Rik Atxn7l3b Tsc22d2 Plpp2 Raver1 Rin1 Fem1a Kras AC160637.1 Gm10651 Chsy1 Klhl21 Ythdf1 Arf6 1700020I14Rik Mogs
−1 −0.5 0 0.5 1
Row Z−Score
.
Table 2: 22-25 (3 hpi) versus 22-20 (Gene Set Testing). DEGs within the comparison of 22-25 (3 hpi) and 22-20 (3 hpi) were matched to hallmark gene sets found in the Molecular Signatures Database (MSigDB). Hallmark gene sets with a false discovery rate (FDR) < 0.05 were selected via camera method in Limma. Gene Set: Name of gene set from MSigDB; NGenes: Number of genes in the set; Direction: Direction of differential expression (e.g. “Up” or “Down”); Pvalue: raw p-value; FDR: Benjamini-Hochberg FDR adjusted p-value
Gene Set NGenes Direction PValue FDR
HALLMARK_INTERFERON_ALPHA_RESPONSE 127 Down 2.60E-07 1.30E-05
HALLMARK_INTERFERON_GAMMA_RESPONSE 217 Down 4.34E-05 0.001
Table 3: Hallmark IFN Alpha Genes 22-25 (3 hpi) versus 22-20 (3 hpi). Genes that contributed to the Hallmark Interferon Alpha Response Gene Set with an adjusted p-value < 0.05. The group comparison is solely 22-25 versus 22-20. ENSEMBL: Ensembl name for gene; SYMBOL: HUGO Gene Nomenclature Committee (HGNC) approved gene symbol; logFC: log fold change; AveExpr: Average expression of the gene across all samples; P.Value: raw p-value; adj.P.Val: Benjamini-Hochberg correction statistic for multiple tests.
ENSEMBL SYMBOL logFC AveExpr P.Value adj.P.Val
ENSMUSG00000034855 Cxcl10 -4.03 0.91 1.36E-05 0.012
ENSMUSG00000002325 Irf9 -0.72 3.44 4.94E-05 0.022
ENSMUSG00000074896 Ifit3 -3.10 0.57 7.10E-05 0.022
ENSMUSG00000028270 Gbp2 -5.27 -1.82 2.02E-04 0.038
[image:35.792.76.741.332.468.2]Figure 13. Hallmark Interferon Alpha Response Gene Set. Genes that contributed to the enrichment of this gene set were matched to those the group comparison of 22-25 (3 hpi) and 22-20 (3 hpi). The expression values for these same genes were analyzed across all samples and normalized to standard deviation units (z-score) by row (genes). No adjusted p-value cutoff was used to ensure a more comprehensive model. Gene names are shown along the right side of the heatmap. Red: increased expression, blue: decreased expression. The dendrogram at the top of the heatmap displays the hierarchical clustering of the virus sample replicates. The dendrogram to the left of the heatmap
X22.25.31 X22.25.32 X22.20.31 X22.20.32
Cxcl11 Gbp2 Trim14 Ccrl2 Rsad2 Ifih1 Ifit3 Cxcl10 Batf2 Il15 Usp18 Ifi44 Isg15 Sp110 Rtp4 Gmpr Irf7 Ifitm1 Tmem140 Epsti1 Il7 Parp14 Trim21 Dhx58 Uba7 Herc6 B2m Csf1 Psmb9 Parp12 Nmi Cnp Parp9 Ifi35 Ncoa7 Irf1 Ube2l6 Ifit2 Bst2 Irf9 Samd9l Trafd1 Rnf31 Procr Isg20 Lpar6 Stat2 Mov10 Trim26 Ifi27 Tap1 Psme1 Psmb8 Casp1 Elf1 Plscr1 Slc25a28 Casp8 Irf2 Psme2 Wars Eif2ak2 Nub1 Pnpt1 Ogfr Adar Cd74 Lgals3bp Lap3 Psma3 Trim25 Txnip Cd47 Tdrd7 Ifitm3 Ifitm2 Ly6e Ripk2
−1 −0.5 0 0.5 1
Row Z−Score
Table 4: NF-κB Signaling Pathway - DEGs: 22-20 (3 hpi) versus Mock. Genes involved in the NF-κB Signaling Pathway with an adjusted p-value < 0.05. The group comparison is solely 22-20 (3 hpi) versus Mock. ENSEMBL: Ensembl name for gene; SYMBOL: HGNC approved gene symbol; logFC: log fold change; AveExpr: Average expression of the gene across all samples; P.Value: raw p-value; adj.P.Val: Benjamini-Hochberg correction statistic for multiple tests.
ENSEMBL SYMBOL logFC AveExpr P.Value adj.P.Val
ENSMUSG00000061132 Blnk -1.44 -0.48 5.35E-03 2.73E-02
ENSMUSG00000024401 Tnf -1.19 1.87 2.38E-05 7.10E-04
ENSMUSG00000021277 Traf3 -0.80 5.65 5.66E-03 2.84E-02
ENSMUSG00000057329 Bcl2 -0.79 4.78 5.88E-05 1.30E-03
ENSMUSG00000028191 Bcl10 -0.71 5.24 2.01E-06 1.56E-04
ENSMUSG00000032487 Ptgs2 -0.71 6.33 3.83E-05 9.60E-04
ENSMUSG00000026875 Traf1 -0.63 3.93 1.84E-03 1.29E-02
ENSMUSG00000047123 Ticam1 -0.52 4.21 4.44E-04 4.80E-03
ENSMUSG00000030341 Tnfrsf1a -0.47 6.53 2.85E-05 7.99E-04
ENSMUSG00000024927 Rela -0.42 6.36 1.02E-03 8.51E-03
ENSMUSG00000035476 Tab3 -0.29 4.87 6.99E-03 3.31E-02
ENSMUSG00000027164 Traf6 -0.28 5.76 6.05E-03 2.99E-02
ENSMUSG00000042228 Lyn -0.27 5.00 1.07E-02 4.43E-02
ENSMUSG00000028163 Nfkb1 0.30 7.33 1.44E-03 1.09E-02
ENSMUSG00000017652 Cd40 0.43 5.03 3.15E-04 3.86E-03
ENSMUSG00000022414 Tab1 0.43 5.34 1.15E-03 9.27E-03
ENSMUSG00000020941 Map3k14 0.54 4.94 7.20E-05 1.46E-03
ENSMUSG00000026072 Il1r1 0.56 6.76 3.57E-03 2.06E-02
ENSMUSG00000015312 Gadd45b 0.59 5.79 3.49E-04 4.11E-03
ENSMUSG00000027962 Vcam1 0.76 6.54 9.08E-07 9.32E-05
Table 5. RIG-I Like Receptor Signaling Pathway DEGs. Genes involved in the RIG-I-Like Signaling Receptor Pathway with an adjusted p-value < 0.05. The first column displays the group comparison within which the genes are expressed. ENSEMBL: Ensembl name for gene; SYMBOL: HGNC approved gene symbol; logFC: log fold change; AveExpr: Average expression of the gene across all samples; P.Value: raw p-value; adj.P.Val: Benjamini-Hochberg correction statistic for multiple tests.
ENSEMBL SYMBOL logFC AveExpr P.Value adj.P.Val
22-20 vs Mock ENSMUSG00000024401 Tnf -1.19 1.87 2.38E-05 7.10E-04
22-20 vs Mock ENSMUSG00000057329 Bcl2 -0.79 4.78 5.88E-05 1.30E-03
22-20 vs Mock ENSMUSG00000028191 Bcl10 -0.71 5.24 2.01E-06 1.56E-04
22-20 vs Mock ENSMUSG00000032487 Ptgs2 -0.71 6.33 3.83E-05 9.60E-04
22-20 vs Mock ENSMUSG00000047123 Ticam1 -0.52 4.21 4.44E-04 4.80E-03
22-20 vs Mock ENSMUSG00000030341 Tnfrsf1a -0.47 6.53 2.85E-05 7.99E-04
22-20 vs Mock ENSMUSG00000017652 Cd40 0.43 5.03 3.15E-04 3.86E-03
22-20 vs Mock ENSMUSG00000020941 Map3k14 0.54 4.94 7.20E-05 1.46E-03
22-20 vs Mock ENSMUSG00000015312 Gadd45b 0.59 5.79 3.49E-04 4.11E-03
22-20 vs Mock ENSMUSG00000027962 Vcam1 0.76 6.54 9.08E-07 9.32E-05
Table 6. Apoptosis. Genes involved in Apoptosis with an adjusted p-value < 0.05. The first column displays the group comparison within which the genes are expressed. Highlighted gene symbols indicate genes that were expressed differently within multiple group comparisons. ENSEMBL: Ensembl name for gene; SYMBOL: HGNC approved gene symbol; logFC: log fold change; AveExpr: Average expression of the gene across all samples; P.Value: raw p-value; adj.P.Val: Benjamini-Hochberg correction statistic for multiple tests.
ENSEMBL SYMBOL logFC AveExpr P.Value adj.P.Val
Table 7. Autophagy. Genes involved in Autophagy with an adjusted p-value < 0.05. The first column displays the group comparison within which the genes are expressed. ENSEMBL: Ensembl name for gene; SYMBOL: HGNC approved gene symbol; logFC: log fold change; AveExpr: Average expression of the gene across all samples; P.Value: raw p-value; adj.P.Val: Benjamini-Hochberg correction statistic for multiple tests.
ENSEMBL SYMBOL logFC AveExpr P.Value adj.P.Val
22-20 vs Mock ENSMUSG00000039936 Pik3cd -2.23 -0.16 2.30E-04 3.16E-03
22-20 vs Mock ENSMUSG00000020108 Ddit4 -1.21 4.77 1.82E-06 1.46E-04
22-20 vs Mock ENSMUSG00000037204 Atg101 -1.16 4.16 2.06E-05 6.48E-04
22-20 vs Mock ENSMUSG00000030269 Mtmr14 -1.05 3.64 1.03E-05 4.43E-04
22-20 vs Mock ENSMUSG00000038894 Irs2 -0.91 7.40 2.27E-07 3.80E-05
22-20 vs Mock ENSMUSG00000057329 Bcl2 -0.79 4.78 5.88E-05 1.30E-03
22-20 vs Mock ENSMUSG00000033124 Atg9a -0.66 5.13 6.67E-04 6.43E-03
22-20 vs Mock ENSMUSG00000041895 Wipi1 -0.64 4.79 6.52E-05 1.38E-03
22-20 vs Mock ENSMUSG00000029512 Ulk1 -0.64 4.32 9.08E-05 1.68E-03
22-20 vs Mock ENSMUSG00000027244 Atg13 -0.64 4.49 1.84E-04 2.69E-03
22-20 vs Mock ENSMUSG00000028550 Atg4c -0.63 2.38 5.63E-03 2.83E-02
22-20 vs Mock ENSMUSG00000031668 Eif2ak3 -0.61 5.16 4.99E-05 1.16E-03
22-20 vs Mock ENSMUSG00000042628 Zfyve1 -0.59 3.54 2.63E-03 1.66E-02
22-20 vs Mock ENSMUSG00000013663 Pten -0.51 7.12 2.76E-05 7.85E-04
22-20 vs Mock ENSMUSG00000028278 Rragd -0.44 3.72 1.92E-03 1.33E-02
22-20 vs Mock ENSMUSG00000078566 Bnip3 -0.39 4.53 8.83E-03 3.88E-02
22-20 vs Mock ENSMUSG00000024959 Bad -0.37 4.61 1.16E-02 4.71E-02
22-20 vs Mock ENSMUSG00000025907 Rb1cc1 -0.36 4.46 3.79E-03 2.15E-02
22-20 vs Mock ENSMUSG00000032470 Mras -0.36 4.10 4.48E-03 2.41E-02
22-20 vs Mock ENSMUSG00000031834 Pik3r2 -0.34 6.81 1.82E-04 2.67E-03
22-20 vs Mock ENSMUSG00000038375 Trp53inp2 -0.32 6.50 1.68E-03 1.21E-02
22-20 vs Mock ENSMUSG00000033628 Pik3c3 -0.31 4.29 7.16E-03 3.37E-02
22-20 vs Mock ENSMUSG00000070934 Rraga -0.29 6.74 6.75E-04 6.49E-03
22-20 vs Mock ENSMUSG00000027164 Traf6 -0.28 5.76 6.05E-03 2.99E-02
22-20 vs Mock ENSMUSG00000063065 Mapk3 -0.24 6.45 1.08E-02 4.47E-02
22-20 vs Mock ENSMUSG00000029578 Wipi2 -0.23 7.74 3.73E-03 2.13E-02
22-20 vs Mock ENSMUSG00000041417 Pik3r1 0.35 6.78 7.31E-04 6.82E-03
22-20 vs Mock ENSMUSG00000004936 Map2k1 0.36 6.09 1.29E-04 2.11E-03
22-20 vs Mock ENSMUSG00000024122 Pdpk1 0.37 6.94 7.94E-04 7.17E-03
22-20 vs Mock ENSMUSG00000024142 Mlst8 0.39 5.22 1.10E-03 9.01E-03
22-20 vs Mock ENSMUSG00000026289 Atg16l1 0.41 5.85 8.11E-04 7.27E-03
22-20 vs Mock ENSMUSG00000040506 Ambra1 0.41 5.32 4.14E-03 2.28E-02
22-20 vs Mock ENSMUSG00000022419 Deptor 0.45 6.11 1.62E-03 1.18E-02
22-20 vs Mock ENSMUSG00000005102 Eif2ak4 0.51 5.54 8.31E-04 7.39E-03
22-20 vs Mock ENSMUSG00000041341 Atg2b 0.51 5.65 2.86E-03 1.76E-02
22-20 vs Mock ENSMUSG00000055980 Irs1 1.63 8.36 6.77E-08 1.65E-05
25-20 vs 22-20 ENSMUSG00000030265 Kras 0.45 6.33 0.0001 0.03
Finally, 37 genes in the Autophagy pathway were found to be differentially expressed (FDR <
0.05) in 22-20 (3hpi) versus Mock (1hpi) with 11 upregulated and 26 downregulated (Table 7).
One gene, Kras, was found to be downregulated in 22-25 (3hpi) versus 22-20 (3hpi). It seems,
therefore, at that the D52G mutation does not have a significant effect on these pathways at
the transcription level, since there are very few significantly different genes between the 22-25
and 22-20 groups. However, these small variations on certain genes may reveal what changes
have occurred in the host due to the D52G mutation in the M protein.
Gene Ontology (GO) analysis demonstrates the effect of the 22-20 and 22-25 viruses on
separate groups of genes. Biological processes involved with host response to virus were
upregulated in 22-20 when compared to Mock, and there appears to be no further upregulation
by 22-25 for the same groups when compared to 22-20 (Figure 22). This is to be expected, as
the host cell would begin to defend itself in the initial stages of infection. However, 22-25 is has
response (Figure 23). This indicates that while earlier analysis showed there were few genes of
significant difference within certain pathways, overall immune response to 22-25 is reduced in
comparison to 22-20. Furthermore, though 22-25 continues to down regulate other biological
processes in comparison to 22-20, including RNA metabolism and cell death, the overwhelming
[image:50.612.74.538.221.628.2]differences between the two viruses are within the viral response processes.
Figure 22. Biological Process: Up Regulated Genes. These biological processes from the Gene Ontology (GO) were found to be enriched through Gene Set Enrichment Analysis (GSEA). a) 22-20-3 versus Mock (3 hpi), Processes: response to virus, defense response to virus, defense response to other organisms, defense response, immune effector process, response to other organism, response to external biotic stimulus, response to biotic stimulus, regulation of immune effector process, regulation of defense response; b) 22-25 (3 hpi) versus 22-20 (3 hpi), Processes: T-helper 1 cell activation, granuloma formation, chronic inflammatory response, chronic inflammatory response, epithelial cell
proliferation involved in liver morphogenesis, hepatocyte proliferation, liver morphogenesis, liver regeneration, positive regulation of transcription from RNA polymerase II promoter in response to endoplasmic reticulum stress, mammary gland epithelial cell differentiation, mammary gland epithelial cell proliferation.
a)
Figure 23. Biological Process: Down Regulated Genes. These biological processes from the Gene Ontology (GO) were found to be enriched through Gene Set Enrichment Analysis (GSEA). a) 22-20-3 versus Mock (3 hpi), Processes: regulation of transcription from RNA polymerase II promoter, positive regulation of biological process, positive regulation of cellular process, positive regulation of RNA metabolic process, positive regulation of metabolic process, negative regulation of cellular process, regulation of cell death, positive regulation of nucleobase-containing compound metabolic process, positive regulation of macromolecule metabolic process, negative regulation of biological process; b) 22-25 (3 hpi) versus 22-20 (3 hpi), Processes: response to virus, defense response to virus, defense response to other organism, response to other organism, response to external biotic stimulus,
response to biotic stimulus, innate immune response , defense response, immune response , immune effector process.
a)
Discussion
Until recently, it was believed that the 22-20 and 22-25 M protein gene sequences were
identical (14), however we identified a D52G mutation in the M protein of 22-20 (unpublished),
which abrogates its ability to inhibit NF-κB. We also found that little to no IFN mRNA or protein
in 22-20 infected L929 cells, which we propose was due to M-mediated inhibition of host
transcription. With this in mind the goals of this study were the following: (1) find NF-κB
response genes that are differentially expressed between 22-25 and 22-20, (2) determine host
pathways that are affected by the M protein, and (3) identify host genes that may be involved
in M-mediated inhibition of host transcription and/or regulation of the IFN response.
First, the results of the MDS plot indicate that our VSV mutants elicit unique host gene
responses, while still conveying important clustering results. That fact that mock and 22-20
(1hpi) cluster together, illustrates that one hour is not a sufficient time lapse to see meaningful
changes in host transcription. Conversely, the correlation between wt (3hpi) and 22-20 (3hpi),
indicates that the host response to these mutants is similar. Overall, it can be determined that
our samples should provide us with reliable data.
The clustering of different samples and biological groups (Figure 6) was confirmed through
hierarchical clustering and heatmap analysis of genes which suggests that 22-20 and wt have a
similar impact on overall host gene expression, even though they are discordant for NF-κB
activation (12). We expected that wt and 22-25 would cluster since their M proteins do not
transcription (Table 1). It is possible that wt clusters closely to the 22-20 mutant because wt is a
“lab strain” virus and therefore, wt may be attenuated in comparison to 22-25.
We also determined that there were no DEGs between 22-25 and 22-20 for the NF-κB pathway,
suggesting that these viruses do no target molecules in this pathway at the transcriptional level.
Therefore, we hypothesize that these viruses regulate the function of one of the proteins in this
pathway by altering its translation, stability, or PTM such as phosphorylation or ubiquitination.
In fact, a recent study found that VSV encoding the M(M51R) mutation did exert distinct
changes at the proteome and phosphoproteome levels compared to mock-infected cells (36). In
contrast, we see only a few genes that are significantly differentially expressed between 22-25
and 22-20 at 3hpi on the transcriptomic level. This may be due to the fact that 22-20 and 22-25
both inhibit overall host transcription, rendering most differences in gene expression
insignificant. The evasion of the innate immune response via PTM would not be unique to VSV.
Many viruses, including Influenza A, Hepatitis B, and Ebola, have developed mechanism by
which they circumvent the immune response (37). Therefore, we believe viruses such as R1 and
22-20 may activate positive regulators of the NF-kB pathway by effecting the proteome or PTM
of key components, resulting in NF-kB activation. These viruses may also inactivate negative
regulators of the pathway. In contrast viruses that are able to block NF-kB (wt, 22-25) may
inactivate positive regulators, or activate negative regulators of this pathway at the protein or
PTM level.
The patterns of minimal differences between 22-20 and 22-25, at the transcriptomic level,
extended to other important pathways including the RIG-I and autophagy pathways. We found
downregulated) in genes that are differentially expressed by 22-20. Again, we notice that there
is minimal significance at the transcriptional level. However, these significant genes might
provide insight into the effect of the M protein on apoptosis. Previous studies have shown that
the M protein induces cell rounding, a hallmark of apoptosis and it has been shown that the M
protein has an effect on programmed cell death (38). VSV containing an M protein mutant,
rM51R-M, illustrated how changes to the M protein affects the pathways through which VSV
induces apoptosis (39). The wt virus primarily activated apoptosis through the mitochondrial
(intrinsic) pathway via caspase 9 (Casp9), while rM51R-M, primarily activated apoptosis through
the death receptor (extrinsic) pathway via caspase 8 (Casp8). It was also observed that
rM51R-M induced apoptosis much more rapidly than the wt virus (39). Further research determined
the effects of VSV wt on other specific genes within the apoptosis pathway including Mcl1 and
Bid (40).
Mcl1 is an antiapoptotic protein within the Bcl2 protein family, which includes both pro and
antiapoptotic proteins (40). Mcl1 has a high turnover rate (~1hr) and it was discovered that the
wt virus, through its inhibition of host transcription, caused a rapid depletion of the remaining
Mcl1 proteins (40). We found that host expression of Mcl1 was more downregulated by 22-20
than by 22-25. This could potentially mean that 22-20 is more effective at overall host gene
inhibition than 22-25. However, this is one of the few differences between 22-20 and 22-25
DEGS, so further study is necessary. We also found that Bid, Bcl2 and Casp9 were all
downregulated by 22-20 and 22-25. Bid is a proapoptotic member of the Bcl2 family, which is
known to instigate cross talk between the extrinsic and intrinsic pathways through activation by
or 22-25 while the downregulation Bid is likely also due to the inhibition of overall host
transcription. The downregulation of Bcl2, found on the mitochondria, might indicate that
22-20 and 22-25 are activating the intrinsic pathway. This would be interesting since rM51R-M
primarily activates apoptosis via the extrinsic pathway. Proteomic research could help to
determine which pathway is being regulated by 22-20 and 22-25.
We also found that 87 of the same genes are differentially expressed in 22-25 and wt viruses
(Figure 12). Since it was discovered that host transcription, in response to 22-25 and wt, do not
cluster closely at 3hpi (Figure 6), this group of genes could potentially reveal genes that are
important for VSV infection. Two interesting genes, Ifit3 and Rsad2, were both found to be
significantly downregulated by 22-25 in comparison to the 22-20 response. The Ifit gene family
consists of antiviral factors that are important to the IFN response pathway (41). Ifit3 has been
shown to positively regulate the functions of Ifit1, a foreign RNA binding protein. By forming a
multiprotein complex with Ifit1, Ifit3 enables are more effective immune response (42). Thus,
the downregulation of Ifit3 would negatively affect the ability of Ifit1 to bind to VSV
transcription products, which would then hinder the host ability to fight infection. Rsad2, also
known as Viperin, is an ISG, which is activated by Type I and II IFN. Many viruses stimulate this
protein following their detection by RLRs, however, it has been found that VSV elicits a
response by independent means (43, 44). VSV activates IRF1/3 directly, which then stimulates
Viperin, effectively circumventing the RLR mediated response (44). Unfortunately, due to the
broad activity of Viperin to many viruses, it has been difficult to determine its function in
response to VSV. Viperin activities, including metabolism and signaling mediation, tend to be
Influenza budding, there is no known involvement with VSV replication (44). It is therefore
possible that the reduced expression of Viperin (and Ifit3) could be due to other factors
including overall host transcription inhibition, or the fact that 22-25 has a greater impact on
immune response pathways (Figure 23b), or more specifically or 22-20 may be regulating IRF-3
differently than 22-25.
Finally, our GO analysis (Figures 22-23) indicated that when compared to mock, 22-20
downregulated biological processes associated with normal cell function and transcript
regulation (Figure 23a). Since we do not see the same gene sets named for 22-25 compared to
22-20 (Figure 23b), we can safely assume that 22-25 is affecting normal function and transcript
regulation in a similar manner to 22-20. This suggests that both 22-20 and 22-25 downregulate
overall host transcription. As expected, we found that many gene sets associated with infection
and the immune response were upregulated by 22-20 (Figure 22a). Host response to 22-25
displays downregulation of biological processes (Figure 23b) that are associated with infection
and immune response. It is also worth noting that we did not find any biological processes that
were further upregulated by 22-25 in comparison to 22-20 (Figure 22b). These results indicate
that 22-25 is more effective at abrogating the immune response, and the two viruses act
similarly in terms of down regulating overall transcription. These findings support the heatmaps
clustering (Figures 7-9), which indicates the virus samples at 3 hpi downregulate host genes in
Future Work
There are several interesting projects that we believe could stem from this research. For
example, we found that there were 19 DEGs between 22-20 and wt. Further analysis of the
pathways affected by these genes and their significance could provide us with insight into the
usefulness of 22-20 as an oncolytic agent. As such, since apoptosis activity is an important
factor in oncolytics, we could investigate the regulation of apoptosis in 22-20-infected cells.
Focusing on specific DEGs that we discovered, we might also investigate the role of
Rsad2/Viperin in VSV infection as well as determine whether Ifit3 regulation is affecting Ifit1
activity. We could also perform RNA-Seq analysis on the host transcriptome in response to R1
and compare this response to that of 22-20. This would help to solidify our understanding of
the M51R and D52G mutations and their effect on M protein function.
Conclusion
Clinical applications of VSV would benefit tremendously from an improved understanding of
VSV-host interactions; therefore, we investigated the effect of VSV on host gene expression.
Our findings show that the VSV M protein effects key biological pathways such as RIG-I/NF-κB,
IFN-alpha and apoptosis. GO analysis also illustrates how 22-20 and 22-25 affect normal
function and transcript regulation similarly, supporting the conclusion that 22-20 and 22-25
both downregulate overall host response. Since 22-20 downregulates host transcription and
suppresses the IFN response, it could potentially be an oncolytic viral candidate. There is still, of
course, a need to investigate the effect of these viruses on the host at the proteomic level since