A Community Merger of Optimization
Algorithm to Extract Overlapping
Communities in Networks
QI LI 1, JIANG ZHONG1, QING LI1, CHEN WANG1, AND ZEHONG CAO2, (Member, IEEE)
1College of Computer Science, Chongqing University, Chongqing 400044, China
2Centre for Artificial Intelligence, Faculty of Engineering and IT, University of Technology Sydney, Ultimo, NSW 2007, Australia Corresponding author: Jiang Zhong ([email protected])
This work was supported in part by the National Key Research and Development Program of China under Grant 2017YFB1402400, in part by the Frontier and Application Foundation Research Program of CQ CSTC under Grant cstc2017jcyjAX0340, in part by the Key Industries Common Key Technologies Innovation Projects of CQ CSTC under Grant cstc2017zdcy-zdyxx0047, in part by the Chongqing Technological Innovation and Application Demonstration Project under Grant cstc2018jszx-cyzdX0086, in part by the Social Undertakings and Livelihood Security Science and Technology Innovation Fund of CQ CSTC under Grant cstc2017shmsA0641, in part by the Fundamental Research Funds for the Central Universities under Grant 2018CDYJSY0055, and in part by the Graduate Research and Innovation Foundation of Chongqing under Grant CYB18058.
ABSTRACT A community in networks is a subset of vertices primarily connecting internal components, yet less connecting to the external vertices. The existing algorithms aim to extract communities of the topological features in networks. However, the edges of practical complex networks involving a weight that represents the tightness degree of connection and robustness, which leads a significant influence on the accuracy of community detection. In our study, we propose an overlapping community detection method based on the seed expansion strategy applying to both the unweighted and the weighted networks, called OCSE. First, it redefines the edge weight and the vertex weight depending on the influence of the network topology and the original edge weight, and then selects the seed vertices and updates the edges weight. Comparisons between OCSE approach and existing community detection methods on synthetic and real-world networks, the results of the experiment show that our proposed approach has the significantly better performance in terms of the accuracy.
INDEX TERMS Overlapping community detection, complex network, weighted network, dense subgraph.
I. INTRODUCTION
Many complex systems in the real world, such as social net-work, scientific collaboration network and protein interaction network, can be abstracted into complex networks [1]. With the deepening of research on complex networks, it is found that the nature of community structure is often found in many complex networks, which is characterized by relatively close links within communities and relatively sparse links among different communities [2].
The problem of community detection has been addressed in many different fields such as biology, physics, and mathematics [3]. A large number of community detection algorithms have been developed in recent years. These methods can be generally divided into two categories. The first category is non-overlapping community detec-tion method that partidetec-tion complex network into several independent community structures, where vertices belong
to only one of the communities, including clustering algorithm based on graph partitioning [4], [5], clustering algorithm based on spectral analysis [6], [7], clustering algo-rithm based on hierarchical [8] and density-based cluster-ing algorithm [9], [10]. The second category is overlappcluster-ing community detection method that allow one vertex to belong to multiple communities at the same time [11]–[13]. For example, humans belong to different social communities, depending on their hobbies, professions, families, etc. There have been many different methods to detect overlapping communities. Clique percolation by Pallaet al.[14], neigh-borhood ratio matrix by Eustaceet al.[15], label propaga-tion by Raghavanet al.[16], core-vertex and intimate degree by Wang and Li [17], and subspace decomposition by Eustaceet al.[12] are some of the popular approaches.
Of all the methods,Local ExpansionandOptimization[18] method is well popularity by researchers. In this method,
3994
2169-35362018 IEEE. Translations and content mining are permitted for academic research only.
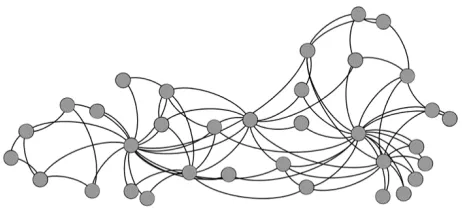
a particular vertex is first selected called seed vertex as a community, which start to expand from the seed vertex. This expansion is achieved by adding neighborhood vertices to the community. At each step, vertices in the neighborhood of the current community are added according to the value of the scoring function. When the vertices in the neighborhood do not improve the value of scoring function, the expansion will be terminated. The performance of the algorithm is determined by the seed selection and expansion strategy [19]. Our proposed method is based onlocal Expansionand Opti-mization. The main reason is that this method is robust and scalable. The seed expansion is completed independently, multiple seeds can be expanded in parallel, thus greatly accelerating the speed of the algorithm. And Local Expan-sionmethod only needs local neighborhood information of vertices and does not need global information of network topology. Therefore, the method shows good performance when the entire network is too large to handle. Figure 1 shows Zachary’s karate club network.
FIGURE 1. Zachary’s karate club network.
A large number of meaningful community detection algo-rithms have been proposed in complex networks, but there still are some challenges that required to be solved. One of the challenges is determination of community boundaries. Some algorithms have their own limitation in terms of applicability and their performance depends on the selection of the seed vertex and expansion strategies. For instance, in some real-world networks where community boundaries are hard to identify, these algorithms fail to identify community bound-aries [20]–[22]. Another challenge is: edges or vertices in the real complex networks often contain some vital prior information. For example, the protein interaction network is obtained by high-throughput experiments, and the edge weight often represents the experimental credibility. The edge weight in the cooperative network usually represents the closeness degrees of cooperation between cooperative objects. EM-BOAD [3] has better performance for commu-nity detection in weighted networks. Commucommu-nity detection using local communities [20] works well when the seed ver-tex is at the center of local community [21].
In order to solve the above-mentioned problems, in our study, we propose an overlapping community detection algo-rithm for complex networks based on the seed expansion strategy (OCSE) applying to both the unweighted and the
weighted networks. The algorithm adopts edge-reweighting method to reset the network edges weight depending on the influence of the network topology as well as the orig-inal edge weight, and promotes the defuzzification of the network community structure. Then the algorithm adopts vertex-reweighting method to reset the network vertices weight depending on the new edges weight. The rule of seed vertex selection makes the seed vertex is more representative. Combined with the degree of membership, we give a reason-able expansion process. The proposed algorithm successfully detects communities on benchmark networks and real-world networks. The main contributions of our study are summa-rized as follows:
(1) We propose an edge-reweighting method. More spe-cific, different from the existing approaches [23], [24], we comprehensively consider the network edge infor-mation and network topology inforinfor-mation to recalculate edges weight, which is to enhance the weight of the community edges further.
(2) Different from the existing seed expansion meth-ods [19], [25], we redefine the weight of vertices in the network according to the new edges weight, select a vertex with the highest weight as community seed ver-tex, and then iterate to obtain weighted dense subgraphs according to the seed expansion strategy and the weight updating method in linear time.
(3) We improve the content of the degree of membership to measure the link closeness between vertices and weighted core communities, and allocate unclustered ver-tices to the weighted core communities to obtain more accurate community detection performance.
(4) Our proposed OSCE approach applies to both unweighted and weighted networks. More specific, we report on the experimental outcomes based both real and artificial network datasets, and the results show clearly that our proposed approach has the higher accuracy compared to existing community detection algorithms.
The rest of this paper is organized as follows; Section II, briefly outlines a list of related works and the motive of our research. Detailed steps of the proposed method are presented in Section III. Section IV, presents the experiment results, and comparison with completing algorithms. Finally, this paper is concluded in Section V.
II. RELATIVE WORK
uses local information of the network and edge-reweighting method to reconstruct the weighted network. Community detection on this weighted network is more accurate than that on the original network. Another prior work [33] proposed an strategy to detect overlapping communities based on the vertex location. In this method, the community belonging of vertices is determined based on the position of vertices in the topological potential field. The random walk network preprocessing approach [31] was based on random walk. In proposed method, the author thinks that two random walks start from two different vertices in the network, if these two walking behaviors have a high degree of similarity, then the probability of the two vertices in the same community is larger, if these two walking behaviors are obviously different, the probability of the two vertices in the same community is lower. Indeed, Edge-reweighting method is simple and efficient, which can improve the accuracy of community detection results. The main reason is that edge-reweighting method is adopted to improve the weight of the inner edges of the community in the network and reduce the weight of the edges between the communities and make the communities more recognizable.
In real networks, the edge feature can be reflected by the edge weight. For instance, in the social network, the edge weight can be represented as the close relationship between individuals. The edge weight in scientific cooperation net-work represents the number of cooperation between scien-tists. In the protein interaction network, the edge weight indicates the credibility of the protein interaction through high-throughput experiments. Due to the importance of edge attributes [34], the edge weight with realistic significance should be considered to detect community. In terms of above reasons, we considered the attributes of the edges and the similarity between the vertices to reweight the edges for community detection. The detailed process is introduced in the following sections.
III. OVERVIEW OF THE PROPOSED METHOD
In this section, we describe the main steps of our approach, as well as illustrate the supports on how OCSE improve the process of finding communities.
A previous study [26] has illustrated that the vertex simi-larity measures can enhance community detection, but how to combine the vertex similarity with the actual edge weight is our first research point. Focusing on these issues, we design a method of recalculation of edges weight, which is taken into consideration the edges information and topological struc-ture of the network. Then the vertices weight is recalculated according to the new edges weight information. The new tices weight is more genuinely reflect the importance of ver-tices in the network. The maximum weight vertex is chosen as the seed vertex. The weighted dense subgraphs are obtained according to the seed expansion strategy and weight update strategy. However, there are number of overlapping vertices in some weighted dense subgraphs, these weighted dense subgraphs with higher overlap rate should be merged into
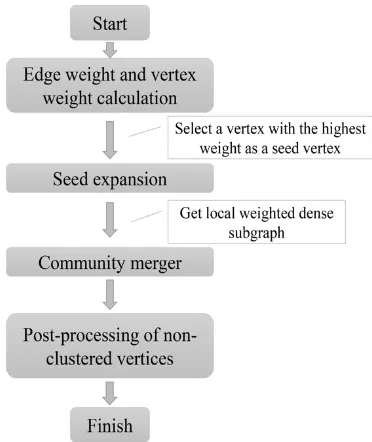
[image:3.576.326.512.221.442.2]a weighted core community. At the current stage, the dense subgraphs have been found out, but there are still some remaining sparse vertices in the network that are not divided. In order for all vertices to have community ownership, we put forward the concept of the degree of membership to mea-sure the link closeness between vertices and weighted core communities, and then allocate the uncluttered vertices to the corresponding weighted core communities according to the degree of membership. The results of community detection are obtained. The flow-graph of the proposed algorithm is shown in Figure 2 based on the seed expansion strategy, called OSCE.
FIGURE 2. The flow-graph of the proposed OCSE algorithm.
A. EDGE-REWEIGHTING
Given a networkG = (V,E), the set of verticesV = {v1,
v2, . . . ,vn}, and n = |V|. Each edge (vi, vj) denotes a
connection relationship between a pair of verticesviandvj. m= |E|., the set ofvneighbors (NG(v)= {u|(u,v)∈E}) is
abbreviated asN(v), and the degree ofvis denoted asDv.
In addition,NG(U) = S x∈U
NG(x) denotes the subgraphU
neighbors inG.
we need to define the weight between vertices first, as shown in Equation (1).
w0(vi,vj)=α×
|N(vi)∩N(vi)|2
min{|N(vi)|,|N(vi)|}2
+β× |N(vi)∩N(vi)| 2
max{|N(vi)|,|N(vi)|}2
+(1−α−β)×u(vi,vj) (1)
Where N(vi)∩N(vj) represents the common neighbors
betweenviandvj. If the edge (vi,vj) exists in the network, u(vi,vj) is equal to the original edge weight. Conversely, if the
edge (vi,vj) does not exist,u(vi,vj) is equal to zero. The first
two items of Equation (1) reflect the similarity degree ofvi
andvjin the network topology. The third item of Equation (1)
reflects the original edge weight. Equation (1) thoroughly integrates the network topology and the real edge informa-tion. However, for the edge weight, only make sense if there is an edge between two vertices. Therefore, we redefined the edge weight according to Equation (1). In summation, the final edge weight w(vi, vj) definition is illustrated in
Equation (2). The constantε ∈[0, 1] is used to distinguish whether there is an edge between vertices in the network.
w(vi,vj)=
ε+1−ε
w0
avg
×w0(vi,vj), (vi,vj)∈E
0, (vi,vj)∈/E
w0avg =
P
(vi,vj)∈E
w0(vi,vj)
|E| (2)
B. SEED VERTICES SELECTION
The seed vertices are usually more important than other ver-tices in the network and lie in comparatively dense areas of the network, which should be lie in the topological centrality of the community. Therefore, the seed vertices should be far apart in the network structure. Based on these principles, the vertex weight is defined as shown in Equation (3).
wd(vi)=
X
vj∈N(vi)
w(vi,vj)×Dj (3)
The vertex weightwd(vi) is positively related to the degree
ofvineighbors and the weight of adjacent edges ofvi, which
reflects the importance ofviin the network. A vertex with the
highest weight is selected as the first seed vertex.
In order to make as many vertices as possible to have their own community in the process of seed expansion. When selecting the seed vertex of the next community, the selection probability of vertices that have been seed vertices should be reduced. Therefore, after finding a dense subgraph Ct,
reducing the weight of the edges inCtcan avoid selecting the
vertices inCt as seed vertex with high probability. The new
edges weight inCt isw(vi,vj)/ √
|Ct|, and (vi,vj) ∈ E(Ct).
If a vertex weight changes too much, it should not be selected as the seed vertex of another dense subgraph. This ensures that the seed vertices are far apart in the network structure. Therefore, we need to define the changing rate of the vertex
weight. The changing rate of the vertex weight is defined as shown in Equation (4).
rate(v)=1−wd
0(v)
wd(v) (4)
[image:4.576.313.522.243.350.2] [image:4.576.51.274.337.425.2]Wherewd(v) represents the weight of the vertexvbefore updating the edge weight. wd0 (v) represents the weight of the vertexvafter updating the edge weight. Ifrate(v)> θ, the vertexvshould not be selected as the seed vertex again. Figure 3 shows that the seed vertices in the karate club network are obtained by OCSE (black vertices). It can be seen that the number of seed vertices are moderate and they have relatively good representation.
FIGURE 3. Seed vertices (33, 9, 4) in Zachary’s karate club network obtained by OCSE.
C. SEED EXPANSION STRATEGY
In order to get a weighted dense subgraph for the current seed vertex. We design an evaluation function to evaluate the dense degree of the subgraph. AssumingSis a connected subgraph ofG,VSrepresents the vertex set ofS, andESrepresents the
edge set ofS. That isns= |VS|andms = |ES|. Addns(n2s−1)− ms edges toS to get a complete graphS0. The newly added
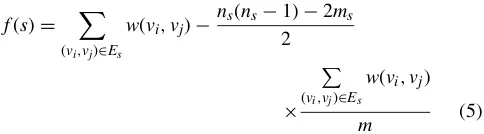
edges weight is set as the average edge weight ofG. The dense degree ofSis evaluated by the difference between the weight of the existing edges inSand the newly added edges weight inS0. Equation (5) is the evaluation function forS. The larger the value off(s), the denser the subgraphS. According to the definition, if there is only one vertex inS,thenf(S)=0.
f(s)= X
(vi,vj)∈Es
w(vi,vj)−
ns(ns−1)−2ms
2
×
P
(vi,vj)∈Es
w(vi,vj)
m (5)
For a vertex v(v ∈/ Vs), we define a fitness function
δS(v)=f(S∪ {v})−f(S). During the seed vertex expansion
process, the vertex with the largest value and δS(v) > 0
[image:4.576.297.539.566.633.2]FIGURE 4. Weighted dense subgraphs in Zachary’s karate club obtained by OCSE.
represent different dense subgraphs (triangle vertices, hexag-onal vertices and quadrilateral vertices).
D. COMMUNITY MERGER
After completing the above steps, OCSE can find many dense subgraphs. However, there may be many overlap ver-tices between some dense subgraphs. These dense subgraphs should be merged. Figure 4 shows that there are half vertices overlapped between the dense subgraph consisting of vertices {9, 31, 33, 34} (hexagonal vertices) and the dense subgraph consisting of vertices {24, 30, 33, 34} (triangular vertices). These two subgraphs should be merged. In this paper, the con-dition for merging of two dense subgraphs is that the number of overlap vertices between two subgraphs is no less than half the number of a smaller dense subgraph. The communities after merging are called weighted core communities. Figure 5 shows that OCSE obtains the weighted core communities in Zachary’s karate club.
E. POST-PROCESSING OF UNCLUSTERED VERTICES
[image:5.576.307.534.166.337.2]The weighted core communities are obtained by OCSE, which includes some local dense subgraphs. However, there are still some unclustered vertices (shown as the round ver-tices in Figure 5). Therefore, we first define the degree of membership to measure the link closeness of unclustered ver-tices and the weighted core communities. Equation (6) shows the degree of membership of the vertex v to the weighted core communityC. The value ofb(v,C) is positively related
FIGURE 5. Weighted core communities in Zachary’s karate club obtained by OCSE.
to the adjacent edges weight ofvand the adjacent vertices weight ofv inC. Select a weighted core community with the maximum value and allocatevto the weighted core com-munity. The algorithm iteratively allocates the unclustered vertices to the existing weighted core communities according to Equation (6) until all the unclustered vertices are allocated. Figure 6 shows the final clustering result obtained by OCSE in Zachary’s karate club.
b(v,C)= X
vx∈N(v)∩VC
w(vx,v)+
X
vx∈N(v)∩VC
wd(vx) (6)
FIGURE 6. Final communities in Zachary’s karate club obtained by OCSE.
F. ALGORITHM COMPLEXITY ANALYSIS
Algorithm 1-3 describe the procedure of OCSE in details.
Step 1-4of Algorithm 1 initializes vertices and edges weight in the network. The average time complexity is proportional to the total number of edges. It takes at mostO(c× |E|).
Step 5-23of Algorithm 1 obtains the weighted dense
com-munities, and all edges in the network are traversed in each iteration. The time complexity of this phase depends on the number of iterations. Assuming that the number of iterations ist, the total time isO(t×E). Algorithm 2 is the merging oper-ation for the weighted dense communities. Assuming there areS (S |V|) weighted core communities, And its time complexity isO(S2). Algorithm 3 is the process of allocating unclustered vertices and the maximum time complexity is
O(|V|). Summarizing the above analysis, the total average time complexity of OCSE isO(c×t × |E| + |V|),candt
are constants.
IV. EXPERIMENTAL
[image:5.576.56.259.596.704.2]Algorithm 1Seed Expansion Process
Input:A networkG=(V,E,U).V andErepresent the set of the vertices and edges respectively.Udenotes the weight matrix ofG
Output:Set of weighted dense subgraphs {C1,C2, . . . ,Ct} 1: Initialize:n= |V|,m= |E|,t=0,F =V
2: ifα>0then
3: C=Ø,β =0.7-α
4: calculate the weight matrix of each edgeWn×n(G) and
the vertices weightwd(v) inF
5: ifF 6=Øthen 6: t =t+1,Ct =Ø
7: select a vertexvwith the highest weight inF
8: F =F-{v},Ct=Ct∪ {v}
9: ifδCt(x)=maxv∈N(Ct)δCt(v) andδCt(x)>0then
10: Ct=Ct∪ {x}, go tostep 9
11: end if
12: if|Ct| ≤3then
13: t=t−1, go tostep 5
14: end if
15: update the vertices weight inCtaccording to formula (6)
16: foreach vertexx∈Ctdo 17: ifcr(x)≤θthen
18: F =F-{x}
19: end if
20: end for
21: go tostep 5 22: end if
23: end if
24: return{C1,C2,. . . ,Ct}
Algorithm 2Community Merger Process
Input:Set of weighted dense subgraphs {C1,C2, . . . ,Ct} Output: Set of weighted core communities {C10,C20, . . . ,Cl0}
1: foreach weighted dense subgraphCi∈ {C1, . . . ,Ct}do 2: if|Ci∩Cj|/min{|Ci|,|Cj|}>0.5 andi6=jthen 3: Ci=Ci∪Cj
4: end if 5: end for
6: return{C10,C20, . . . ,Cl0}
complexity given is for the worst case.α,βandvare constant. The maximum vertex degree in G is Dmax, PS is the size
of population andgenmax is the maximum number of
gen-erations. The hardware environment of the experiment is a PC with a stand-alone Intel Xeon processor with 2.67GHz and 32G memory. The software platform is python 2.7 in Windows. The parameters setting of OCSE applied in both experiments are given in TABLE II, and are determined by a preliminary experiment using a small number of graph instances [41].
Algorithm 3Post-processing of Unclustered Vertices
Input: Set of weighted core communities
{C10,C20, . . . ,Cl0}
Output:result of community detection
1:Initialize:T =V − l
S
i=1
Ci0,ξ(C)=Ø
2:repeat
3: foreach vertexvinT do
3: foreach core community {C10, . . . ,Cl0}do 4: calculateb(v,Cl’)
5: ξ(C)←b(v,Cl’)
6: end for
7: Select the maximum value ofξ(C) and its corresponding community set isCj
8: Cj=Cj∪{v}
9: ξ(C)=Ø
10: end for 11: untilT 6=Ø
[image:6.576.325.511.332.455.2]12: returnresult of community detection
[image:6.576.296.537.493.585.2]TABLE 1.Algorithms included in the experiments.
TABLE 2.Settings of important parameters.
A. EVALUATION METRICS
The detected communities isC = {C1, . . . ,Cs}. The known
communities is O = {O1, . . . ,Ot}. Many methods have
NMI is a useful information measure in information theory. It is introduced by Leon Danon et al. and used to measure the similarity between the detected communities and the known communities. The formula is as follows:
I(A,B)=
−2
CA P
i=1 OB P
j=1
log(NNijN i.N.j)
CA P
i=1
Ni.log(Ni.
N)+ OB P
i=1
N.jlog(NN.j)
(7)
WhereCAis the number of known communities,OBis the
number of detected communities,Ni. represents the sum of
the elements of the ith row in matrixN, andN.jrepresents
the sum of the elements of the jth column in matrix N. NMI is a good evaluation index for the network with known communities. The larger the value of the function, the more similar the detected communities is to the known communi-ties, that is, the higher the quality community detection. When the result of community detection is consistent with the real community, the value of the function is 1.
F1-score measures the correctly classified members in each community based on the ground-truth information.
1 2
1
|C|
X
Ci∈C
F1(Ci,Og(i))+ 1
|O|
X
Oi∈O
F1(Cg0(i),Oi)
(8)
Where the best matching g and g’ is defined as follows:
g(i) =argmax
j
F1(Ci,Oj)
g0(i) =argmax
j
F1(Cj,Oi) (9)
WhereF1(Ci,Oj) is the harmonic mean of Precision and
Recall. It is defined as follows.
F1= 2×precision×recall
precision+recall (10)
The core idea of Q function [45] is that if there are more edges in a subgraph than in random network, some community structures are exist in the subgraph. In order to evaluate the quality of overlapping community detection. Nicosiaet al.[44] proposed Qov function. It is defined as
follows.
Qov =
1
m
X
c∈C
X
i,j∈V
[βl(i,j),cAij−
βout l(i,j),ck
out i β
in l(i,j),ck
in j
m ]
βout l(i,j),c =
P
j∈V
F(αi,c, αj,c)
|V|
βin l(i,j),c =
P
i∈V
F(αi,c, αj,c)
|V| (11)
The value ofQovfunction is closely related toF(αi,c,αj,c).
In Nicosia’ experiment, he adopted the following definition.
F(αi,c, αj,c)=
1
1+e−f(αi,c) 1+e−f(αj,c) (12)
Wheref(αi,c) is a simple linear function.f(x)=2Px−P, P∈R, according to the article [44], we setPequal to 30. If all vertices belong to a community, the value ofQovfunction is
0. Generally speaking, the higher the value ofQov, the higher
the quality of overlapping community structure.
B. TEST ON SYNTHETIC NETWORKS
[image:7.576.302.530.257.395.2]In this section, we use the LFR (Lancichinetti-Fortunato-Radicchi) benchmark [46] proposed by Lancichinetti and Fortunato to produce overlapping artificial networks. The LFR benchmark contains dozens of adjustable parameters. The detailed explanation of each parameter is shown in TABLE III.
TABLE 3.Description of LFR benchmark parameters.
The most significant impact on the LFR benchmark net-works are the mixing parameters µ, the number of over-lapping vertices in the community On, and the number of
overlapping vertices linking communities Om. We mainly
study the performance of different algorithms under these three parameters, and set the average degree of the artificial networks to 10, according to the literature [47], this figure is close to the average degree of most real networks. The maxi-mum degree (mark) is set to 50, and the community size is in the range of [20, 50]. Considering the stochastic factor, we run five times for each algorithm and take the average of these values as the results.
We first test the NMF and F1 value of different algo-rithms when Om increases from 2 to 8. The results are
shown in Figure 6. With the increase of Om, the number
of overlapping vertices linking communities is continuously increasing, which increases the difficulty of detecting over-lapping communities. As seen in Figure 7, we can see that ACC, MCMOEA, Ref. [13] and OCSE show better perfor-mance, which have strong robustness. CPM, NLA, BASH and COPRA are more sensitive to parameterOm, which lead to the
[image:7.576.43.274.572.672.2]results of volatility on the low side.
Figure 8 shows that the NMF and F1 value of different algorithms whenµincreases from 0 to 0.45.µis the mixing parameter which represents each vertex shares a fraction 1−µ
FIGURE 7. NMI (left) and F1-score (right) for networks with differentOm.
FIGURE 8. NMI (left) and F1-score (right) for networks with differentµ.
range ofµto [0, 0.45]. Whenµexceeds 0.5, the generated community structure in the network is difficult to reflect and it is more similar to the random network. Whenµ=0, there is no additional noise in the artificially synthesized network. It can be observed that all the algorithms perform well, and both the NMI and F1 value are close to one. With the increase ofµand the result in the performance degradation of all algo-rithms. But the performance of OSCE slows down, even when
[image:8.576.301.533.257.363.2]µ =0.45, it still maintains higher NMI value and F1 value. The NMI and F1 value of OSCE decrease slowly with the decline of community quality, which shows the effectiveness and robustness of OSCE. In addition, the ACC algorithm also shows better performance.
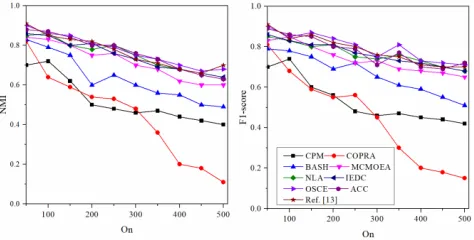
FIGURE 9. NMI (left) and F1-score (right) for networks with differentOn.
Figure 9 shows that the NMF and F1 value of different algorithms whenOnincreases from 50 to 500.Onrepresents
the number of overlapping vertices in the community. All
algorithms efficiency are decreased with the increase of the number of overlapping vertices. However, it can be seen that the performance of OSCE is superior to other algorithms, the worst is COPRA.
Based on the above results, it can be seen that although the proposed method does not perform best on different types of networks, overall, compared with the other eight algorithms, it shows good performance.
C. TEST ON REAL-WORLD NETWORKS
We use the standard networks [41], [48] of research on com-munity detection to analyze the performance of OSCE. These datasets are described in detail in TABLE IV.
TABLE 4.Description of real-world networks.
1) ZACHARY’S KARATE CLUB
The network is a classical dataset in the field of social network analysis. Sociologist Zachary spent two years observing the social relationships among 34 members of a karate club in an American university. Based on the association of these mem-bers in the club and outside, he construct a social network of members, which consists of 34 vertices. If there is an edge between two vertices, which means that the two members are friends who have frequent contacts.
2) COLLEGE FOOTBALL NETWORK
The network consists of 115 vertices with 12 communities. Each vertex represents a college team that participated in the 2000 U.S. football season, and the edge between the two vertices indicates that at least one match was played between the two teams.
3) DOLPHINS SOCIAL NETWORK
D. Lusseau and others studied social relationship between 62 bottlenose dolphins in Doubtful Sound Strait of New Zealand. Each vertex in the network represents a dol-phin. Each edge represents the frequent contact between two dolphins.
4) BLOGS NETWORK
[image:8.576.40.277.548.668.2]5) POLL BOOKS NETWORK
Amazon’s book sales record is related to American politics. Each vertex in the network represents a book sold on Amazon, and the edge represents the two books have been bought at the same time by buyers.
6) EMAIL NETWORK
The mail exchange relationship between the university stu-dents. Each vertex in the network represents an email account, and each edge represents the relationship between the sending and receiving emails.
7) LEMIS NETWORK
The data set is the relationship between the characters that is summarized by Hugo’s Les Miserables. Each vertex rep-resents a character in the novel. If multiple roles appear in a scene at the same time, there will be an edge between them.
8) JAZZ NETWORK
A network of relationships between jazz musicians, the ver-tices in the network are musicians, and the edge represents the relationship of common playing.
9) NEURAL NETWORK
A directed, weighted network representing the neural net-work of nematode.
10) POWER GRID
An unweighted network representing the topology of the western states power grid of the United States.
[image:9.576.303.532.65.225.2]Considering the stochastic factor, we run 5 times for each algorithm and recorded the mean values in our results. The results are shown in Figure 9 – Figure 11.
FIGURE 10. NMI on real-world networks with ground truth.
[image:9.576.299.536.399.563.2]As seen in Figure 10 and Figure 11, The OSCE algorithm performs better than other algorithms on Karate and Football datasets, and the communities obtained are very close to the real situation. The NMI value on Karate is even stable at one. The performance on the blogs dataset is second, and is
FIGURE 11. F1-score on real-world networks with ground truth.
very close to the result of the best performance algorithm (Ref. [13]). For real-world networks without ground truth, we use overlapping modularity (Qov) to evaluate the results of
community detection. As seen in Figure 12, the OSCE model on all five data sets shows the relatively good performance.
[image:9.576.38.277.481.642.2]Overall, OCSE considers the network topology and the original weight information in the community detection pro-cess. It can produce results that are close to the real network, and exhibit better performance.
FIGURE 12. Qovon real-world networks without ground truth.
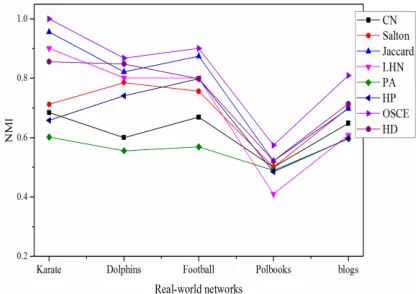
D. SIMILARITY MEASURES
1) Common Neighbor similarity measure (CN) [35]: It is the simplest and classical measure index of local infor-mation. It only considers the number of common neigh-bors between two vertices, and ignores the differences of common neighbors and the relationships between common neighbors. For Common Neighbor similarity measure, the definition of the weight between vertices is as follows.
w0(vi,vj)= |N(vi)∩N(vj)| +u(vi,vj) (13)
2) Salton similarity measure (Salton) [49]: The Salton algorithm adds the information of the degree of two vertices on the basis of the common neighbor similar-ity. It considers that the similarity between vertices is directly proportional to the number of common neigh-bors and inversely proportional to the degree of ver-tices. Therefore, the Salton algorithm is also called the prior similarity algorithm. For Salton similarity mea-sure, the definition of the weight between vertices is as follows.
w0(vi,vj)=
|N(vi)∩N(vj)|
p
Di×Dj
+u(vi,vj) (14)
3) Jaccard similarity measure (Jaccard) [50]: It considers that the similarity between vertices is proportional to the proportion of the number of common neighbors to the total number of all their neighbors. That is to say, compared with the vertices with more neighbors, the vertices with fewer neighbors are more vulnerable to neighbors. For Jaccard similarity measure, the definition of the weight between vertices is as follows.
w0(vi,vj)=
|N(vi)∩N(vj)|
|N(vi)∪N(vj)|
+u(vi,vj) (15)
4) Leicht Holmem Newman similarity measure (LHN) [51]. It is similar to the Salton algorithm. The algorithm is mainly to reduce the influence of vertex degree on similarity. For Leicht Holme Newman sim-ilarity measure, the definition of the weight between vertices is as follows.
w0(vi,vj)=
|N(vi)∩N(vj)|
|Di∪Dj|
+u(vi,vj) (16)
5) Preferential Attachment similarity measure (PA) [35]: The PA algorithm removes the influence of common neighbor vertices. The probability that it defines a link is directly proportional to the degree of the vertex. That is, it considers that the more vertices that the vertex linked, the easier it is to do the link-generating behavior. The network information used by the algorithm is only the degree of the vertex, so it has better efficiency, and more suitable for large-scale network data. For Preferential-Attachment similarity measure, the defini-tion of the weight between vertices is as follows.
w0(vi,vj)=Di×Dj+u(vi,vj) (17)
6) Hub-Promoted similarity measure (HP) [28]: Compared with the Salton algorithm, the numerator of HP function is also the number of common neighbors of two vertices, but its denominator is a smaller degree value of the two vertices degree. This improvement makes the algorithm better applied in the metabolic network. The vertices with lower degree determine the similarity value. For Hub-Promoted similarity measure, the definition of the weight between vertices is as follows.
w0(vi,vj)=
|N(vi)∩N(vj)|
min{Di,Dj}
+u(vi,vj) (18)
7) Hub-Depressed similarity measure (HD) [31] : The HD algorithm is similar to HP, but the denominator of HD function is opposite to HP. It considers that the ver-tex with large degree has a greater influence on the similarity value. For Hub-Depressed similarity mea-sure, the definition of the weight between vertices is as follows.
w0(vi,vj)=
|N(vi)∩N(vj)|
max{Di,Dj}
+u(vi,vj) (19)
[image:10.576.313.523.366.513.2] [image:10.576.315.520.553.704.2]The experimental results are shown in Figure 13 and Figure 14. As shown the structural similarity measures
FIGURE 13. NMI on real-world networks, obtained by our community detection methods with different structural similarity measures.
proposed in this paper, it obviously offers better performance than other similarity measures. The result of using PA is the worst. When HP and HD are used separately, its performance is general and some results less than the other similarity measures. However when using use a combination of HP and HD, its performance is apparently improved.
V. CONCLUSION
The community reflects the local characteristics of individual behavior in the network and relationships. The study of the community in the network plays a vital role in understanding the structure and function of the whole network, and can help us analyze and predict the interaction between the elements of the network. In fact, community detection plays an important role in the analysis of metabolic network, analysis of genetic regulatory networks and master gene recognition. For exam-ple, the complex and community modules in the predicted protein interaction network are important for understanding the organization and function of the biological system and the prediction of the function of the unknown protein.
In this study, we aim to develop a community detection method that can extract the overlapping community structure of real-world networks. In specific, based on the existing studies on community detection only considering the network topology or the edge weight, we developed an overlapping community detection algorithm based on the seed expansion strategy (OCSE), which is a conceptual model of network community structure according to the edge information and the network topology information. The experimental findings showed that OSCE can get a better performance in terms of accuracy compared to existing algorithms.
REFERENCES
[1] Z. Zhao, S. Zheng, J. Sun, L. Chang, and F. Chiclana, ‘‘A comparative study on community detection methods in complex networks,’’J. Intell., Fuzzy Syst., vol. 35, no. 1, pp. 1077–1086, 2018.
[2] X. Wang and X. Qin, ‘‘Asymmetric intimacy and algorithm for detecting communities in bipartite networks,’’Phys. A, Stat. Mech., Appl., vol. 462, pp. 569–578, Nov. 2016.
[3] J. Li, X. Wang, and J. Eustace, ‘‘Detecting overlapping communities by seed community in weighted complex networks,’’Phys. A, Stat. Mech., Appl., vol. 392, no. 23, pp. 6125–6134, 2013.
[4] T. Heuer and S. Schlag, ‘‘Improving coarsening schemes for hypergraph partitioning by exploiting community structure,’’ inProc. Int. Symp. Exp. Algorithms, 2017, pp. 21:1–21:19.
[5] Y. Wang, H. Huang, C. Feng, and Z. Liu, ‘‘Community detection based on minimum-cut graph partitioning,’’ inProc. Int. Conf. Web-Age Inf. Manage., 2015, pp. 57–69.
[6] J. Cheng, L. Li, M. Leng, W. Lu, Y. Yao, and X. Chen, ‘‘A divisive spectral method for network community detection,’’J. Stat. Mech. Theory, Exp., vol. 2016, p. 033403, Mar. 2016.
[7] Z. Zhou and A. A. Amini, ‘‘Analysis of spectral clustering algorithms for community detection: The general bipartite setting,’’ to be published. [8] B. Yang, J. Di, J. Liu, and D. Liu, ‘‘Hierarchical community detection with
applications to real-world network analysis,’’Data, Knowl. Eng., vol. 83, pp. 20–38, Jan. 2013.
[9] T. Falkowski, A. Barth, and M. Spiliopoulou, ‘‘DENGRAPH: A density-based community detection algorithm,’’ in Proc. IEEE/WIC/ACM Int. Conf. Web Intell., Nov. 2007, pp. 112–115.
[10] F. Meng, F. Zhang, M. Zhu, Y. Xing, Z. Wang, and J. Shi, ‘‘Incre-mental density-based link clustering algorithm for community detection in dynamic networks,’’ Math. Problems Eng., vol. 2016, Dec. 2016, Art. no. 1873504.
[11] J. Eustace, X. Wang, and Y. Cui, ‘‘Community detection using local neighborhood in complex networks,’’Phys. A Stat. Mech., Appl., vol. 436, pp. 665–677, Oct. 2015.
[12] J. Eustace, X. Wang, and J. Li, ‘‘Approximating Web communities using subspace decomposition,’’ Knowl.-Based Syst., vol. 70, pp. 118–127, Nov. 2014.
[13] J. Li, X. Wang, and Y. Cui, ‘‘Uncovering the overlapping community structure of complex networks by maximal cliques,’’Phys. A, Stat. Mech., Appl., vol. 415, pp. 398–406, Dec. 2014.
[14] G. Palla, I. Derényi, I. Farkas, and T. Vicsek, ‘‘Uncovering the overlapping community structure of complex networks in nature and society,’’Nature, vol. 435, no. 7043, pp. 814–818, Jun. 2005.
[15] J. Eustace, X. Wang, and Y. Cui, ‘‘Overlapping community detection using neighborhood ratio matrix,’’Phys. A, Stat. Mech. Appl., vol. 421, pp. 510–521, Mar. 2015.
[16] U. N. Raghavan, R. Albert, and S. Kumara, ‘‘Near linear time algorithm to detect community structures in large-scale networks,’’Phys. Rev. E, Stat. Phys. Plasmas Fluids Relat. Interdiscip. Top., vol. 76, no. 3, p. 036106, 2007.
[17] X. Wang and J. Li, ‘‘Detecting communities by the core-vertex and intimate degree in complex networks,’’Phys. A, Stat. Mech., Appl., vol. 392, no. 10, pp. 2555–2563, 2013.
[18] Q. Wang and C. Zhang, ‘‘Improvement of overlapping community detec-tion based on local expansion and optimizadetec-tion,’’Appl. Res. Comput., to be published.
[19] P. Deshpande and B. Ravindran, ‘‘MCEIL: An improved scoring function for overlapping community detection using seed expansion methods,’’ in Proc. IEEE/ACM Int. Conf. Adv. Social Netw. Anal. Mining, Jul. 2017, pp. 652–659.
[20] J. P. Bagrow and E. M. Bollt, ‘‘Local method for detecting communities,’’ Phys. Rev. E, Stat. Phys. Plasmas Fluids Relat. Interdiscip. Top., vol. 72, no. 4, p. 046108, 2005.
[21] A. Clauset, ‘‘Finding local community structure in networks,’’Phys. Rev. E, Stat. Phys. Plasmas Fluids Relat. Interdiscip. Top., vol. 72, no. 2, p. 026132, 2005.
[22] J. Huang, H. Sun, Y. Liu, Q. Song, and T. Weninger, ‘‘Towards online multiresolution community detection in large-scale networks,’’PLoS ONE, vol. 6, no. 8, p. e23829, 2011.
[23] Z. Wang, Y. Zhao, Z. Chen, and Q. Niu, ‘‘An improved topology-potential-based community detection algorithm for complex network,’’Sci. World J., vol. 2014, Jan. 2014, Art. no. 121609.
[24] W. Zhao, F. Zhang, and J. Liu,Local Community Detection Via Edge Weighting. Springer, 2016.
[25] B. Wang, H. B. Zheng, Y. J. Fang, and J. J. Wei, ‘‘Overlapping commu-nity detection algorithm based on seed diffusion,’’Appl. Mech., Mater., vols. 556–562, pp. 3300–3304, May 2014.
[26] J. Xianget al., ‘‘Enhancing community detection by using local structural information,’’J. Stat. Mech., Theory Exp., vol. 2016, p. 033405, Mar. 2016. [27] A. Khadivi, R. A. Ajdari, and M. Hasler, ‘‘Network community-detection enhancement by proper weighting,’’Phys. Rev. E, Stat. Phys. Plasmas Fluids Relat. Interdiscip. Top., vol. 83, no. 4, p. 046104, 2011.
[28] S. Asur, D. Ucar, and S. Parthasarathy,An Ensemble Framework for Clustering Protein-Protein Interaction Networks. London, U.K.: Oxford Univ. Press, 2007.
[29] P. De Meo, E. Ferrara, G. Fiumara, G. Provetti, ‘‘Enhancing commu-nity detection using a network weighting strategy,’’Inf. Sci., vol. 222, pp. 648–668, Feb. 2013.
[30] J. W. Berry, B. Hendrickson, R. A. Laviolette, and C. A. Phillips, ‘‘Tolerat-ing the community detection resolution limit with edge weight‘‘Tolerat-ing,’’Phys. Rev. E, Stat. Phys. Plasmas Fluids Relat. Interdiscip. Top., vol. 83, no. 5, p. 056119, 2011.
[31] D. Lai, H. Lu, and C. Nardini, ‘‘Enhanced modularity-based community detection by random walk network preprocessing,’’Phys. Rev. E, Stat. Phys. Plasmas Fluids Relat. Interdiscip. Top., vol. 81, p. 066118, Jun. 2010. [32] E. Ravasz, A. L. Somera, and D. A. Mongru, ‘‘Hierarchical organiza-tion of modularity in metabolic networks,’’Science, vol. 297, no. 5586, pp. 1551–1555, 2002.
[33] Z.-X. Wang, Z.-C. Li, X.-F. Ding, and J.-H. Tang, ‘‘Overlapping com-munity detection based on node location analysis,’’Knowl.-Based Syst., vol. 105, pp. 225–235, Aug. 2016.
[35] T. Zhou, L. Lü, and Y. C. Zhang, ‘‘Predicting missing links via local information,’’Eur. Phys. J. B, vol. 71, no. 4, pp. 623–630, 2009. [36] X. Wenet al., ‘‘A maximal clique based multiobjective evolutionary
algo-rithm for overlapping community detection,’’IEEE Trans. Evol. Comput., vol. 21, no. 3, pp. 363–377, Jun. 2017.
[37] S. Gregory, ‘‘Finding overlapping communities in networks by label prop-agation,’’New J. Phys., vol. 12, pp. 2011–2024, Oct. 2009.
[38] Y. Cui, X. Wang, and J. Eustace, ‘‘Detecting community structure via the maximal sub-graphs and belonging degrees in complex networks,’’Phys. A, Stat. Mech., Appl., vol. 416, pp. 198–207, Dec. 2014.
[39] M. Hajiabadi, H. Zare, and H. Bobarshad, ‘‘IEDC: An integrated approach for overlapping and non-overlapping community detection,’’ Knowl.-Based Syst., vol. 123, pp. 188–199, May 2017.
[40] Y. Cui, X. Wang, and J. Li, ‘‘Detecting overlapping communities in net-works using the maximal sub-graph and the clustering coefficient,’’Phys. A, Stat. Mech., Appl., vol. 405, pp. 85–91, Jul. 2014.
[41] M. Newman. (2015).Network Dataset. [Online]. Available: http://www-personal.umich.edu/?mejn/netdata/
[42] Q. Cai, L. Ma, and M. Gong, ‘‘A survey on network community detection based on evolutionary computation,’’Int. J. Bio-Inspired Comput., vol. 8, no. 2, pp. 84–98, 2014.
[43] P. Zhang, ‘‘Evaluating accuracy of community detection using the rel-ative normalized mutual information,’’Comput. Sci., vol. 2015, no. 11, p. P11006, 2015.
[44] V. Nicosia, G. Mangioni, V. Carchiolo, and M. Malgeri, ‘‘Extending the definition of modularity to directed graphs with overlapping communi-ties,’’J. Stat. Mech., Theory Exp., vol. 2009, p. 03024, Mar. 2009. [45] M. E. J. Newman, ‘‘Fast algorithm for detecting community structure in
networks,’’Phys. Rev. E, Stat. Phys. Plasmas Fluids Relat. Interdiscip. Top., vol. 69, no. 6, p. 066133, 2004.
[46] A. Lancichinetti and S. Fortunato, ‘‘Benchmarks for testing community detection algorithms on directed and weighted graphs with overlapping communities,’’Phys. Rev. E, Stat. Phys. Plasmas Fluids Relat. Interdiscip. Top., vol. 80, no. 1, p. 016118, 2009.
[47] J. Xie, S. Kelley, and B. K. Szymanski, ‘‘Overlapping community detection in networks: The state-of-the-art and comparative study,’’ACM Comput. Surv., vol. 45, no. 4, p. 43, 2013.
[48] KONECT. (2015).Network Dataset. [Online]. Available: http://konect.uni-koblenz.de/networks
[49] J. Crnic,Introduction to Modern Information Retrieval. New York, NY, USA: McGraw-Hill, 1983.
[50] P. Jaccard, ‘‘Etude de la distribution florale dans une portion des Alpes et du Jura,’’Bull. de la Soc. Vaudoise des Sci. Naturelles, vol. 37, pp. 547–579, Jan. 1901.
[51] E. A. Leicht, P. Holme, and M. E. J. Newman, ‘‘Vertex similarity in networks,’’Phys. Rev. E, Stat. Phys. Plasmas Fluids Relat. Interdiscip. Top., vol. 73, no. 2, p. 026120, 2006.
QI LIreceived the M.S. degree from the College of Information Engineering, Shanghai Maritime University, in 2015. He is currently pursuing the Ph.D. degree with the College of Computer Science, Chongqing University, Chongqing. His research interests include data mining and graph computing.
JIANG ZHONG received the Ph.D. degree from Chongqing University, Chongqing, China, in 2005. He is currently a Professor with Chongqing University. His main research inter-ests include data mining, management informa-tion system, trusted computer system, and service computing.
QING LIis currently pursuing the Ph.D. with the College of Computer Science, Chongqing Univer-sity. She is the author/co–author of papers in con-ferences, book chapters, and journals. Her main research interests include data mining, big data analytics, and machine learning.
CHEN WANGreceived the bachelor’s and mas-ter’s degrees from the Chongqing University of Posts and Telecommunications, in 2013 and 2016, respectively. He is currently pursuing the Ph.D. degree in software engineering at Chongqing University. His main research interests include machine learning, computer vision, and data mining.