Acta Crystallographica Section D
Biological Crystallography
ISSN 1399-0047
A high-throughput colourimetric method for the
determination of pH in crystallization screens
Jobie Kirkwood,a* Julie
Wilson,a,bSimon O’Keefecand David Hargreavesd*
aDepartment of Chemistry, University of York, York YO10 5DD, England,bDepartment of Mathematics, University of York, York YO10 5DD, England,cDepartment of Computer Science, University of York, York YO10 5DD, England, anddAstraZeneca, Alderley Park, Cheshire SK10 4TF, England
Correspondence e-mail: [email protected], [email protected]
#2014 International Union of Crystallography
The crystallization of proteins is dependent on the careful control of numerous parameters, one of these being pH. The pH of crystallization is generally reported as that of the buffer; however, the true pH has been found to be as many as four pH units away. Measurement of pH with a meter is time-consuming and requires the reformatting of the crystallization solution. To overcome this, a high-throughput method for pH determination of buffered solutions has been developed with results comparable to those of a pH meter.
Received 24 March 2014 Accepted 14 June 2014
1. Introduction
screen, which may also require reformatting to accommodate the probe.
Newman et al. (2012) have described a method for the high-throughput measurement of pH using the indicator dye Yamada Universal Indicator together with automated imaging. The colour information of a dyed crystallization solution was recorded as a single hue obtained from an image of a region of the well. This hue value is compared with those obtained for standard curves prepared from broad-range buffer systems to provide an estimate of the true pH of the solution. For structural genomics centres and other labora-tories with automated imaging systems in place, the method provides a fast low-cost pH assay with a strong correlation to measurements obtained with a pH meter over the pH range 4.0–10.5. However, the need for a suitable imaging system that will provide consistent, reproducible results makes the method unfeasible for many laboratories. Furthermore, Newmanet al.
(2012) found little variation in colour within the pH range 5.5–7.0, a range common in crystallization trials. Although recognizing this limitation of Universal Indicator (UI), they point out the difficulty in producing dyes with good discrimi-natory power over a wide pH range.
Here, we describe a colourimetric method for estimating the final pH of crystallization screens that does not require an imaging system, but instead measures the absorbance of solutions using spectrophotometry. We show that the indicator
dye bromothymol blue gives greater discrimination than UI and other dye systems over the pH range 5.5–7.5.
2. Materials and methods
2.1. Preparation of the pH gradients
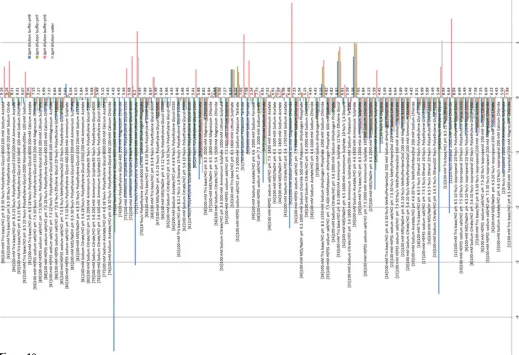
A 96-point pH gradient (referred to as the ‘96-point screen’) was produced using the broad-range buffer system PCTP (Newman, 2004) supplied by Molecular Dimensions. The buffer was dispensed into a 96 deep-well block using an Emerald BioSystems Matrix Maker at a final concentration of 100 mMwith assumed linearity between pH 4.0 and pH 9.5. A second 96 deep-well block (referred to as the ‘short screen’) was produced where each row (A1–A12, B1–B12 etc.) was composed of a 12-point linear pH gradient 4.0–9.5 (PCTP, 100 mM). In order to assess the performance of the spectro-photometric method against common crystallization buffers a third screen was dispensed (referred to as the ‘buffer screen’) containing the following buffers in a 12-point range spanning
[image:2.610.45.567.401.703.2]1 of their respective pKavalues with a final concentration of 100 mM. The contents of the buffer screen were as follows (rows A–H): sodium acetate (pKa4.75), sodium citrate (pKa 5.40), MES (pKa6. 10), sodium cacodylate (pKa6.27), sodium HEPES (pKa7.50) and Tris–HCl (pKa8.30), PCTP pH 4.0–9.5. Row H contained only water, which was included as a control.
Figure 1
The pH of all three screens was measured using a well main-tained and calibrated Jenway 4330 pH meter (with Jenway probe; catalogue No. 924005) calibrated using the following standards: Fisher phthalate, pH 4.00; phosphate, pH 7.00; borate, pH 10.00.
In order to test the effect of protein buffer and protein on the final pH in a crystallization experiment, 10 ml lysozyme solution (Sigma) was prepared at 50 mg ml1 (3.5 mM) in 10 mMPCTP, 100 mMsodium chloride at pH 5.0, 7.0 and 9.0. It was noted that addition of the lysozyme shifted the pH considerably, giving values of 3.8, 4.34 and 4.87, respectively. The pH of three protein solutions was therefore adjusted using 10 mMsodium hydroxide before making them up to the final volume with buffer.
2.2. Measuring absorbance
20ml of UI stock solution (Sigma) was dispensed into a 96-well flat-bottomed Costar 3635 UV–Vis assay plate using a Robbins Hydra 96 robot. 150ml of the 96-point screen was transferred from the deep-well block to an assay plate using a Thermo Scientific Matrix Hydra II robot and the plate was mixed briefly using an orbital plate mixer. The plate was then read using a Bio-Tek PowerWave XS UV–Vis plate reader
programmed to scan from 400 to 700 nm in 5 nm increments, generating a 61-point absorption spectrum for each well, which was exported toMicrosoft Excelfor data processing.
2.3. Curve normalization
In order to compensate for variation in measured absor-bance owing to pipetting and mixing errors, min–max data normalization was used. The normalized absorbance at wavelengthxis given by
^
a ax¼
axminðaÞ
maxðaÞ minðaÞ; ð1Þ
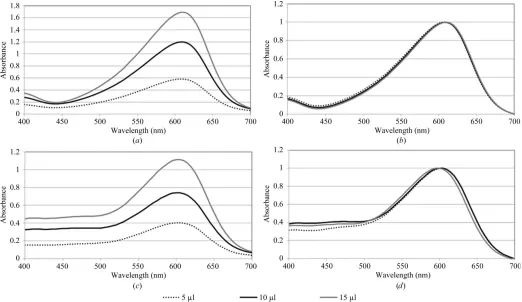
where min(a) and max(a) are the minimum and maximum absorbance over the range 400–700 nm. Fig. 1 shows two sets of spectra obtained for PCTP buffer at pH 4.5 and 7.5 using different volumes of indicator dye before and after normal-ization. It can be seen that normalization preserves the overall curve shape and enables better curve matching.
2.4. Curve matching
In order to assign a pH value to a solution using the spec-trophotometric method, the normalized spectrum obtained for the unknown solution is compared with normalized spectra obtained for standard curve solutions of known pH. The best match is determined using the smallest mean absolute devia-tion (MAD) as a distance metric, where the MAD between two vectors,xandy, of lengthnis defined by
MADðx;yÞ ¼1 n
Pn
i¼1
jxiyij: ð2Þ
The pH corresponding to the best match is assigned to the solution of unknown pH.
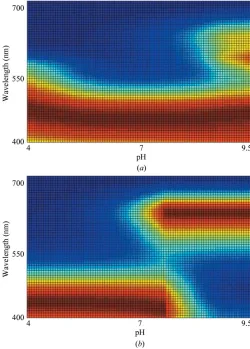
MAD was also used to assess the performance of other dyes. A good indicator dye system should have a large MAD between spectra representing pH change. The heat plot in Fig. 2(a) shows the absorbance spectrum obtained for the standard solutions using 20ml UI. The 96 wells cover a linear range of pH from 4.0 to 9.5, with the range between pH 5.5 and pH 7.0 being particularly important for protein crystallization (Kantardjieff & Rupp, 2004). Newmanet al.(2012) found the response for UI determined from RGB values to be poor for this range of pH and this flat response can be seen in Fig. 2(a) with very little difference between the spectral curves. Conversely, as shown in Fig. 2(b), bromothymol blue has large MAD values in the range pH 5.5–7.0 and provides good discrimination between waves indicative of similar pH values. However, Fig. 2(b) also shows that the discrimination between pH values is poorer for the most basic and acidic values.
2.5. Testing other dyes
[image:3.610.44.294.363.712.2]Owing to the poor performance of UI, it was decided to test other indicator dyes using MAD analysis. The component dyes of UI along with nitrazine yellow and bromocresol green were tested. The component dyes of UI were made up in 100% DMSO at the concentration ratios that they are generally used at in the indicator solution (thymol blue, 1.1 mM; methyl red, Figure 2
4.6 mM; bromothymol blue, 8.0 mM; phenolphthalein, 31.4 mM). Nitrazine yellow and bromocresol green were made up at 2 mM in 100% DMSO. A mixture of the UI dyes excluding phenolphthalein was also made by combining the stocks in a 1:1:1 ratio (equivalent to UI without phenol-phthalein and referred to as UI-p). It was hypothesized that UI-p may have a better response over the pH 4–9.5 range under investigation as phenolphthalein has a sharp colour transition (colourless to fuschia red) around pH 9 and the colour differs from the other components, which are of a blue hue. 10ml of each dye (20ml for UI) was pipetted into a separate row of a Costar 3635 UV–Vis assay plate using a multichannel pipette, after which 150ml of the short screen was added.
Fig. 3(a) shows the results for the comparison of indicator dyes with the short-screen buffer gradient. It can be seen from the photograph of the plate that different indicator dyes change colour at different pH values according to the protonation state of the dye molecule, which is governed by the pKa of the dye. No single dye covers the entire pH range tested (pH 4.0–9.5) and some dyes have a narrow transition range, e.g. phenolphthalein. Universal Indicator (row H) is a combination of thymol blue, methyl red, bromothymol blue and phenolphthalein which capi-talizes on the complementarity of the dye pKa values and colour transitions (Foster & Gruntfest, 1937).
Calculation of the MAD values for the eight indicator dyes correlates with the observed pattern of colour changes and is shown as heat plots in Fig. 3(b). The ideal indicator dye would discrimi-nate between pH values across the full
range. Thymol blue (row A),
phenolphthalein (row E) and bromo-cresol green (row F) have narrow response ranges, only changing colour over a small pH range with negligible MAD values between the standard curve spectra for most pH values. Both thymol blue and phenolphthalein only show a response at our most basic pH, giving insignificant MAD values between wells at lower pH. Similarly, methyl red (row B) and bromocresol green only respond to the most acidic pH and cannot discriminate between wells of higher pH.
Both bromothymol blue (row C) and nitrazine yellow (row D) show a response across a range of pH values with significant differences between the
absorbance curves indicated by large MAD values. Fig. 3 shows that both indicator dyes are able to discriminate between wells representing the pH range 5.5–7.5. However, both dyes have very small MAD values at the extremes, although bromothymol blue changes more across the basic pH range whereas nitrazine yellow changes more with acidic pH. Phenolphthalein has a pKaof 9.7, meaning that the dye colour transition is at very basic pH and is probably not necessary for the assessment of pH in crystallization experiments.
In comparison to UI, bromothymol blue and nitrazine yellow were found to be more sensitive in the mid-range of pH 5.5–7.5, with bromothymol blue judged to be marginally better than nitrazine yellow (Fig. 4). UI, on the other hand, showed
Figure 3
[image:4.610.226.566.240.673.2]greater sensitivity at more extreme pH values. UI-p only marginally improved the sensitivity of the dye system over the mid-range of pH. Based on these findings, it was decided to continue experimentation with the simple bromothymol blue dye system.
3. Results
In order to test the spectrophotometric pH assay with a wider range of crystallization buffers, bromothymol blue was used in conjunction with the buffer screen as described previously. It was clear from the initial results that the row containing only water consistently gave acidic values (Fig. 5) owing to the initial colouration of the indicator solution and perhaps owing
to carbon dioxide from the air being dissolved into the water. We therefore only consider our method suitable for deter-mining the pH of buffered solutions.
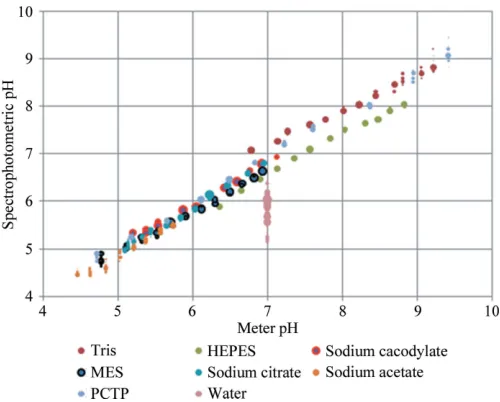
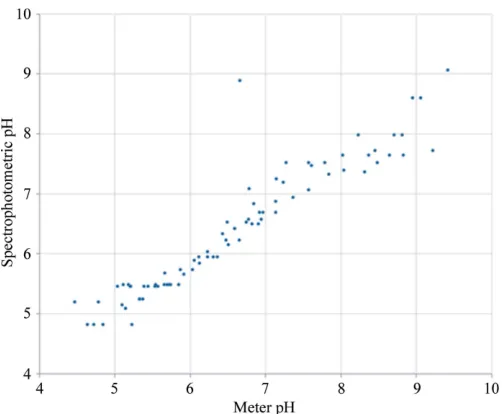
Fig. 5 shows the spectrophotometric pH values for the 96-point buffer screen plotted against the measurements obtained using a pH meter. Only 91 points are shown, as five points were measured with the pH meter to be outside the pH range of our system. For the buffers there is a very strong (Pearson’s product–moment) correlation of 0.998 between the calculated and measured pH values. The distribution of deviation is positively skewed, with a mean value of 0.16 for the buffered observations.
[image:5.610.46.294.257.386.2]In order to test the reproducibility, which is generally more important than accuracy in crystallization trials, seven aliquots of the buffer screen were dispensed, measured spectrophoto-metrically and compared with ten separate standard curves. Fig. 6 shows the reproducibility of the system. Correlations of between 0.987 and 0.989 were obtained, with regression slopes and intercepts of 0.90 and 0.43, respectively, for the worst fit and of 0.94 and 0.26 for the best model. As five observations were removed owing to being outside the range of the 96-point screen, the graph represents 5530 observations from 79 buffers and 840 observations of water. For the best and worst models, the distribution of error was positively skewed, with mean values of 0.17 and 0.27.
An analysis of the errors in the repeated experiments was used to provide a threshold for the curve-matching algorithm. MAD values beyond the specified threshold result in a warning that the pH values returned may not be reliable.
Bukrinsky & Poulsen (2001) tested the pH of conditions in the Crystal Screen kit and found that several differed by more than one unit from the pH of the buffer system, with two Figure 4
[image:5.610.315.565.464.665.2]The mean errors between the measured pH and the values calculated with the spectrophotometric method using the indicator dyes nitrazine yellow and bromothymol blue. The errors are given as absolute values averaged over 0.5 pH unit bins (as determined by the pH meter readings). It can be seen that the errors are significantly worse for nitrazine yellow for pH 8.0–10.0.
Figure 5
Scatter plot showing the pH measurements obtained for the 96-well standard curve solutions. The values obtained using spectrophotometry are plotted against the measurements obtained using a pH meter. The linear regression line relating the pH measured by spectrophotometry (y) and the pH measured with a pH meter (x) is also shown for buffered solutions. The linear regression equation andR2are calculated using only buffers (i.e.not water).
Figure 6
[image:5.610.45.294.466.672.2]conditions differing by more than three units. We used our method to test three common crystallization screens: Hampton Index HT, Rigaku Wizard and Molecular Dimen-sions JCSG-plus. After removing data points corresponding to wells without buffer and those having a spectrophotometric pH of 4.5 or pH 9.5 (pH values at the edges of the 96-point screen and therefore potentially outside the range of the assay), a total of 247 conditions remained. Fig. 7 shows the
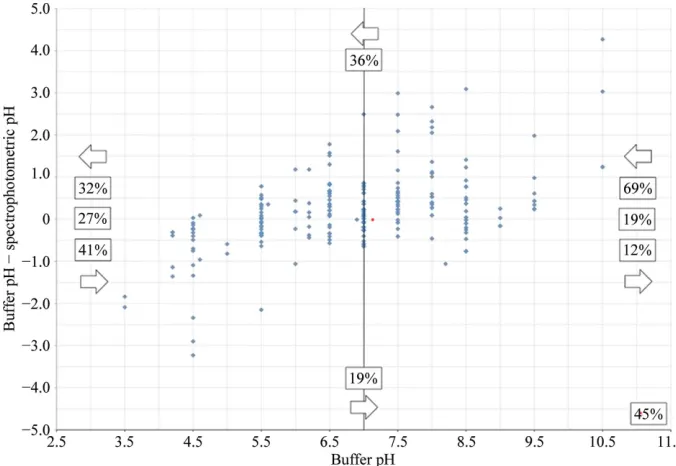
differences between the buffer pH values and the values obtained by spectrophotometry for the 247 conditions in the three screens. For buffer pH values less than pH 7.0, 27% differed by less than 0.2 pH units (the estimated error in our method); the measured values are higher for 41% and lower for 32%. The greatest differences are for the more acidic buffers, some of which differed by more than two pH units, being more neutral than the buffer pH would suggest. For buffer pH values greater than 7.0, 69% are more neutral than the buffer pH with even more extreme differences. Only 12% had measured values more basic than the buffer pH and 19% differed by less than 0.2 pH units. For solutions with a buffer pH of 7.0, 36% were more neutral, 19% were less neutral and 45% differed by less than 0.2 pH units. Overall, we found that the measured values are often more neutral than the buffer values. This is particu-larly true for the most extreme buffer pH values, so that pH space is not sampled as widely as the screens suggest. Fig. 8 shows a histogram of various pH differences with the number of wells in each bin.
We found 18 conditions with
[image:6.610.44.382.188.421.2]measured pH values more than two units away from the pH of the buffer (two for Index, ten for Wizard and five for JCSG-plus). In the Wizard screen, we determined the pH of condition 27 (1.2M sodium phosphate monobasic, 0.8M potassium phosphate dibasic, 0.1MCAPS/sodium hydroxide pH 10.5, 0.2M lithium sulfate) to be 6.23, 4.27 pH units away from the buffer pH of 10.5. In total, 74% of all conditions tested were found to differ from the pH of the buffer by more than 0.2 pH units. Other conditions with a large disparity between our measured pH and the buffer pH included those containing PEGs and ammonium compounds. It is known that PEGs undergo degradation over time (Jurnak, 1986; Ray & Puva-thingal, 1985) and that ammonium compounds slowly release ammonia (Newmanet al., 2012; Mikolet al., 1989) and could therefore create problems with reproducibility. Our analysis shows that screens may not search pH para-meter space as systematically or speci-fically as the design intended. The pH values for each of the three screens, as reported by the manufacturer (the buffer pH) and as measured by the Figure 8
Histogram of pH differences. The bins correspond to differences between the buffer pH and the pH value measured using the colourimetric method and the frequencies of the number of solutions with differences within each bin. The percentage of the 247 conditions from three commercial screens with a difference in each interval is also given.
Figure 7
[image:6.610.46.387.525.700.2]colourimetric method, are given in Supplementary Table S11 along with the results for the buffer screen measured by the colourimetric method and using a pH meter (Supplementary Table S2).
The results described so far relate to the pH of the crys-tallization solution rather than the mixture of protein and crystallization solution. Crystallization occurs at the pH of this mixture, which could differ from that of the crystallization solution owing to the effects of any buffer, salts or additives in the protein solution as well as any effect from the protein itself.
In order to test the effect of the protein buffer and protein on the final pH of a standard crystallization experiment, 75ml lysozyme solution (described previously) at pH 5.0, 7.0 and 9.0 was added to 75ml of a standard set of crystallization condi-tions. The pH of the mixture was then determined colour-imetrically before the plate was sealed and stored at room temperature. In addition, the experiment was repeated using water and the three buffers without lysozyme present. The composition of these solutions, their measured pH and buffer pH are shown in Supplementary Table S6.
Fig. 9 shows that there is little change in the pH of a solution after the inclusion of a buffered protein. All three pH levels of buffered lysozyme have a strong correlation between the pH before and after the inclusion of lysozyme. The correlation coefficients are 0.98, 0.97 and 0.97, with mean absolute deviations of 0.23, 0.20 and 0.18 for pH 5, 7 and 9, respectively. As these deviations are within the expected error of the method, it is assumed that these differences are caused predominantly by the spectrophotometric system and not by the effect of lysozyme in the buffer.
Fig. 10 shows the effect of the protein buffer on the final pH of a typical crystallization experiment. The histogram bars are coloured red, green and blue for buffer at pH 5.0, 7.0 and 9.0, respectively (water is shown in grey). Only small shifts resulting from the inclusion of 10 mM protein buffer are observed where the crystallization conditions already contain 100 mMbuffer (mostly less than 0.5 pH units). However, large shifts in pH are observed for solutions where no buffer is present. Some of the conditions set up using the lysozyme solution produced crystals (see Supplementary Table S3; crystal hits are coloured green). Among these were a number of unbuffered conditions (Fig. 10, Supplementary Table S3; conditions 2, 12, 42, 60, 72, 73, 74 and 75) where crystals appear to grow at a specific pH governed solely by the protein buffer in these conditions. These results suggest that when using screens containing unbuffered conditions the protein buffer pH becomes significant.
The pH of a number of conditions tested with the three protein buffers fell outside the assay range for all measure-ments. These were conditions 3, 19, 38, 56, 64 and 76, suggesting a pH of <4.5 regardless of the protein buffer pH used. These conditions all contained sodium acetate buffer (100 mM, pH 4.6), except for condition 56, which contained
[image:7.610.314.565.136.685.2]sodium citrate (100 mM, pH 5.6). Similarly basic conditions with starting pH of >8.5 (100 mMTris–HCl pH 8.5) behave erroneously in some cases; for example, conditions 53 and 58. Dilution with water alone produces no shift or a slightly basic
Figure 9
Scatter plots showing the pH of the mother liquor plotted against the pH of a 50:50 mixture of mother liquor and protein in buffer for lysozyme buffered at three different pH levels: (a) pH 5, with a correlation of 0.98 and an MAD of 0.23; (b) pH 7, with a correlation of 0.98 and an MAD of 0.20; (c) pH 9, with a correlation of 0.97 and an MAD of 0.18.
1
shift with respect to the starting condition pH in 70 of the 96 conditions.
To improve the applicability of the method, we also inves-tigated miniaturization of the pH assay using a 384-well Greiner UV plate. For each of the 96-point standard screen solutions, 25ml was pipetted in quadruplicate with 2ml bromothymol blue indicator dye. The plate was read using the scan function on the plate reader, which improved the overall turnaround time from 40 min for a 96-well plate to less than 20 min for a 384-well plate. Analysis of the data showed the miniaturized assay to be of comparable accuracy to that of the normal volume assay, with a correlation of 0.94 and an MAD of 0.35 (Fig. 11 and Supplementary Table S5).
4. Discussion and conclusions
While the colour-based pH assay of Newmanet al.(2012) is suitable for use in a high-throughput crystallization facility
[image:8.610.46.565.304.659.2]where automated imaging is already in place, the authors recognized the need for a colour imager to be a drawback of their method. They suggested that spectrophotometry could provide a more accessible assay. However, they found the use of a UV–Vis spectrophotometer to measure absorbance curves unreliable and concluded that the method was not viable. We have demonstrated that the use of spectrophoto-metryviaa visible-light plate reader together with the indi-cator dye bromothymol blue can be used to determine pH with an average absolute deviation of0.2 pH units from the pH measured using a pH meter. The comparison makes the pH meter the ‘benchmark’ for a pH reading, although is well known that pH meters can be inaccurate (Illingworth, 1981). We tested the variation between pH meters using three different meters (Supplementary Table S4) and found the overall average error to be 0.09 pH units. Sodium ion inter-ference at high pH, acid errors at very low pH and tempera-ture can cause measured values to differ from the theoretical
Figure 10
A bar chart showing the effect of the protein buffer on the final pH of a typical crystallization experiment. The histogram bars are coloured red, green and blue for the protein buffer (10 mMPCTP, 100 mMNaCl) at pH 5.0, 7.0 and 9.0, respectively (water is shown in grey). Buffered protein (lysozyme at 50 mg ml1), buffer or water was added to the crystallization condition in 75 + 75ml aliquots in order to mimic a1
2+ 1
pH (Kohlmann, 2003; Beynon & Easterby, 1996). These factors are likely to affect pH in crystallization trials too as many conditions contain very high concentrations of salts contributing to changes in the activity coefficient of hydrogen ions and crowding effects. These complex phenomena make relying on the buffer pH in crystallization experiments in-accurate.
The indicator dye bromothymol blue gives good discrimi-nation between absorbance spectra in the pH range 5.5–7.5, where UI shows a flat response. However, bromothymol blue is less reliable at lower pH and above pH 8.0. The vast majority of proteins crystallize within the mid-pH range, where bromothymol blue can be used reliably and the use of a single dye avoids the potential impact on reproducibility that would result from a mixture of components. For other uses, for example the quality control of stock solutions, where the pH falls outside the pH 5.5–7.0 range, combinations of dyes are likely to be convenient and effective. Rather than mixing the components in an attempt to provide an indicator dye that covers the full pH range required for protein crystallization, multiple standard curves could be used. For example, separate standard curves could be produced for different dyes and the conditions within a screen checked using the appropriate dye and standard curve.
As one of the few parameters consistently reported, the pH of crystallization conditions offers potential in optimization strategies. However, the reported pH can be wrong by as many as four pH units (Bukrinsky & Poulsen, 2001). We have
developed a fast method that is easy to implement and can provide pH values with a high correlation (0.98) to the measurement made with a pH meter. The pH of crystallization solutions has been shown to change over time (Jurnak, 1986) and the colourimetric method can be used to provide a simple check on screens used repeatedly. The method compares favourably with the RGB method to determine pH (Newman
et al., 2012) and could be more accessible in that it requires a UV–Vis plate reader to measure absorbance curves rather than an integrated imaging system. The time required to dispense and read a 96-well plate and calculate the pH values in Microsoft Excel is approximately 40 min, but this was reduced to less than 20 min using a 384-well plate with a scan function on the plate reader. Tailoring the wavelength to specific dyes could increase the speed of data acquisition further. For example, it is not necessary to read methyl red at lower wavelengths as the dye absorbs in the higher wavelength region.
The Microsoft Excel macro files to process the data and return a pH value for each well are available on request from Jobie Kirkwood ([email protected]).
We would like to acknowledge the UK Biotechnology and Biological Sciences Research Council (BBSRC grant BB/ I015868/1) and AstraZeneca for supporting this research. The authors would also like to thank Gareth Davies for his expert guidance in setting up the spectrophotometer.
References
Beynon, R. J. & Easterby, J. S. (1996). Buffer Solutions. Oxford University Press.
Bukrinsky, J. T. & Poulsen, J.-C. N. (2001).J. Appl. Cryst.34, 533–534. Foster, L. S. & Gruntfest, I. J. (1937).J. Chem. Educ.14, 274. Illingworth, J. A. (1981).Biochem. J.195, 259–262.
Jancarik, J. & Kim, S.-H. (1991).J. Appl. Cryst.24, 409–411. Jurnak, F. (1986).J. Cryst. Growth,76, 577–582.
Kantardjieff, K. A. & Rupp, B. (2004).Bioinformatics,20, 2162–2168. Kohlmann, F. (2003).What is pH and How is it Measured?, p. 7. Loveland: Hach Co. http://www.hach.com/asset-get.download.jsa? id=7639984488.
Luft, J. R., Collins, R. J., Fehrman, N. A., Lauricella, A. M., Veatch, C. K. & DeTitta, G. T. (2003).J. Struct. Biol.142, 170–179. Luft, J. R., Wolfley, J. R. & Snell, E. H. (2011).Cryst. Growth Des.11,
651–663.
McPherson, A. (1989).Preparation and Analysis of Protein Crystals.
Malaber: Krieger.
Mikol, V., Rodeau, J.-L. & Giege´, R. (1989). J. Appl. Cryst. 22, 155–161.
Newman, J. (2004).Acta Cryst.D60, 610–612.
Newman, J., Sayle, R. A. & Fazio, V. J. (2012).Acta Cryst.D68, 1003– 1009.
Ray, W. J. Jr & Puvathingal, J. M. (1985). Anal. Biochem. 146, 307–312.
Wooh, J. W., Kidd, R. D., Martin, J. L. & Kobe, B. (2003).Acta Cryst.
[image:9.610.46.297.68.275.2]D59, 769–772.
Figure 11