This is a repository copy of
Storm runoff response to rainfall pattern, magnitude and
urbanization in a developing urban catchment
.
White Rose Research Online URL for this paper:
http://eprints.whiterose.ac.uk/88349/
Version: Accepted Version
Article:
Guan, M, Sillanpää, N and Koivusalo, H (2016) Storm runoff response to rainfall pattern,
magnitude and urbanization in a developing urban catchment. Hydrological Processes, 30
(4). pp. 543-557. ISSN 1099-1085
https://doi.org/10.1002/hyp.10624
[email protected] https://eprints.whiterose.ac.uk/
Reuse
Unless indicated otherwise, fulltext items are protected by copyright with all rights reserved. The copyright exception in section 29 of the Copyright, Designs and Patents Act 1988 allows the making of a single copy solely for the purpose of non-commercial research or private study within the limits of fair dealing. The publisher or other rights-holder may allow further reproduction and re-use of this version - refer to the White Rose Research Online record for this item. Where records identify the publisher as the copyright holder, users can verify any specific terms of use on the publisher’s website.
Takedown
If you consider content in White Rose Research Online to be in breach of UK law, please notify us by
Storm runoff response to rainfall pattern, magnitude and urbanization in a
developing urban catchment
Mingfu Guana, b*, Nora Sillanpääa, and Harri Koivusaloa
a
Department of Civil and Environmental Engineering, Aalto University, Espoo, Finland
b
School of Civil Engineering, University of Leeds, Leeds, UK
Abstract: This study explored the hydrological impacts of urbanization, rainfall pattern and magnitude in a
developing catchment. The Stormwater Management Model (SWMM) was parameterized, calibrated and validated in three development phases which had a same catchment area (12.3 ha) but different land use intensities. The model calibration and validation by using sub-hourly hydro-meteorological data demonstrated a good performance of the model in predicting stormwater runoff in the different development phases. Based on the results a threshold between minor and major rainfall events was identified and conservatively determined to be about 17.5 mm in depth. Direct runoff for minor storm events has a linear relationship with rainfall; however, events with a rainfall depth greater than the threshold yields a rainfall-runoff regression line with a clearly steeper slope. The difference in urban rainfall-runoff generation between minor and major rainfall events diminishes with the increase of imperviousness. Urbanization leads to an increase in the production of stormwater runoff, but during infrequent major storms the runoff contribution from pervious surfaces reduces the runoff changes due to urbanization. Rainfall pattern exerts an important effect on urban runoff, which is reflected in pervious runoff. With a same magnitude, prolonged rainfall events with unvarying low intensity yield the smallest peak flow and the smallest total runoff, yet rainfall events with high peak intensity produce the largest runoff volume. These results demonstrate the different roles of impervious and pervious surfaces in runoff generation and how runoff responds to rainstorms in urban catchments depends on hyetograph and event magnitude. Furthermore, the study provides a scientific basis of the design guideline sustainable urban drainage systems, which are still arbitrary in many countries.
Keywords: hydrological change; urbanization; rainfall pattern; event magnitude; SWMM
*
INTRODUCTION
The main hydrological impacts of urbanization are well known. Many studies have reported that urbanization increases stormwater runoff volume, flow rates and peak flows and decreases flow time and low flows (Cheng and Wang, 2002; Shusteret al., 2005; Janget al., 2007; Dietz and Clausen, 2008; Valtanenet al., 2014; Guanet al., 2015b; Sillanpää and Koivusalo, 2015). The increase of impervious surfaces and the utilization of efficient drainage systems are generally considered as the main driver of the hydrological changes. Detailed knowledge on stormwater runoff generation in pervious and impervious surfaces of an urban catchment is crucial for urban drainage design. In comparison to impervious runoff, runoff from pervious areas is more difficult to predict because it is associated with soil and vegetation type as well as with antecedent wetness (Boydet al., 1993).
with rainfall patterns. Furthermore, studies have shown that pervious surfaces can produce direct runoff in urban catchments. Sillanpää (2013) and Sillanpää and Koivusalo (2014) reported for residential catchments that it is possible to define a threshold rainfall depth that indicates a change in direct runoff generation from effective impervious surfaces onto pervious surfaces. This threshold corresponded to rainfall depth of 17-20 mm based on data from 601 storms. Based on the analysis of 763 storms from 26 urban catchments, Boyd et al. (1993) indicated that pervious runoff mainly depended on the event rainfall depth for storms less than 40 or 50 mm, while for the larger storms rainfall intensity and antecedent wetness also had an effect on runoff generation. Burton and Pitt (2002) reported that pervious areas may contribute the majority of urban runoff when the amount of rainfall exceeds approximately 20 mm. For the urban catchments in Florida, the same was observed for rainfall depths exceeding 25 mm (Said and Downing, 2010).
The studies cited above emphasized the contribution of pervious areas to the total urban runoff and its relationship with event magnitude. However, the combined effects of land cover change, rainfall pattern, and event magnitude on urban runoff generation have been not widely explored. This study presents simulations of urban storm runoff generated by various rainfall patterns and event magnitudes in three phases of a developing catchment in southern Finland. Long-term monitoring data with its quality assured by Sillanpää (2013) is used to calibrate and validate the SWMM model. The main aims of the study are (i) to identify a threshold between minor and major rainfall events in the study catchment, (ii) to quantify stormwater runoff contributed from impervious and pervious surfaces in the three development phases with distinct land use intensity, and (iii) to investigate the combined effects of urbanization, rainfall pattern and event magnitude in the studied catchment.
METHODOLOGY
Study catchment
impervious surfaces (IS) (22.3%) in the catchment. The impervious surfaces were further increased due to the construction work in the following years 2005 (33.4%) and 2006 (38.7%). In view of the land use intensity represented by the impervious surfaces, three phases of the catchment were prescribed: phase2004, phase2005 and phase2006. Table 1 illustrates the characteristics of the three development phases. The information from the Geological Survey of Finland demonstrates that the study site is covered by a layer of sandy till underlined with bedrock. The impervious land cover mainly includes apartment buildings and areas of pavements, streets, and parking lots. The impervious surfaces for each phase were digitized based on the 2011 aerial photo images in ArcGIS and the land use map (Figure 1).
Table 1. Characteristics of the three development phases of the catchment
Summary phase2004 phase2005 phase2006
total catchment area (ha) 12.3 12.3 12.3
estimated imperviousness (% IS) 22.3% 33.4% 38.7%
pervious area (ha) 9.53 8.17 7.52
impervious area (ha) 2.73 4.09 4.74
mean slope (%) 18.9
maximum slope (%) 32.6
land use apartment buildings, pavement, street and parking lot
soil type sandy till with bedrock underneath the topsoil
surface type buildings’ roof, asphalt/concrete for other impervious surfaces, and lawn and forest for the pervious areas
Data acquisition
The digital elevation model (DEM) with 2 × 2 m2grid cell size was used to delineate the urban catchment. Precipitation data was monitored during the construction period from 2001-2006 in a weather station located in the catchment outlet. The station was equipped with an ARG100 tipping bucket rain gauge, adjusted for a volume resolution of 0.2 mm. The temporal resolution of rainfall records was 10 min before September 2005 and 2 min starting from September 2005. Flow rates in a v-notch weir in an open ditch just outside the pipe sewer outlet were available for model calibration and validation. The flow measurements included runoff from the sewer network of the catchment and subsurface runoff affecting the low flow rates. More details about the instrumentation can be found in Sillanpää (2013) and Sillanpää and Koivusalo (2015). The stormwater network was provided by the Helsinki Region Environmental Services Authority. The network consists of 80 manholes and 77 pipes with circular shape. The diameter of the pipes is in a range of 250–650 mm.
Model implementation
infiltration loss and evaporation loss into account. Infiltration loss from pervious surfaces was calculated by using the GREEN-AMPT model. Evaporation was computed in the SWMM module based on the recorded daily averaged air temperature. The subcatchment characteristics, e.g. area (A), slope (S), flow path (L), imperviousness (IS), and flow width (W), were determined based on the DEM dataset and aerial photos of the catchment using the ArcGIS toolbox.
Simulation design
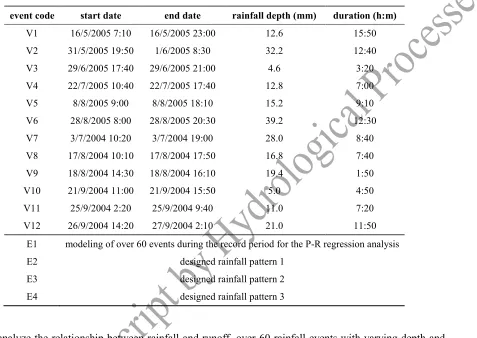
In this study, the rainfall-runoff events only in warm period (April to October) were chosen for the model calibration and validation in the three phases. Although the three phases represent different levels of imperviousness, they share the same soil types and surface properties, such as soil infiltration, surface storage depth and surface roughness etc. Therefore, to keep the consistence of the parameters, the calibration and validation of the model were performed during the whole developing period, i.e. the parameters were calibrated as the same for the three phases. The calibration and validation in the post-development phase (phase2006) was successfully performed in our previous study (Guan et al., 2015b). Herein we selected additional 12 events from phase2004 and phase2005 to re-validate these parameters to ensure a good performance of the models for simulating stormwater runoff in all three phases. Table 2 lists the selected rainfall-runoff events. The rainfall depth of these events ranges from 4.6 mm to 39.2 mm and the storm duration is in the range of 28 minutes to 15 hours 50 minutes. The set of events characterized the diversity of the rainfall hyetographs. The 12 events for validation are coded as V1 to V12. The model performance was quantified using the coefficient of determination (R2) (Hirsch et al., 1992) and the Nash–Sutcliffe model efficiency coefficient (NSE) (Nash and Sutcliffe, 1970).
R = , ,
, ,
(1)
NSE , ,
,
whereQo,tis the observed discharge (m 3
/s) at timet,Qm,tis the modelled discharge (m 3
/s), is the average
[image:8.595.93.570.160.498.2]for the observed discharge (m3/s), and is the average for the modelled discharge (m3/s). The higher values of the two indicators represent more accurate models.
Table 2. Summary of rainfall-runoff events for simulation
event code start date end date rainfall depth (mm) duration (h:m)
V1 16/5/2005 7:10 16/5/2005 23:00 12.6 15:50
V2 31/5/2005 19:50 1/6/2005 8:30 32.2 12:40
V3 29/6/2005 17:40 29/6/2005 21:00 4.6 3:20
V4 22/7/2005 10:40 22/7/2005 17:40 12.8 7:00
V5 8/8/2005 9:00 8/8/2005 18:10 15.2 9:10
V6 28/8/2005 8:00 28/8/2005 20:30 39.2 12:30
V7 3/7/2004 10:20 3/7/2004 19:00 28.0 8:40
V8 17/8/2004 10:10 17/8/2004 17:50 16.8 7:40
V9 18/8/2004 14:30 18/8/2004 16:10 19.4 1:50
V10 21/9/2004 11:00 21/9/2004 15:50 5.0 4:50
V11 25/9/2004 2:20 25/9/2004 9:40 11.0 7:20
V12 26/9/2004 14:20 27/9/2004 2:10 21.0 11:50
E1 modeling of over 60 events during the record period for the P-R regression analysis
E2 designed rainfall pattern 1
E3 designed rainfall pattern 2
E4 designed rainfall pattern 3
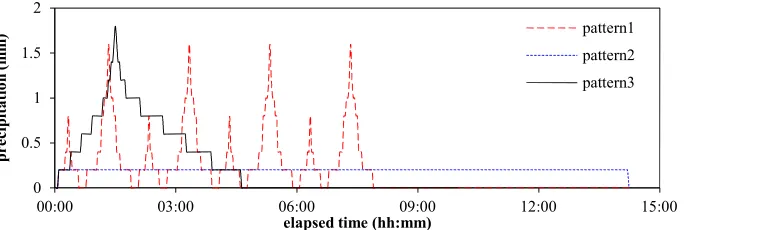
Figure 2 The three rainfall patterns with a same total depth
RESULTS
Model calibration and validation
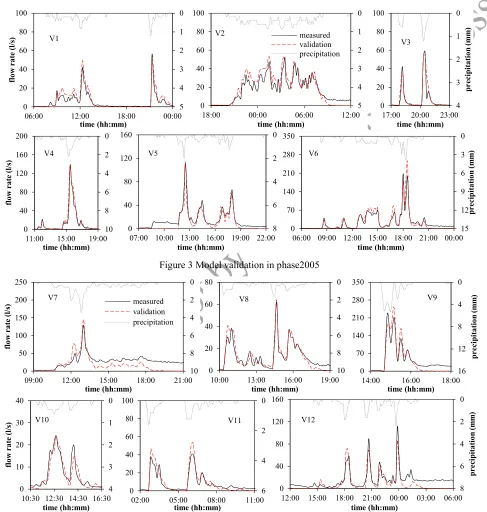
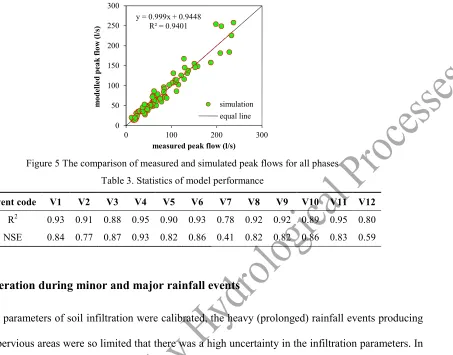
We assumed the characteristics of the catchment surfaces are not affected by urban construction. The SWMM parameterization of Guan et al. (2015b) (excluding the imperviousness) was initially used, and these parameters were then uniformly validated based on the chosen rainfall-runoff events during the three catchment development phases from 2004 to 2006. The same model parameter values were applied throughout the simulations, but the imperviousness was changed in the subcatchments in line with the impervious areas of phase 2005 and phase 2004. Figure 3 demonstrates the measured and simulated flow rates of the 6 selected events for model validation in phase2005, and Figure 4 shows the results for validation in phase2004. The modelled peak flow rates have good agreement with the measurements for both single events and sequences of events. Table 3 illustrates the values of R2 and NSE for the selected events in both phases. It can be seen that in phase2005, the smallest R2is 0.88 which implies still very high correlation, and NSE (NSE > 0.77 for all six events in phase2005) is also achieved fairly well by the model. Likewise, high R2were also obtained in the phase2004 which has the smallest land use intensity. Except V7 and V12, NSE for other events in phase2004 was shown to be larger than 0.82. The smaller values of NSE for V7 and V12 are mainly caused by the mismatch between simulations and measurements in terms of low flows after rainfall. The high stormwater runoff was still well predicted for both events. Since our main concern is on high stormwater runoff, Figure 5 plots a comparison between the modelled and measured peak flows of all the events in the three phases. A regression line with R2 of 0.94 was obtained, which indicates a good performance of the constructed model in predicting the peak flows. Despite the fact that there are some discrepancies between the simulated and measured low flows, the validation of the model in all three phases
0 0.5 1 1.5 2
00:00 03:00 06:00 09:00 12:00 15:00
p
r
e
c
ip
it
a
ti
o
n
(m
m
)
elapsed time (hh:mm)
pattern1 pattern2
demonstrates the data quality in terms of consistency between the rainfall and runoff observations and the reliability of the model in describing the hydrological behavior of the catchments with different land use intensity. Thus, the validated models can be applied to perform a further hydrological analysis in the developing urban catchment.
Figure 3 Model validation in phase2005
Figure 4 Model validation in phase2004 0 1 2 3 4 5 0 20 40 60 80 100
06:00 12:00 18:00 00:00
fl o w r a te (l /s ) time (hh:mm) 0 1 2 3 4 5 0 20 40 60 80 100
18:00 00:00 06:00 12:00
time (hh:mm) measured validation precipitation 0 1 2 3 4 0 20 40 60 80 100
17:00 20:00 23:00
p r e c ip it a ti o n (m m ) time (hh:mm) 0 2 4 6 8 10 0 40 80 120 160 200
11:00 15:00 19:00
fl o w r a te (l /s ) time (hh:mm) 0 2 4 6 8 0 40 80 120 160
07:00 10:00 13:00 16:00 19:00 22:00
time (hh:mm) 0 3 6 9 12 15 0 70 140 210 280 350
06:00 09:00 12:00 15:00 18:00 21:00 00:00
p r e c ip it a ti o n (m m ) time (hh:mm) 0 2 4 6 8 10 0 50 100 150 200 250
09:00 12:00 15:00 18:00 21:00
fl o w r a te (l /s ) time (hh:mm) measured validation precipitation 0 2 4 6 8 10 0 20 40 60 80
10:00 13:00 16:00 19:00
time (hh:mm) 0 4 8 12 16 0 70 140 210 280 350
14:00 16:00 18:00
p r e c ip it a ti o n (m m ) time (hh:mm) 0 1 2 3 4 0 10 20 30 40
10:30 12:30 14:30 16:30
fl o w r a te (l /s ) time (hh:mm) 0 2 4 6 0 20 40 60 80 100
02:00 05:00 08:00 11:00
time (hh:mm) 0 2 4 6 8 0 40 80 120 160
12:00 15:00 18:00 21:00 00:00 03:00 06:00
p r e c ip it a ti o n (m m ) time (hh:mm)
V1 V2 V3
V4 V5 V6
V7 V8 V9
Figure 5 The comparison of measured and simulated peak flows for all phases
Table 3. Statistics of model performance
Event code V1 V2 V3 V4 V5 V6 V7 V8 V9 V10 V11 V12
R2 0.93 0.91 0.88 0.95 0.90 0.93 0.78 0.92 0.92 0.89 0.95 0.80
NSE 0.84 0.77 0.87 0.93 0.82 0.86 0.41 0.82 0.82 0.86 0.83 0.59
Runoff generation during minor and major rainfall events
Although the parameters of soil infiltration were calibrated, the heavy (prolonged) rainfall events producing runoff from pervious areas were so limited that there was a high uncertainty in the infiltration parameters. In consideration of the potential uncertainty of soil infiltration, six sets of parameters (Table 4) defined by the SWMM User’s Manual (Rossman, 2010) are chosen to investigate the relationship of rainfall magnitudes and the resulting urban runoff (P-R relationship). Over 60 rainfall events with a wide range of total rainfall depths are simulated (E1 in Table 2). Figure 6(a-f) illustrates the simulated relationships for phase2006 between rainfall and runoff for minor and major rainfall events using the different sets of infiltration parameters. It indicates that a threshold exists in each case and that the slope of the rainfall-runoff regression changes at the threshold. We regard this value as the threshold for minor and major rainfall events as previously suggested by Sillanpää and Koivusalo (2014). It is shown that the threshold for minor and major rainfall events is higher in the soil with a higher infiltration coefficient; the value in phase2006 is estimated to be 39.4 mm, 36.4 mm, 30.7 mm, 19.2 mm, 17.7 mm and 17.5 mm for S1, S2, S3, S4, S5 and S6 (Table 4), respectively. The runoff produced by the minor rainfall events has a linear relationship with the event rainfall depth and the slopes of regression lines for the six scenarios differ from each other very slightly. However, the major rainfall events have a smaller R2of the regression lines (but it is still greater than 0.9). The points
y = 0.999x + 0.9448 R² = 0.9401
0 50 100 150 200 250 300
0 100 200 300
m
o
d
e
ll
e
d
p
e
a
k
fl
o
w
(l
/s
)
measured peak flow (l/s)
of P-R relationships for major events are shown to be scattered in Figure 6(d-f), which is probably caused by the different hyetograph of each selected rainfall; some are short-time high intensity storms, but others are prolonged lower intensity rainfall events. Overall, the regression relationship for major events is also shown to be approximately linear.
Table 4. Infiltration parameters for different soil types
Soil No. Soil type saturated hydraulic
conductivity (mm/h)
suction head (mm)
initial soil moisture deficit
S1 Sandy Loam 10.922 109.982 0.263
S2 Loam 3.302 88.9 0.231
S3 Silt Loam 6.604 169.926 0.217
S4 Sandy Clay Loam 1.524 219.964 0.154
S5 Clay Loam 1.016 210.058 0.154
S6 Silty Clay Loam 1.016 270.002 0.129
Figure 6 Regression analysis of rainfall and runoff for the simulated minor and major rainfall events in soil types from
S1(a) to S6 (f)
In Figure 7(a), the dashed lines represent the regression lines for major events obtained from Figure 6(a-f). These regression lines indicate that the soil with a lower infiltration capacity produces more runoff during a same major rainfall event, and the runoff difference can reach 20.1 mm for a 60 mm rainfall event, increasing by 97.8%. Since the data from high rainfall events are scarce and the shape of the hyetograph affects the model results, it is difficult to determine the exact values of the soil infiltration parameters. In
y = 0.3669x - 0.2461 R² = 0.9977 y = 0.4017x - 1.2761
R² = 0.9999
0 10 20 30 40 50 60
0 20 40 60 80 100
RE V E N T (m m )
PEVENT(mm)
minor events major events
y = 0.3687x - 0.262 R² = 0.9968 y = 0.5616x - 7.2702
R² = 0.9981
0 10 20 30 40 50 60
0 20 40 60 80 100
RE V E N T (m m )
PEVENT(mm)
minor events
major events
y = 0.3762x - 0.3013 R² = 0.9827 y = 0.6252x - 7.9477
R² = 0.9738
0 10 20 30 40 50 60
0 20 40 60 80 100
RE V E N T (m m )
PEVENT(mm)
minor events major events
y = 0.3468x - 0.131 R² = 0.993 y = 0.7309x - 7.5
R² = 0.9186
0 10 20 30 40 50 60
0 20 40 60 80 100
RE V E N T (m m )
PEVENT(mm)
minor events major events
y = 0.3471x - 0.1295 R² = 0.9924 y = 0.8203x - 8.4815
R² = 0.9314
0 10 20 30 40 50 60
0 20 40 60 80 100
RE V E N T (m m )
PEVENT(mm)
minor events
major events
y = 0.347x - 0.1295 R² = 0.9925 y = 0.8142x - 8.3154
R² = 0.9306
0 10 20 30 40 50 60
0 20 40 60 80 100
RE V E N T (m m )
PEVENT(mm)
minor events
major events
(a) S1 (b) S2 (c) S3
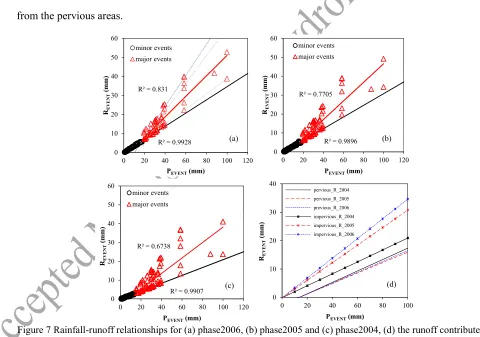
fact, each relationship in Figure 6 is likely to occur in reality. In consideration of this, all the P-R scatters for the six sets of parameters yields a regression line with a good R2(0.831). Similarly, Figure 7(b) and Figure 7(c) demonstrate the P-R relationships for minor and major rainfall events in phase2005 and phase2004. The area between the red line and the black line is the largest in phase2004, suggesting that the runoff difference between minor and major rainfall events is more distinctive in the catchment with a lower imperviousness. Figure 7(d) shows the runoff contributions separately from the impervious surfaces and the pervious surfaces during the three phases. It shows that the impervious runoff is significantly influenced by land cover changes from 2004 (22.6% IS) to 2006 (38.7% IS) and is proportional to the imperviousness. In addition, the changes in the direct impervious runoff increase linearly with rainfall magnitudes. However, the critical threshold value is hardly affected by the imperviousness. The increase of the imperviousness implies the decrease of the pervious surfaces in the catchment, thus, the urbanization leads to the reduction of the runoff contributed from the pervious areas.
Figure 7 Rainfall-runoff relationships for (a) phase2006, (b) phase2005 and (c) phase2004, (d) the runoff contributed by the impervious areas and the pervious areas
For this particular site, we conservatively treated the minimum of six scenarios (17.5 mm in rainfall depth for S6) as the threshold between minor and major rainfall events. A similar threshold was also determined in the catchment based on the analysis of rainfall-runoff data by Sillanpää and Koivusalo (2014).
R² = 0.9928 R² = 0.831
0 10 20 30 40 50 60
0 20 40 60 80 100 120
RE V E N T (m m )
PEVENT(mm)
minor events
major events
R² = 0.9896 R² = 0.7705
0 10 20 30 40 50 60
0 20 40 60 80 100 120
RE V E N T (m m )
PEVENT(mm)
minor events
major events
R² = 0.9907 R² = 0.6738
0 10 20 30 40 50 60
0 20 40 60 80 100 120
RE V E N T (m m )
PEVENT(mm)
minor events major events 0 10 20 30 40
0 20 40 60 80 100
RE V E N T (m m )
PEVENT(mm)
The events with a total rainfall depth greater than 17.5 mm are considered as major rain storms which can induce considerable amount of pervious runoff (Figure 7d). The events below the depth of 17.5 mm are regarded as minor rain storms. The value of 17.5 mm is a conservative estimate that ensures the consistency of the runoff features during minor rainfall events. For the events greater than the threshold, the runoff generation will further depend on other indicators such as rainfall intensity and duration.
Hydrological impacts of land cover change relevant to rainfall magnitudes
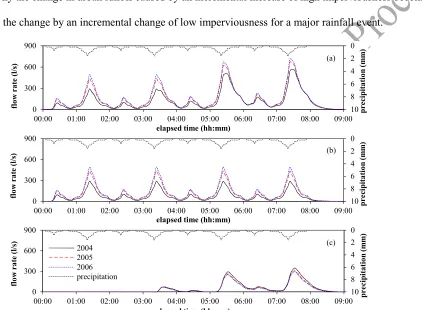
As noted above, the hydrological behavior of an urban catchment varies with event magnitude. In order to explore how hydrographs change with urbanization and how rainfall magnitudes influence the hydrological changes in an urbanized catchment, a periodic rainfall event (pattern 1 in Figure 2) was designed and simulated. This event has four consecutive rainfall periods, each of which has a rainfall depth of 21.2 mm and lasts for 110 minutes. This event was simulated using the parameterizations for the three development phases: phase2004, phase2005 and phase 2006.
value, total runoff volumes, and response time of the pervious flows are completely different from the direct impervious flows. Specifically, the pervious runoff is delayed, e.g. the last impervious peak flow occurs at 7 hours, 24 minutes, while the occurrence time of the last pervious peak flow is 7 hours, 32 minutes, with an 8 minutes delay. In contrast to the impacts of urbanization on direct impervious runoff, urban development from phase2005 to phase2006 causes a reduction of pervious runoff due to the surface construction. This elaborates why the change in urban runoff caused by an incremental increase of high imperviousness become weaker than the change by an incremental change of low imperviousness for a major rainfall event.
Figure 8 The simulated flow rates contributed from (a) the whole catchment, (b) the impervious surfaces, and (c) the
pervious surfaces in the three development phases
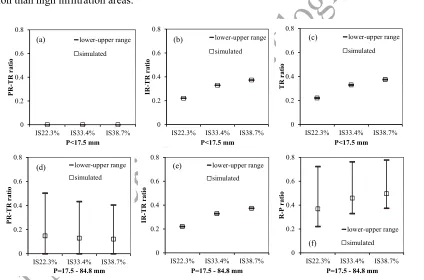
Figure 9 plots the ratio of pervious runoff-to-total rainfall (PR-TR ratio), the ratio of impervious direct runoff-to-total rainfall (IR-TR ratio), and the ratio of total runoff-to-total rainfall (TR ratio) during the minor rainfall depths (< 17.5 mm) and the major rainfall depths (17.5 - 84.8 mm) in the three development phases. It emphasizes that both minor and major rainfall events have a same impervious direct runoff ratio for the three phases (Figure 9b,e), and the ratio is proportional to the imperviousness of the urban catchment. Sillanpää (2013) reported that the ratios of the observed direct runoff to rainfall depth are smaller than the catchment imperviousness. However, the simulation shows an IR-TR ratio close to the imperviousness because the simulated evapotranspiration loss was low. Additionally, Figure 9(a,d) demonstrates that the
PR-0 2 4 6 8 10 0 300 600 900
00:00 01:00 02:00 03:00 04:00 05:00 06:00 07:00 08:00 09:00
p r e c ip it a ti o n (m m ) fl o w r a te (l /s )
elapsed time (hh:mm)
0 2 4 6 8 10 0 300 600 900
00:00 01:00 02:00 03:00 04:00 05:00 06:00 07:00 08:00 09:00 p
r e c ip it a ti o n (m m ) fl o w r a te (l /s )
elapsed time (hh:mm)
0 2 4 6 8 10 0 300 600 900
00:00 01:00 02:00 03:00 04:00 05:00 06:00 07:00 08:00 09:00 p
r e c ip it a ti o n (m m ) fl o w r a te (l /s )
elapsed time (hh:mm)
TR ratios for the major and minor rainfall events significantly differ from each other. Specifically, no runoff is generated from the pervious areas for the minor events, whereas for the major rainfall events, the pervious surfaces contribute considerable amount of runoff. Particularly, in the phase with a higher percentage of pervious area than impervious area, the pervious runoff can exceed the impervious surface runoff. The impervious direct runoff increases with the imperviousness, but the relationship is contrary for the pervious runoff. Figure 9f shows that the total runoff ratio increases due to urban development from 2004 to 2006, but the runoff contribution of pervious areas diminishes the difference due to urban development. As the pervious runoff is negatively correlated with soil infiltration, the pervious areas with lower soil infiltration yield more runoff. Thereby, the difference in storm runoff due to changing imperviousness is smaller in low infiltration than high infiltration areas.
Figure 9 Runoff-to-rainfall ratios for (a) the pervious surfaces, (b) the impervious surfaces and (c) the whole area during
the minor rainfall event (<17.5 mm), and for (d) the pervious surfaces, (e) the impervious surfaces and (f) the whole
area during the major rainfall event (17.5 - 84.8 mm) in the different development phases; note: simulated represents
the simulated results with the validated soil infiltration parameters, lower-upper range represents the simulated
minimum and maximum scenarios using the largest soil infiltration and the smallest soil infiltration.
Effects of rainfall pattern on urban runoff
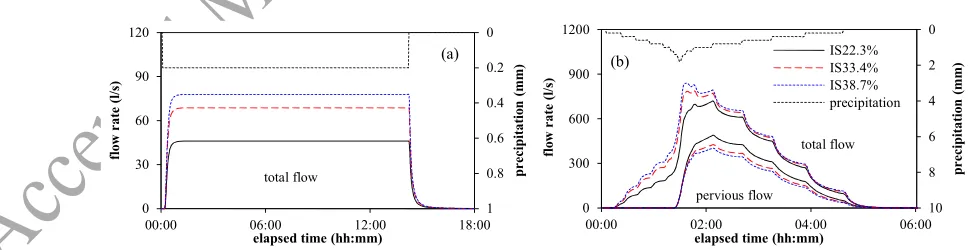
Figure 10 demonstrates the simulated flow from the whole catchment and from the pervious surfaces for rainfall patterns 2 and 3 (Figure 2) in the three development phases. For rainfall pattern 2, the total flow is
0 0.2 0.4 0.6 0.8
IS22.3% IS33.4% IS38.7%
P R -T R r at io P<17.5 mm lower-upper range simulated 0 0.2 0.4 0.6 0.8
IS22.3% IS33.4% IS38.7%
IR -T R r at io P<17.5 mm lower-upper range simulated 0 0.2 0.4 0.6 0.8
IS22.3% IS33.4% IS38.7%
T R r at io P<17.5 mm lower-upper range simulated 0 0.2 0.4 0.6 0.8
IS22.3% IS33.4% IS38.7%
P R -T R r at io
P=17.5 - 84.8 mm
lower-upper range simulated 0 0.2 0.4 0.6 0.8
IS22.3% IS33.4% IS38.7%
IR -T R r at io
P=17.5 - 84.8 mm
lower-upper range simulated 0 0.2 0.4 0.6 0.8
IS22.3% IS33.4% IS38.7%
R
-P
r
at
io
P=17.5 - 84.8 mm
lower-upper range
simulated
(a) (b) (c)
(d) (e)
directly contributed from the impervious surfaces, i.e. the pervious areas do not yield runoff even though the total rainfall depth reaches 84.8 mm which is much greater than the threshold of minor and major rainfall events estimated based on the rainfall depth of an event. For rainfall pattern 3, Figure 10(b) implies that the effects of urbanization on the total flow and the pervious flow are similar to that for pattern 1, i.e. urban development increases the total runoff, but reduces the pervious runoff. Yet, the pervious areas start to generate runoff when the total rainfall depth reaches 22.6 mm for pattern 3. The corresponding total rainfall depth that triggered pervious runoff was 37.0 mm for pattern 1 (see Figure 8). This demonstrates that the pervious runoff is not only related to the event magnitude, but also depends on the rainfall pattern. Figure 11(a) indicates that the PR-TR ratios for the three patterns differ from each other remarkably. Pattern 3 yields the largest PR-TR ratio which is more than double in comparison to that for pattern 1, and the ratio is zero for the rainfall pattern with constant low intensity (pattern 2). It is shown that the impervious runoff is not influenced by the rainfall pattern, and it is only related to the imperviousness of the catchment. The difference in the pervious runoff caused by the rainfall pattern is also represented in terms of the total runoff ratios (Figure 11c). Table 5 lists the PR-TR ratio, the IR-TR ratio, the TR ratio, and the total runoff volume for the three patterns in phase2006. Therein, the IR-TR ratios are almost the same irrelevant to the rainfall pattern, but the TR ratios and the TR ratios for the three patterns are greatly different. For example, PR-TR ratio and PR-TR ratio for pattern 3 are much larger than those for pattern 1 by an order of 2.2 and 1.3 respectively. It is clear that the soil infiltration becomes lower along with increasing rainfall intensity. Accordingly, more runoff is generated during the rainfall pattern with higher intensity (Table 5). The characteristic is the same for other development phases.
Figure 10 The simulated total flow and the pervious flow in phase2004, phase2005, phase2006: (a) rainfall pattern 2,
(b) rainfall pattern 3. Note that there is no pervious flow for rainfall pattern 2.
0 0.2 0.4 0.6 0.8 1 0 30 60 90 120
00:00 06:00 12:00 18:00
p r e c ip it at io n (m m ) fl o w r at e (l /s )
elapsed time (hh:mm)
0 2 4 6 8 10 0 300 600 900 1200
00:00 02:00 04:00 06:00
p r e c ip it at io n (m m ) fl o w r at e (l /s )
elapsed time (hh:mm)
Figure 11 The simulated direct runoff ratio for the three rainfall patterns (a) the ratio of the pervious runoff to the total
rainfall, (b) the ratio of the impervious runoff to the total rainfall, and (c) the ratio of the total runoff to the total rainfall.
Table 5. Runoff ratios for the three patterns and the total runoff volume in the development phase IS38.7%
rainfall pattern PR-TR ratio IR-TR ratio TR ratio total runoff
volume (×103m3)
pattern 1 0.12 0.37 0.49 5.15
pattern 2 0 0.38 0.38 3.94
pattern 3 0.26 0.38 0.64 6.59
DISCUSSION
The earlier studies about the contribution of pervious surfaces to urban runoff have provided controversial results (Boydet al., 1993; Booth and Jackson, 1997; Price et al., 2010): some studies showed insignificant contribution of pervious areas, yet other results were opposite. It has been reported that rainfall depth is considered to be a key factor influencing the contribution of pervious areas to urban runoff and a threshold depth exist in a specific urban catchment (Burton and Pitt, 2002; Said and Downing, 2010; Sillanpää and Koivusalo, 2014). In this study, we demonstrated and quantified how the hydrological behavior in pervious areas depends on soil infiltration and rainfall magnitudes. The results show that the regression relationship of rainfall and runoff in a periurban catchment is different for minor rainfall events and major rainfall events, and an event size threshold can be identified. Previously, Sillanpää and Koivusalo (2014b) reported precipitation thresholds within a range of 17-20 mm for three urban catchments with different development densities but with rather similar soil types. In this study, we demonstrated that this threshold is closely related to the soil infiltration parameters in the studied catchment. In soil with a smaller infiltration coefficient, the infiltration loss is reduced, therefore resulting in a smaller threshold. Conversely, the threshold is larger for the soil with the higher infiltrability. For example, the thresholds greater than 35 mm were calculated for the high infiltration parameters S1-S2 in SWMM (Table 4). However, such high
0.0 0.1 0.2 0.3 0.4 0.5
IS22.3% IS33.4% IS38.7%
P
R
-T
R
r
at
io
year
0.0 0.1 0.2 0.3 0.4 0.5
IS22.3% IS33.4% IS38.7%
IR
-T
R
r
at
io
year
pattern1 pattern2 pattern3
0.0 0.2 0.4 0.6 0.8
IS22.3% IS33.4% IS38.7%
T
R
r
at
io
year
thresholds may unlikely occur in the studied urban setting, because the soil infiltrability of pervious areas is reduced due to the topsoil removal and the compaction in comparison to the rural conditions (Gregoryet al., 2006; Pitt et al., 2008; Woltemade, 2010). In the study site, the overall rainfall-runoff regression line for major rainfall events is shown to be linear but with a smaller R2=0.83. The slope of P-R regression line for major rainfall events can be up to two times higher than the slope for minor rainfall events. Figure 7 shows that runoff from impervious areas is increased significantly due to land cover changes from 2004 (22.3%) to 2006 (38.7%), and the changes are increased linearly with rainfall magnitudes. However, the threshold of minor and major rainfall events is hardly affected by the land cover change. Lee and Heaney (2003) pointed out that it is necessary to determine a lower threshold of storms. In the developing urban catchment, the threshold between minor and major events is conservatively determined to be 17.5 mm of rainfall depth based on the regression analysis of various magnitudes of rainfall and runoff. For the major rain storms greater than 17.5 mm, pervious areas contribute considerable amount of runoff (Figure 7d), and the contribution is more for the phase with the lower imperviousness. Thus, the runoff difference between minor and major rainfall events tends to diminish with the increase of land use intensity. During the minor rain storms smaller than 17.5 mm, the total runoff is mostly contributed from impervious areas. This expounds why runoff and rainfall show a stable linear relationship for minor rainfall events. The question of pervious area contribution to urban runoff must therefore be separately considered for the minor rainfall events and the major rainfall events. As no runoff is generated from pervious areas during minor rainfall events, the contribution of pervious areas to urban runoff would be insignificant. Nonetheless, during major rainfall events the pervious areas in a periurban catchment greatly contribute to the total runoff. This is also the reason why the runoff-rainfall regression relationship is different for minor and major rainfall events.
we did not find runoff production from pervious surfaces, yet pervious areas yield considerable amount of runoff during major rainfall events. Although runoff coefficient per unit pervious area is smaller than that per unit impervious area, the existence of large pervious areas within the catchment can still generate even more runoff than the impervious surfaces. Also, the contribution of pervious surfaces to the total runoff diminishes the runoff difference caused by urban development during major rainfall events.
For instance, the thresholds greatly differ from each other during the studied different rainfall patterns. In consideration of the effects of rainfall pattern on runoff, a conservative smaller estimate would be more reasonable for the threshold of minor and major rainfall events.
there might be some errors in quantifying the runoff volume and response time of the largest events. Despite the quality assurance, the datasets of rainfall and flow rates have inherent uncertainty due to the random and systematic errors associated with the measurement device although the large number of available events decreases the uncertainties.
Wider implication of results
Urban development continuously occurs in Finland and worldwide. Sustainable urban drainage systems are becoming increasingly important for urban stormwater and flood management. This requires greater understanding about the hydrological behavior of developing catchments as a scientific basis of the design guideline. This study emphasized the hydrological responses during different land cover changes and rainfall patterns and event magnitudes. Different rainfalls should be treated differently for distinct stormwater and flood management purposes. Guidelines suggesting different design events for different design purposes already exist e.g. in stormwater manuals for different states in the U.S.(Sillanpää, 2013), but in many countries, such as in Finland, these guidelines are seemingly arbitrary or borrowed from other locations without clear reasoning based on the local hydrology. Particularly in climates where rainfall is dominated by frequently occurring small storms, the identified threshold in this study for minor and major events aids classifying storms based on a clear hydrological principle. The threshold can be used in formulating management objectives for each classification, e.g. the restoration of the predevelopment hydrology, water quality protection, erosion control and flood control. The direct runoff response to frequent minor storms is the most strongly affected by urbanization (e.g. Sillanpää and Koivusalo, 2015) and, as we showed in the current study, the magnitude of direct storm runoff during small storms is rather insensitive to the temporal rainfall pattern and more related to the impervious surfaces in urban catchment, but less to pervious area. On the basis of these results, it is suggested that by addressing impervious runoff appropriately the changes in predevelopment hydrology can be minimized cost-efficiently during frequently occurring storms although the full restoration of predevelopment hydrology seems a rather cumbersome task (Guanet al., 2015a).
results show that a major storm with short-time but high intensity can cause much more storm runoff and it is more possible to induce urban flooding in comparison to a constant rainfall of long duration and the same depth. Hence, in stormwater modelling for practical purposes of urban flood control, the temporal distribution of design storms should be carefully determined e.g. for finding the worst case scenario for a particular location. The results raise the awareness to various storm runoff responses and provide a hydrological support for sustainable urban stormwater/flood management. Although the study was based on a specific catchment, the method could be widely used or extended to any other developing urban catchment. Additionally, the uncertainty related to finding suitable soil parameters for the study catchment from the large range of possible values underlines the great uncertainties involved in real life urban runoff management design, when e.g. biofiltration or infiltration systems are planned and modelled for ungauged urban catchments.
CONCLUSION
This study investigated the combined effects of land cover changes, rainfall patterns and event magnitudes on stormwater runoff using the stormwater management model (SWMM). The contribution of pervious surfaces was emphasized in a small developing catchment. The model was globally parameterized, calibrated and validated in three development phases of the urban catchment: phase2004, phase2005 and phase2006. Various recorded events and three artificial events were then simulated by the validated model. From the results and discussion, the following conclusions are drawn out:
(1) A threshold for minor and major rainfall events exists in an urban catchment, and minor and major events yield distinct P-R relationships. For minor events, rainfall and runoff has a linear relationship which is not affected by soil infiltration. However, the rainfall-runoff regression line for major rainfall events has a clearly steeper slope than that for minor events.
(3) The direct impervious runoff is significantly influenced by land cover changes, and it is increased with the increase of imperviousness, but the pervious runoff is conversely reduced.
(4) During major rainfall events the pervious runoff diminishes the change in urban runoff due to urbanization.
(5) The response time of pervious runoff is notably longer compared to that of the impervious surface runoff during high intensity rainfalls.
(6) Among the major rainfall events, prolonged events with unvarying low intensity yield the smallest peak flow and the smallest total urban runoff, whereas urban runoff is considerably increased during rainfall events with high peak intensity.
ACKNOWLEDGEMENT
This work was funded by Aalto University School of Engineering and the European Regional Development Fund (Urban laboratory for sustainable built environment). The authors thank Helsinki Region Environmental Services Authority HSY for the GIS data received for model calibration.
REFERENCES
Ando Y, Musiake K, Takahasi Y. 1984. Modelling of hydrologic processes in a small urbanized hillslope basin with
comments on the effects of urbanization. Journal of Hydrology,68: 61-83. DOI:
http://dx.doi.org/10.1016/0022-1694(84)90204-X.
Assouline S, Mualem Y. 1997. Modeling the dynamics of seal formation and its effect on infiltration as related to soil
and rainfall characteristics. Water Resources Research,33: 1527-1536. DOI: 10.1029/96WR02674.
Booth DB, Jackson CR. 1997. Urbanization of aquatic systems: degradation thresholds, stormwater detection, and the
limits of mitigation. JAWRA Journal of the American Water Resources Association,33: 1077-1090. DOI:
10.1111/j.1752-1688.1997.tb04126.x.
Boyd MJ, Bufill MC, Knee RM. 1993. Pervious and impervious runoff in urban catchments. Hydrological Sciences
Journal,38: 463-478. DOI: 10.1080/02626669309492699.
Burns D, Vitvar T, McDonnell J, Hassett J, Duncan J, Kendall C. 2005. Effects of suburban development on runoff
generation in the Croton River basin, New York, USA. Journal of Hydrology,311: 266-281. DOI:
Burton GA, Pitt RE. 2002. Stormwater effects handbook: A toolbox for watershed managers, scientists, and engineers.
CRC Press LLC.
Cheng S-j, Wang R-y. 2002. An approach for evaluating the hydrological effects of urbanization and its application.
Hydrological Processes,16: 1403-1418. DOI: 10.1002/hyp.350.
Denault C, Millar RG, Lence BJ. 2006. Assessment of possible impacts of climate change in an urban catchment.
JAWRA Journal of the American Water Resources Association,42: 685-697. DOI:
10.1111/j.1752-1688.2006.tb04485.x.
Dietz ME, Clausen JC. 2008. Stormwater runoff and export changes with development in a traditional and low impact
subdivision. Journal of Environmental Management,87: 560-566. DOI:
http://dx.doi.org/10.1016/j.jenvman.2007.03.026.
Dotto CBS, Kleidorfer M, Deletic A, Rauch W, McCarthy DT. 2014. Impacts of measured data uncertainty on urban
stormwater models. Journal of Hydrology,508: 28-42. DOI: 10.1016/j.jhydrol.2013.10.025.
Dunkerley D. 2012. Effects of rainfall intensity fluctuations on infiltration and runoff: rainfall simulation on dryland
soils, Fowlers Gap, Australia. Hydrological Processes,26: 2211-2224. DOI: 10.1002/hyp.8317.
Feyen L, Vrugt JA, Nualláin BÓ, van der Knijff J, De Roo A. 2007. Parameter optimisation and uncertainty assessment
for large-scale streamflow simulation with the LISFLOOD model. Journal of Hydrology,332: 276-289. DOI:
10.1016/j.jhydrol.2006.07.004.
FMI FMI. 2014. Rainfall records available at:http://ilmatieteenlaitos.fi/sade-ennatyksia.
Gregory JH, Dukes MD, Jones PH, Miller GL. 2006. Effect of urban soil compaction on infiltration rate. Journal of Soil
and Water Conservation,61: 117-124.
Guan M, Sillanpää N, Koivusalo H. 2015a. Assessment of LID practices for restoring pre-development runoff regime in
an urbanized catchment in southern Finland. Water Science & Technology,71: 1485 - 1491. DOI:
doi:10.2166/wst.2015.129.
Guan M, Sillanpää N, Koivusalo H. 2015b. Modelling and assessment of hydrological changes in a developing urban
catchment. Hydrological Processes,29: 2880-2894. DOI: 10.1002/hyp.10410.
Hawke RM, Price AG, Bryan RB. 2006. The effect of initial soil water content and rainfall intensity on near-surface
soil hydrologic conductivity: A laboratory investigation. CATENA,65: 237-246. DOI:
http://dx.doi.org/10.1016/j.catena.2005.11.013.
Hirsch RM, Helsel DR, Cohn TA, Gilroy EJ. 1992. Statistical analysis of hydrologic data. In: Handbook of Hydrology,
Jang S, Cho M, Yoon J, Yoon Y, Kim S, Kim G, Kim L, Aksoy H. 2007. Using SWMM as a tool for hydrologic impact
assessment. Desalination,212: 344-356. DOI: 10.1016/j.desal.2007.05.005.
Krebs G, Kokkonen T, Valtanen M, Setälä H, Koivusalo H. 2014. Spatial resolution considerations for urban
hydrological modelling. Journal of Hydrology,512: 482-497. DOI: 10.1016/j.jhydrol.2014.03.013.
Kuusisto E. 1980. On the intensity of rainfall in Finland. Aqua Fennica,10: 3-11.
Lee J, Heaney J. 2003. Estimation of Urban Imperviousness and its Impacts on Storm Water Systems. Journal of Water
Resources Planning and Management,129: 419-426. DOI: doi:10.1061/(ASCE)0733-9496(2003)129:5(419).
Meierdiercks KL, Smith JA, Baeck ML, Miller AJ. 2010. Analyses of Urban Drainage Network Structure and its
Impact on Hydrologic Response1. JAWRA Journal of the American Water Resources Association,46: 932-943.
DOI: 10.1111/j.1752-1688.2010.00465.x.
Nash JE, Sutcliffe JV. 1970. River flow forecasting through conceptual models part I — A discussion of principles.
Journal of Hydrology,10: 282-290. DOI:http://dx.doi.org/10.1016/0022-1694(70)90255-6.
Pellerin BA, Wollheim WM, Feng X, Vörösmarty CJ. 2008. The application of electrical conductivity as a tracer for
hydrograph separation in urban catchments. Hydrological Processes,22: 1810-1818. DOI: 10.1002/hyp.6786.
Pitt R, Chen SE, Clark SE, Swenson J, Ong CK. 2008. Compaction's impacts on urban storm-water infiltration. Journal
of Irrigation and Drainage Engineering-Asce,134: 652-658. DOI: 10.1061/(asce)0733-9437(2008)134:5(652).
Price K, Jackson CR, Parker AJ. 2010. Variation of surficial soil hydraulic properties across land uses in the southern
Blue Ridge Mountains, North Carolina, USA. Journal of Hydrology,383: 256-268. DOI:
http://dx.doi.org/10.1016/j.jhydrol.2009.12.041.
Rossman. 2010. Storm Water Management Model User’s Manual Version 5.0. US EPA National Risk Management
Research Laboratory.
Said A, Downing H. 2010. Estimating connected impervious areas as function of rainfall depth. In: AWRA 2010 Spring
Specialty Conference.
Shuster WD, Bonta J, Thurston H, Warnemuende E, Smith DR. 2005. Impacts of impervious surface on watershed
hydrology: A review. Urban Water Journal,2: 263-275. DOI: 10.1080/15730620500386529.
Sillanpää N. 2013. Effects of suburban development on runoff generation and water quality. In: Deaprtment of Civil
and Environmental Engineering, Aalto University, pp: 240.
Sillanpää N, Koivusalo H. 2014. Impacts of urbanization and event magnitude on runoff contributing area and runoff
Sillanpää N, Koivusalo H. 2015. Impacts of urban development on runoff event characteristics and unit hydrographs
across warm and cold seasons in high latitudes. Journal of Hydrology,521: 328-340. DOI:
http://dx.doi.org/10.1016/j.jhydrol.2014.12.008.
Smith RE. 1972. The infiltration envelope: Results from a theoretical infiltrometer. Journal of Hydrology,17: 1-22.
DOI:http://dx.doi.org/10.1016/0022-1694(72)90063-7.
Valtanen M, Sillanpää N, Setälä H. 2014. Effects of land use intensity on stormwater runoff and its temporal occurrence
in cold climates. Hydrological Processes,28: 2639-2650. DOI: 10.1002/hyp.9819.
Woltemade CJ. 2010. Impact of Residential Soil Disturbance on Infiltration Rate and Stormwater Runoff1. JAWRA
Journal of the American Water Resources Association,46: 700-711. DOI: 10.1111/j.1752-1688.2010.00442.x.
Xue J, Gavin K. 2008. Effect of Rainfall Intensity on Infiltration into Partly Saturated Slopes. Geotech Geol Eng,26: