MARCH 1990
COMMISSION OF THE EUROPEAN COMMUNITIES
***
*
*
*
*
*
*
***
EUROBAROMETER
THE PERCEPTION OF POVERTY IN EUROPE
POVERTY 3
COMMUNITY PROGRAMME TO FOSTER ECONOMIC AND
SOCIAL INTEGRATION OF THE LEAST PRIVILEGED GROUPS.
V/467/90-EN
This survey was conducted upon request . made by Directorate
.
.
General for_ Employment, Industrial_ Relations and S~cial Affairs , of the Coinm.ission of Europe~ Economic Community.
. . ~ . .
· It was conducted in the 12 member- countries of the European · Community. The same questionnaire was· circulated in June/July
- .
1989 among a sample representative of the population - 15 and· older -. i.e. a total of 11,819 persons._ The survey was conducted J>y polling institutes members~ of the European Omnibus ·Survey, and Faits et .. Opiirions acted as general coordinator.
The liability of the . Commission of European ·Communities is, in- no way, committed by this report drafted by · Domiillque
Bonnafe.
0,5
How do Europeans sense poverty? Do they meet paupers in their daily lives? Which ..
explanations are proposed for the problem? These are some of the que'stions to which a
. . I , . .
survey conducted within· the framework of the Eurobarometer for the 1?89. summer is
_trying to provide an answer. Any attempt at inventorying poverty or at d~fining a poverty
line was ruled. out of our investigation scope.
A first fact should .be acki:towledged: in the . general public's opinion, there_ is a·
consensus on what is absolutely necessary to lead
a
proper life in a European country in1989. OVer a set of criteria defining the standard of living (housing, welfare, car,
holidays, ... ),_ .the .surveyed persons were t~ establish a distinction between what is
indispensable and_ what is less necessary. A consensus · (8 persons out o_f .10) ~merges as to the following four criteria:· basic home facilities (tap water, electricity, ... ), welfare,_
housing and education. It should be noted that these parameters making up ail acceptable
. minimum standard Of living lie in the material field (home facilities and housing) as well
as i~ the area of social_ rights acknowledged
i?
the person's country (welfare, ed~ca~ion).,It then appears that poverty visibility greatly varies from one country to the other:
i
n
d
e
X
EEC average
LUX UK D
POVERTY VISffiiLITY PER COUNTRY
DK NL
index value:
1
=
risk of poverty2 = poverty
3
=
extreme povertyE lRL B F
1,08.
Such diversity is all the more important as it conditions all opinions and representations of poverty. Two categories of Europeans show a more acute response to · the issue: on the one· hand, rather underprivileged categories in terms of income and education, who meet paupers in their daily lives, and, on .the other hand, categories having. a higher level of education, who ·get involved, who feel more concerned by the risk of poverty but who do not have more opportunities to meet paupers than the average · European population. Poverty . is more visible in large cities than in villages where .
traditional solidarity and wont of lesser development probably lead to a lesser identification to poverty circumstances. Throughout the EEC, only one indiVidual out of five claims to have had a chance to see in person ·under which conditions_ the paupers actually live.
The best accepted explanations to poverty have shown dramatic changes since 1976: upon comparison, it appears that people show less support to the idea that poverty is. a co~sequence of laziness and unwiliingness, all the more as this idea was firmly ro?ted in the concerned country (in 1976, 43 % of the British arid 30 % ·of the Irish were of such opinion; in 1989, there only remains 18 % in the United Kingdom and 14 % in Ireland). According to one European out· of three, po~erty is the result of social injustice. For another _third of the surveyed sample, this is due to fate·, misfortune, or to the inherent structure of the modern world.
·"Why; in your opinion, are there people' who live in need? Here are four. opinions, which · . is the closest to yours?
*
because they have been unlucky .*
because of laziness and lack of willpower*
because there is much injustice in our society·*
it is an inevitable part of modern progress1976 1989 .16
25
26
14
18 17.
32
17
consider that one -is "poor forever" or "poor from generation to generation". Questions
. .
asked· about the social path of the sur\reyed · persons· showed a high social mobility: o~y 5 % of our sample think that the standard of living has remained the same between their
· fathers' generation, their_ own and their children's. Conversely, one out of two thinks that the situation has-- much improved from on~ generation to-- the other. This widely _spread feeling of high _mobility from generation· to .generation goes against the opinion that there is less mobility within a ·man's life, particularly a pom: man's life. ·A majority of Europeans
. . .:_ . . '
.therefore considers that the gap between the poor and the wealthy is growing wider while opinions differ as to the ~paupers' chances to make it:· on- the whole, the general public · in Europe has been; on this issue, remarkably stable (in 1976 as well as in 1989~ one
- person out of two thinks that the poor have a chance to make it). However~ there is now more pessimism in three countries: the United Kfugdom,- I~eland and Denm:ark.
Vi~ws expressed by those polled on the measures taken by the_ public authorities and -their- Vision of the -policy conducted by the EEC are severe: seven persons out of ten consider . that the
me~ns
.. made available) are insufficient . while thecategorie~
. inore..._ ' . .
concerned by the issue are ev~n more. reproving .. Besides, people are riot well acquainted witp the EEC action
(~nly
one person out of -three is aware of it), and, when they are, _ they also. consider it is inadequate. ·TABLE OF CON'I'ENI'S
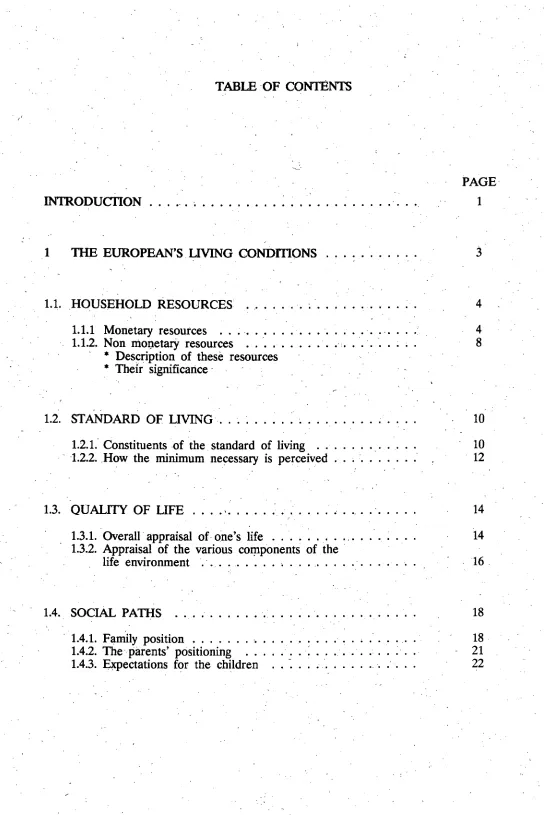
INTRODUCTION
. . .
..
.
-.. . .
.
. .
.
. ..
PAGE
1
1 THE EUROPEAN'S UVING CONDmONS 3
1.1. HOUSEHOLD RESOURCES
.
-·
. .
. . .
. . . .
~. . .
. .
.. 41.1.1 Monetary resources . . . . . _. . . . . . . . . • 4
1.1.2. Non mo~etary resources . . . ·. · . . . ~ . 8
· *
Description of these resources * Their significance -. . . . 1.2. STANDARD OF LIVING . . . ~ . . . ~ . . . ; . . . . 101.2.L Constituents of the standard of living . . . 10
·. 1.2.2. _How the minimum necessary is perceived . . ~ . . . : 12
1.3. QUALITY OF UFE
. . . .
'.. . .
.
.
. .
,;.
·-
.
. . .
.
. .
14- - -1.3.1. Overall· appraisal of- one's life . . . : . . . 14
1.3.2. Appraisal of the various co~ponents of the life environment . . . • . . . ·. . . 16 .
1.4. SOCIAL PATHS
...
18- 1.4.1. Family position . . . -. . . ~ . . . • :. . . . . 18
1.4.2. The parents' positioning . . . : . . . 21
[image:7.570.14.558.0.815.2]HOW POVERTY CONDIDONS ARE PERCEIVED
2.1. COMING ACROSS POVERTY . . . 24
2.1.1. Presence of paupers in the neighborhood . . . 24
2.1.2. Actual knowledge of poverty conditions . . . . , . . . 29
. 31 2.1.3. Duration of poverty circumstances . . . . 2.1.4. How the change is perceived . . . ,. . . 33
2.2. EXPLANATIONS TO POVERTY . . . :. . . . . . . 35
2.2.1. The grounds of poverty . . . 36
2.2.2. Grounds for poverty connected to the overall economic environment . . . 40
2.3. THE ·FATE OF POOR PEOPLE
. . .
..
.
. . .
.
. .
. . . .
432.3.1. General opinion on the course taken by society· . . . . : . 43
2.3.2. The paupers' chances to make it through . . . 47
2.33. Expectations .for the paupers' children .... ~· . . . . . 51
3. MEANS AVAll.ABLE IN THE ·SfRUGGLE AGAINST POVERTY . . . 53
3.1. INDIVIDUAL ACTION . . . ·. . . 54
[image:8.573.24.544.13.815.2]3.1.1. Money donations 3.1.2. Dedicating time . . .
...
.
. .
. . .
. .
. .
.
. . .
.
.
.
. . .
3.2. MEASURES TAKEN BY THE PUBLIC AUTHORillES : .. 3.2.1. Is the ininimum income known? . . . . 3.2.2. Appraisal of the measures taken by ·the domestic public authorities . . . . 3.2.3. Are the measures taken by the E ,· . . k ? . . uropean InstitutiOns nown. . . . 3.2.4. Opinions on this policy . . . . TECHNICAL APPENDICES...
: 54 56 60 . 60 62 65 65 67A.l.
Paupers are underrepresented in the samples for opinion polls . . . . · . . . 68A.2. Leadership indicator . . . 69
A3. Monetary resources . . . 71
B. Table of results per country . . . . ·. . . 73
1_:
,'-INTRODUCTION
THE P:ERCEPTION OF POVERTY
INEUROPE IN 1989
A large part of -the Eurobarometer . polled over the 1989 summer dealt with poverty - connected issues: how do Europeans perceive poverty? Do they meet paupers in their daily. life? What are the most widely spread opinions on the existence of poverty?
(1)
First of_ all, we would like to stress the fact that the data reported in this document
wer~
obtained in a survey and 'that this~ethodology
has inherent limitations: this isi~
no way intended to inventory poverty in Europe. The paupers, the misfits are de facto excluded from the representative samples· used in the polling method (see technical appendix A).· .We did not mean to seek a. definition for poverty or a poverty line either.
Our sole ambition Is to give ~n account of the Europeans'/. opinions and representations on ·the paupers: does or doesn't the general public agree ·on who the · paupers are a_ European country in 1989, on what is necessary to lead a proper life? How· · do people feel about the changing number of-paupers? Which explanations, to p'overty are
acknowledged,?
(1) · This the. second opinion poll conducted on this ·issue within the framework of the Eurobarometer: the first ·survey was conducted in 1976. There ·are few subjects ·of comparison. as a result of three modified factors: a change in the terminology (the word "poverty" replaced that of "destitution" which was rather used in the questions · asked in 1976), differences in the metric for answer collection (a 10 =-point scale
replacing a 4
The word "poverty" covers a wide .range of variable- geometry realities depending on· the country and the date. Dipping its roots in confirmable facts, it also has ·a subjective dimension. Based on this, we tried to grasp the Europeans' living conditions in terms of income but also of sociability, satisfaction, a<;cess to welfare so as to · figure out what seems to be the minimum acceptable in the general public's opinion. We also reckoned more subjective items such as the claim of being poor or rich, or statements on the social path of one's own family. · : . . · . · _
In the second section of this report, opinions on poverty (how the developments in the number of paupers are perceived, acknowledged grounds to the phenomenon, ... ) are paralleled with the usual social and demographic factors (income level, education, ... ) but also with more specific data such as the presence of paupers in the daily environment or how one sees on~'s own position on the poverty s~le. ·
Lastly, the range of possible actions is ·examined, regarding the struggle against · po~erty, personal involvement, measures taken by the public authorities, by the European
institutions.
. .
In order to outline the· framework of our survey, and prior to conducting an in -depth. analysis of opinions on poverty, let us_ check how if is -positioned ampng. major
social issues: ·
Question: Here is a list of problems. I would like you to tell me, for each one, if you personally consider it very important, important, of little importance or not important at 'all?.(*)
The protection of nature and the struggle against pollution . . . . The fight ·against unemployment . .
The fight against poverty . . . . . . . . . . Problem of energy supplies . . . .
Reduce the differences between the regions of our country by helping those regions less developed or in difficulties . . . .
Help the poor countries of Africa, ·South America, Asia . . . .
3.77 3.72 3.59 3.47
3.28
3.06
The struggle against poverty is therefore of utmost importance to Europeans. It may rank third, after the environment and unemployment, but it should be . noted that one of ·the widely acknowledged grounds to poverty is unemployment over an extended period
of time.
SECTION 1
. So as to describe the Europeans' living conditions objective items~ such as the resources available, possession of some consumer goods, access to some services, were ·
taken into account together with more subjective and psychological data such as how one senses one's social standing or the degree of satisfaction in relation to one's own· life.
1.1. HOUSEHOLD RESOURCES
They include monetary resources, incomes, and non monetary resources.
There were also questions on non monetary resources: such was not the case in the first survey conducted in 1976.
1.1.1. Monetary Resources
i .
The data on income levels were obtained through the following question:
Question:
We
would like to analyze the survey results according to the income of persons interviewed. Hereis
a scale of incomes and we would like to know in what group your familyis
counting all wages, salaries, pensions, and any other income·that comes in? . .
It should immediately be specified that one person out of five refuses to answer that question.
The answers on resources were~ meant at household level; it so happens that there are considerable differences in what makes up· this basic unit. from one country to
5
-. . .
At all events, this question on· income provides an order of magnitude and
it is extremely useful in analyzing the answers to. other questions.
Before dealing with· the. various aspects of 'the standard. of living, a more
. general question ~as designed so th~t people could express their f~eling as to having or
-not having to impose restrictions upon themselves.
80
?0
80
50
40
30
20 ·. 10
0
.
-Question: Some people ·haven't sufficient income and constantly have to cut ·baek on what
they spend. Does· this apply to you? ·
Yes . . . .
...
. .No . . . . · .. .
? . . . .
...
·TOTAL . . .
E.E.C 1989
35
59
6
100
-One European out of . three considers: that his/her income is insufficient:.
behind this ·average proportion there actually are highly contrasted realities.· More than one
Irish person out of tWo, four Greeks, Portuguese and British out of ten Classify themselves
as
s~~h.
Uponcompariso~
with theanswe~s
obtained in the 1976 survey, the changes show variances:B
"MUST IMPOSE RESTRICTIONS UPON TIIEMSELVES": ' . - .
OK 0
COMPARISON BY COUNTRY
1976/1989
0 1976
Women impose more restrictions upon themselves than men do. The age ,factor has no impact in this case. Conversely, there are obvious connections with the education level, the income level, the relationship to post- materialistic values (1) and . with thepolitical stand (2)
(1) The scale of so- called "materialistic"
I
"post- materialistic" values which has been commonly used for twenty years in analyzing public opinion data measures the preference expressed by the surveyed persons in a situation of forced choice, either for values of subsistence and material security ( eg.: "preserving the order", "curbing the rise in prices"), or for values related to the feeling that one belongs, to personal fulfillment and to quality in one's life (eg.: "increasing the citizens' partaking in the decision- making process", "guaranteeing the freedom of speech"). (2) · Political standQuestion: In political matters, people talk of the '7eft and the right'~ How would you place your views on this scale? (Scale ranging from 1 to 10)
Structure: .
In each country, respondents were distributed among three categories: left, center and right.
Left Center Right NOfNA
Country:
Belgium .
...
..,·,.
.
.
) Denmark.
. .
. .
. . .
) Germany'- . . . ')Luxembourg
.
.
. . . .
) . 1,2,3,4 . 5,6 7,8,9,10NA
Netherlands J
)
. .
.
.
.
.
United Kingdom
.
-.
.
)Greece
. .
.
. . . .
. .
) Portugal. . .
)'
France
. . .
. .
.
.
) 1,2,3,4 5 6,7,8,9,10NA
Italy
... .
.
. . '. . .
.
)Ireland · .
.
. . .
.
.
) 1,2,3,4,5 6,7 .8,9,10NA
7
-/
Must impose restrictions upon:- themselves
Yes No NA Total
Sex:.._,
Male
-33
61
6
100
Female·
38
56
. .6
100
Education level: ·
Low
40-
53,.-
7
100 .·'
Average -
33
62
5
-100'
High
29
66
'5
100
Income level:
-
·-
57
37
6
100
41
52
T100
+
30
65
5
100
++
20
77
3 '
100
Post- materialism index:
Materialistic
34
61
5
100
Mixed
35
61-
4
100
Post - materialistic
41
48
11100
- ·,
',
· Political stand:
Left
-40
55
5
JOOCenter
34
61
.5100
Right
33
62
5100
.
,·I
- '
-~;
-I
1.1.2. Non Monetary Resources
This is examined separately in that it was not possible to express the impact of non monetary r~sources using common currency.
Question: In your household do you enjoy
any
benefitsapart
from money income: for . example, rent free accommodation, goods or services as benefits in kind, products provided in· the coiUse of work or business, or other things? (IF YES) which ones?E.E.C.
1989
Rent· free accommodati'on
.
... . . .
..
.. . .
~.
.
. .
.
.
7. Produce of family farming . . . 5
Products or other goods in the course of work business . 2 Free produce (for instance work clothes supplied by employer, free electricity or coal, etc.) .. ,• . . . ~ . 1
·Other than monetary benefits (SPECIFY) · . . . 2
. No benefits other than .money income ·. . . 80
? .. . . . ~ . . . .. ·• . . . 5
TOTAL (1)
It should first be noted that incomes are, to an extremely large extent, monetary. This majority is a little less numerous in Greece or in Portugal owing to ~elf
consumption
of
agricultural produces, and, in Italy, as. official residences are much more~frequent. To those who had non monetary resources, the following question on their amount was asked:
Question: If you think of the extras above other than cash income, would you say that they play a very important, quite important, not · very important or not at all important role in your present standard of living?
._ 9 - ·
In the table below, the countries are classified in decreasing· order for the share of non monetary resources (1):
. '
I o
Portugal Ireland Greece
• • • • • • • i ' • • • • • • • •
Italy ... ·· . . . :
United Kingdom·
·Germany . . . · .. ; . . . .
...
. France · ..Belgium ..
. . . ..
•. .
.Spain -. · ... ·. · ... .
Denmark .. · . . . .
.
-~.
. .
.
. .
. . .
Luxembourg . . . . . .
Netherlands ·
...
·.
2.55'
2.40
2.23 2.20
2.12 r2.07 ·
2.07 . 2.02 1.67 1.56 1.51 ·1.51
. The relation which seems to emerge in this order between the· amount of non monetary resources and the country's wealth is confirmed, at individual level, by the· relation with the income level:
Amount of .non monetary resources:
Index value
Household incomes
2.29 2.19
'' +
++ '
NA
2.10 1.95 2.02
Indeed,. the higher the monetary income, the smaller the importance granted to other· resources.
( 1) This index is computed by assigning the fo.llowing coefficients:·
3
=
extremely important,.
2
=
relatively important, 1=
not important at all.1.2 STANDARD OF I1VING
A list of items including consumer goods, services, access to welfare was drawn up so as to reckon the various ·aspects of poverty. This list is used in this document within a dual prospect: on the ·one hand, identifying the goods or services which some Europeans · do not have and, on the other hand, trying to define -=- if possible - the constituents
of a minimum s~ndard of living, acceptable in the general public's eyes.
1.2.1. . Constituents of the standard of living
. .
Once again, the limited representativity of the samples used in an opinion poll
.
-should be stressed. The figures indicated in this document as to the lacks felt by those surveyed probably underestimate reality: indeed, the less privileged parts of the population, . the poorest people are, if not totally excluded, at least under- represented in our samples.
·. Question: Not everybody has the same idea about what are the necessities of life. Among the following things which ones seem to you the absolutary necessary to live properly today, and which ones don't seem to you to be absolutely necessary?
· Among these items, are there some which. you do not have or which you lack?
Not
Absolutely absolutely Are
- necessary necessary lacking
Having running water, electricity and
one's indoor toilet ·
94
2
1. To be able to benefit from social welfare when needed, · such as unemployment, illness, handicap,
old age
92
4
5Having sufficient accommodation so that·
everyone can have space to themselves
79
13 5HaVing a good education
81
12
11Having a car available
35
59
'18
Having sufficient leisure time and
the means to enjoy it
56
34
11Having ·.a healthy diet
80
113
Having at least one good holiday a year
43
49
16
Seeing your doctor regularly ·
59
. 31
2. Having friendly neighbors
56
34
4
Being able to go , out. with friends or
family
61
29
4
Having basic equipment such as
refrigerator or television set
. 71
20
2No answer
0
16
53.
TOTAL·
(1)
(1) (1)~···ll
-The list proposed therefore covers sociability aspects '(going out,' neighbors, family),
as
,· -- \ ' '
well as welfare .aspects (access to social security, medical care) and not only the posse$sion
' ' '
of consumer goods (car, household appliances). .
' '
More_ than half the people claim they lack none of the items mentioned: this is already a good. -indicator of the stan~ard of living in Europe. In France, in Belgium and ·in the Netherlands, six' persons out of ten are in this situation. _Most frequently, it is cars, holidays and leisure which la~k.
However, there are shaded areas: 8 % of the Portuguese dp riot have the mirtimuni ·- comfort at home. More than one person out of ten ....; in Gre~ce, Ireland and Portugal
-do not benefit from the 'social. securitY: Medical care may only seem to be a problem in
' . . -- -· '
Portugal; ·however,·~ the lack of education is more·. widespread: over 10- % of the people - · complain about it in ·Denmark; Greece, Spain,· Ireland, Italy, Luxembourg and PortugaL
The·
lacks mentioned vary With· age, education level 1, the coinnlitment to ·certain values:.
The oldest (55., and ·over)' are more often regretful at not having had a proper
edu~ation
( +
7points).-' '
- ' ' The education level and the income level - which:· operate concurrently - are only
discriminative in the possession -~f a car or in the holidays sp~nt. . . . .
' This also applies to leadership 2 and to the commitment to post - materialistic values .
. The political stand is not a relevant criteria here.
: 't
' 2
Education· level
Questiqn:- How old were you when you finished your full~ time -education?
Structure: Low level Average level High
level-· Education completed at 15 gr . earlier Education completed. between · 16 and 19 Educati_onf completed after 19
1.2.2. Ho~ the minimum neeessary is perceived
Let us
now check the ariswers to tbe question on ·what is necessary to lead aproper life nowadays.
First of all, the surveyed' persons had no difficUlty in identifying what seems indispensable to them· (n~' ~wer: 0)._ Two items were selected by more than nine perso.ns · · out of ten: minimum facilities at home. and social. security~ The three items considered as · . less necessary (
~ar,
holidays, leisure) are also those. most oftenco~idered
as lacking by the.polled sample .
. I.n his book· "Motivation 'and Personality11
, Maslow (***) outlines the following
hierarchy. of needs: physiological -needs,· safety and protection · needs, need for J~ving and belonging, and lastly, need for consideration. ·
In-commenting the ·apparent rigidity in this wording, Maslow wrote: ''TheSe needs
: "" ..
.
. . . .-are not structured as follows: once a need . is fulfilled, the next o~e emerges. This would . . suggest that· a need must be, 100 % satisfied before the next one emergesn. Based on· the ' . factorial analysis, we tried to figure out whether the various items necessary to lead a proper life could be structured · according to a hierarchy subject to . a consensus among Europeans. ,
The diagram on. the next page shows. how the .various needs are ·structured in
-~
the two-:- dimension table J;D.atching .the optirimm factorial solution. It clearly highlights the specific. position held by basic home facilities ·and social welfart:· ·Are these two elements connected to the hierarchy. of needs· described by M~low?
'(**') Maslow "Motivation and Personality" 2nd edition 1971,. from page
.
. ~5 .on.0,4
· o.e
, I
fACTOR ANALYSIS : THE HIERARCHY OF,~EEDS
. ba lil'lCecl
food
twsinQ
medical care
hane awl ia1ees
neigtDors
lei5ure
g:>ing out
holidays
o;---~---;---~----~~~--~---4----_.~---~~---~--~+-~---r---i
ecilcati(J1 ·.
-o.e
Welfare
car
-0,4
-o.e
-0,8 tap water
0!36 0,4 0,41 0,6 0,66 o.e 0,16 0,1
I,
-IN
Another method is available to -check our assumption: · using Guttman's hierarchical analysis. It consists in ordering the components of the standard of living according to an indispensable/not indispensable scale, and in analyzing the number of answers compatible with this order.
Considering the four items: home facilities, welfare, education_ and housing, 80% of the- answers are consistent with this hierarchy.
'·
- This would ·mean that there .is a virtual consensus within. the general public_ on the fact that the four above mentioned items are part of the minimum necessary to lead a decent life i:f1 Europe in 1989. It should ·also be noted that these items are to be analyzed not only in material terms (housing or home facilities) but also· in terms of rights granted and acknowledged in one's country (social rights, education).
1.3 QUALITY OF·UFE
The Europeans' quality of ·life was dealt with from a very general viewpoint, in terms of satisfactio~ with one's life; the various aspects of life were then stated.
1.3.1. Overall appraisal of one'_s ·fife
The satisfaction with one's life - a general and subjective indicator is a valuable instrument for analyses:
Question: On the whole,
'are
you very satisfied, fairly -satisfied, not very satisfied or not atall
satisfied with the life you .lead? ·
Very satisfied . . . . · . . . . Fairly satisfied . . . . Not very ·satisfied . . . · . . . . Not satisfied at all . . . . ?
TOTAL
E.E.C. 1989
24
57
14 4 1
100
)
)81 %
)
•
-
15-The level of expressed satisfaction is lower in the Southe~ European _cou11tries - (especially in Portugal) .. The social and demographic variables point out significant vSJiations
as a function of ·income and education _levels, and political stand.
Satisfaction with one's life Education level
ww
. · ... ·• ... · ...
-~..
·AVerage . . . . . . . . . . . . . . .. _ . . . ~. . ; ..
High . _ . . . l • • • • • • • • • • • •
Income level
.
.
'+
++
Political stand . Left .
..
_Right Center. .
...
. .. . .
.•·.
. . .
..
.
.
.
..
.
. . .
-.
. . . .
. . ~.
·-
.
.. . .
.. . . .
.
. . .
..
. . .
.. . .
.
. .
I ' • •
e e e lo e e e lo Ill e, e lo e e lo e e , I t lo .e e e e e e e e
.
. .
-~. . .
. .
. . ..
-•.. . . .
. . .
..
. ..
.
.. . .
.
. . .
. .
. . .
.. .
. 2.94 3.08. 3.13
2.78. 3.00 3.06
3.20
2.95 .
,. 3.09
3.11
The 'appraisal on one's present life is partly. 4etermined by one's recent- past and conditions-· the expectations for the future. ·
V s~ five years Over· the next
ago five years
More Less
·satis- satis-
+
fied- I d. fled
NA
+ + -
- ?NA
Satisfaction with one's life:
Ext. satisfied 49 41. 8 2" 19 39 11 1 9 21 Rather satisfied 40 -40 18 2 .. 11 44 14 2 9 20 Rather notsatisfied .20 33 45 2 9 31 26 '9 8 17 · Not satisfied at all 14- 32 53 1 6 21 22 19 11 19
No answer 23 ' 20 17 40· 1 2415 2 45 13
1.3.2. Appraisal of the various components of the life environment
· The Europeans' level of satisfaction with the main components of their living
environment was also 'collected. The results are expressed under the form of mean index
(1).
Question: I am going to ask you to teU me about different aspects of your daily life. In each case could you teU me whether you think this aspect is very good, fairly g¢od, fairly bad or very bad?
Your house or flat . . . : . . . . . The neighborhood where you live . . . . .. . . . Your income . . . ; . . . . ; . · .. . The work that you do .. : . . . · . . . ; Your standard of living . . . . ·. . . . The way you are able to use your leisure time . . . . The food you eat · . . . . Your social entitlements should you fall· ill . . . .
Travel facilities there are for work or · .. . doing the shopping . . . . .. . . .- . . . . ·. . ~
Your state of health . . . .. . . . The time you have available to do things .
that · have to be done . · ; . . . . Your . general level of education and knowledge . . . . ~ . . The respect that others have for you . . . . · . . . . ·. . The opportunities you have for meeting people . . . ·· · Your neighbors, the people in the vicinity . . . .
3.47 . 3.45 2.91 3.21 3.19
3.21"
3.51 3.14
3.24
3.38
3.22
3.18 3.44
3.40 3.40
Satisfaction is thus lower ·regarding social welfare and education level. It should
be noted that the satisfaction expressed regarding the standard of living is usually lower than that expressed about most items under cOnsideration. However, on the whole, those . surveyed hardly showed . any variations in their appraisal of the different aspects of _their life. The ~et
effect .is qUite obvious. .
(1) It is computed by assigning the following coefficients:
Its OK = 4; it could be better = 3; it is not OK = 2; it is not OK at all = 1.
17-Variations by country are shown on the diagrams -included in the following pag~s.
the.
table below _summarizes the impact of the social and. demographic variables (1)..sex
Age Education Income Leader- Materialism· Political level ship · indieator stand._House, Oat·
••••
...Place of living
..
•
•
Income
••
•
•
••••••
•
••
Job
•
•
••••
...•
o,.
Standard of living
••
•••••
•
••
"'Leisure
•
...
... *Food
•
..
•
Social benefits *
••
...Transportation means
..
:..
•
Health condition *
••••
••••
••••
••
•••
Time available
•
•
"'Education level
•
••
...
*** **•••
*Consideration *
•
Opportunities to meet people.
•
•
•
•
*Neighbors. district
•
..
-The impact of the "income" variable is especially significant.
1.4 SOCIAL PATH
Contrary to the income scale, nobody refuses to answer to questions on assessing one's position on the poverty verbal s~e. To identify how social paths are perceived, the same question was asked to parents and to the polled persons.
1.4.1. Family position
· This question was already asked in
1976
and in1983;
it is therefore usefuL in assessing the changes.Question: Taking everything into account, at about what level
is
your family situated-as
far asits
standard of livingis
concerned? You may answer by giving me a figure between 1 and 7. Number 1 mtJans a poor family and number 7 a rich· family. The .other numbers are for positions in between.
·Changes in self- positioning on the poverty scale
1976
1983
1989
1
2 1+2
1
2 1+2
1
2 1+2
% % % % % % % % %
Overall view
2.0
5.6 7.6
2.9 7.8 10.7
2.3 6.3 8.6
Italy·
3.0
7.8 10.8
3.6 10.5 14.1
1.5 4.7 6.2
j United Kingdom2.5
6.8 9.3
4.1 7.4 11.5
3.2
.~.69.8
France
1.6
6.0 7.6
8.1 8.5 11.6
2.8 7:Z 10.0
Ireland
2.2
4.4 6.6
3.6 11.0 14.6
4.4 8.1 12.5
Belgium
1.0
4.0 5.0
1.8 7.1 8.9
0.4 4.5 4.9
Germany
1.1
3.3 4.4.
1.0
4~95.9
0.9 3.8 4.7
Netherlands
1.2 ·. 3.2 4.4
2.1 7.2 9.3
1.3 3.7 5.5
Denmark
1.5
2.7 4.2
0.7 4.1 4.8
2.2 3.4 5.6
Luxembourg
1.1
1.1
2~21.3 3.0 4.3
0.3 1.7 2.0
Greece
8.0 12.7 20.7 . 3.4 10.5 13.9
Spain
4.2 11.3 15.5
Portugal
3.4 0.9 12.4
The study of these results highlights the fact . that, in
1989,
less people are>-
19-But there again, we would like to stress the fact that the polling. ~ethod as such rules out the most deprived persons.
Our
objective is therefore. definitely not to figure out the number of paupers (1).It is extremely enlightening to compare the subjective. poverty scale and the income scale: ·the two
measuri~g
instrumentsar~
quite different.income scale and poverty scale
Household income
+
++
NA TOTAL.Position on the poverty scale
. 1
+
2 23 9 4 1 6 9. 3
+
4+
5 73 . 87 91 91 86 88.. 6
+
7 2 3 4 8 4 4. No answer .2 1 1 4 1
TOTAL
100
too·
100
100
100-
100
Among the people who claim to have a low income (last quarter), only one ·_fourth ·consider themselves as paupers.- .
. It also seemed to us of interest to cross - compare the hierarchy of needs and · the position on the poverty scale: the table below shows the differential be~een. the answers given by those who position themselves at both ends of our scale (posiiion 1
+
2 / position 6+7).Having friendly relationships with one's neighbors . . .
+
14 Having the basic househ~ld appliances . . .+
8Benefiting from social security . . . . .· . . .
+
7Being able to go out with friends or relatives . . .
+
6Tap water · . -: . . . .. . .
+
5
Having a large enough housing . . .
+
3
Balanced food . . . . . . . . .. . .
+
2Going on holidays at least once a year · . . . . . ~ . . . .
Having a good education . . . ·. . . - 3
Having a car . . . . . · . . . . _. . . . .· . . . .. . . . · -·
5
. l.eisure . . . - 11
The positioning on the poverty scale is related to considering that society is . unfair (mean position = 3.29 when found unfair; mean position = 4.09 when not found
unfair). Having to impose restrictions upon oneself is also discriminative:
Position on the poverty scale
1+2 3 + 4 + 5 6+7j
Impose restrictions upon themselves:
'. yes No
No answer
TOTAL
74
19 7
100
33
61•
6
100
·13
85
2
- 21 ._;_
1.4.2. · The parents' positio~
Those surVeyed also positioned their. parent~ separately on the same scale.
. Question: And on the same card, where would you put your father's family when· he was a boy? Where would y(iu put your mother's faily . when she· was a girl? ·
'·' E.E.C. 1989
. /
Respo!ldent Father Mother
i
2
17
16
2
6
.. 26
26
3
-20
22
Z4
4
46
18
18
5-
197
7
6
'4.
4
3
7
1
11
?
2'
54
The answers obtained point at a strong feeling that, within two generations', the
I 'situation of -individual p~opie has much improved in Europe. For the sake of a finer analysis,
we hav~ cross- compared the .individual's responses regarding bis own home with the answers
dealing with the father's family (1) so .as to highlight the social paths.
The father's fainily. position .
1 2 3 ·4 . 5 6 7 Family position
1
9 1 1i
14
''
. .
.
. .
• -;!I..
. . . . . .
2
.
.
. . .
.
. . . . .
•
•.
. .
13
93
3
3
3
53
.
... .
.
.
. . .
. .
. . . . . .
32
2422
914
13 14
4
. . . .
.
.
~. . . . . .
.
. . .
36
50
47
59
31
41 41
5
.
. .
.
. . .
. . . .
. . .
.
.·
.. . . .
. .
7
15· 23
24. 42
26 20
6
. . .
.
. .
. .
. . . .
'.
.
..
.
.
.. .
.
2
2 4 59
'15 -18
7
. . . . . .
.
. .
.
. . . .
2
18
1.4.3. Expectations for the children
A slightly ·different question was asked regarding expectations for the . children. . .
Question: Do you think that your children or the children of people like you will have· a higher or a lower standard of living than you have now, when they reach your age?
EEC 1989
Higher 53
The same 14
IJ>wer 19
? .
14TOTAL· 100
The majority of opinions is therefore optimistic. It is even more so in the three member- countries which last joined the EJ?C (Greece, Spain, Portugal).
Persons having a· higher level of education, more privileged in terms of income, · · the leaders, the post - materialists are slightly more p.essimistic.
The table below summarizes the stands taken over three generations: one's parents, oneself, one's children.
Present standard of living vs. one's father's . Higher . The same wwer NA Total Standard of living of the ·
next generation:
Higher ·.
34
116
2
53The same 11 5
2
1 19wwer 9 3
2
14
No answer 7
4
1
2
14
SECTION 2
HOW POVERTY CONDITIONS ARE PERCEIVED_
\
This second section focuses on ho'Y poverty is perceived and on opinions on poverty; it is broken down into three sub- sections: do people come across poverty in their daily life, exj>lanations provided to ·the poverty phenomenon, and opinions on the durability and persistence of the problem.
; '
2.1 COMING ACROSS POVERTY
A small number of questions were asked to assess the visibility of the poverty issue in the · eyes of the Europeans: to what extent do they come across paupers? Is it more . frequent in towns or in the country? Are they more numerous nowadays than they were?
21.1. Pr~nce of paupers
iii
the neighborhood'
The very first question was intended to figure_ out bow the persons polled fel~
about the presence. or absence of paupers in their daily environment:
Question:
In the
area
where
you
live, are there people who live in one of
thefollowing
situation: extreme poverty, poverty, at risk of falling. into poverty?
EXtreme poverty_ . . . : . -.
Poverty· . . . .. . . . .. . . . ·~ ·
At risk of falling into poverty . . . . Nobody in any of these situations . . . .
?
.
.
.•
. . . .
.. . .
•.. . .
.
. .
. . .
.
.
.
. . . .
.
.
TOTAL
4 15
13
53 15 .
100
)
)32%
)
Less than one third of the people agree to ·the existence of Conditions of poverty or extreme precariousness in their surrounding or neighborhood. More than one European out of two claims that there is no pauper in his surrou~ding or neighborhood.· In Germany, in Spain, in Luxembourg and in the United Kingdom, six persons out of ten think so.
3
2,5
2
1,5
1
0,5
0
. 2 5
Based on the answers given, a poverty viSibility hidex can be obtained by -assigning: the following. coefficients:
3 extreme ppverty 2 poverty
1· liability to become poor
0 no people in one or th~ other of. th,e above conditions no answer
The diagram below reflects the differences among the various nations ~ as shown .by the above-defi~ed· index: it. should be noted that ~uxembotirg, Germany and· the l!nited Kingdom
are
far below the EC average whereas France, Italy, ·Greece andabov~ all Portugal show much higher values ..
The resulting classification per country - does not ·_ involve a clear -cut opposition ,betwetm the North and the South, nor any macro- economic data such -as ·
dom~stic mcome per capita.
i.
n-d
e
X
EEC average
LUX UK. D
POVERTY VISmiLITY PER COUNTRY
OK NL
index . value: 1 = .risk of poverty
2
=
poverty 3=
extreme poverty·E lRL' 8
·COUNTRIES
The impact of social and demographic variables is low. The · sex and · age factors are of little importance. The level of education, leadership and political stand do ·have an impact - less on the presence of poverty in one's _home area than on the
pre~ariousness shift on certain people's condition: i.e.~ 'thos~ with the highest level of education do not ~epart from the others in terms of knowing paupers, however, they more often clrum to know circumstances in ~hich people may become poor. Besides, the higher the income level, the higher the proportion of answers claiming an absenc~ of poverty or of risk of poverty in the environment.
Extreme Risk of No
poverty Poverty poverty poverty N.A Total
Level- of education:
Low
4
16
1154
15-
100
Average
4
1314
55
14
100
High.
4
16
17
47
16
100
Income level:
5
16
12
50
17
100
4
17
14
51
14
100
+
4
16
14
53
13100
++
3 1314
57
13100
Leadership:
++
6
18
. 20
4412
100
+
4
15
16
51
14
100
3
14
1156
16
100
2
16
956
17
100
'
Political stand:
Left
5
17
17
- 46
15
100
Center 3
14
1357
13100
· -
27-With complemental analyses; the. answers given to this questio_n can be better understood. Among others,. there is a strong connection with the level of satisfaction " regarding· One's life (coef. _r =
.:...0.78),
With. tbe pOSitioning OTI the verbal SCale Of poverty. and with the indicator of a_lienation' (feeling of-social injustice) .
. SATISFACTION
wiTH.
ONE'S UFE AND PRESENCE OF POVERTYExtreme ·Risk. of -No
pov~rty Poverty poverty poverty N.A. Total
satisfaction with
one's life: ...
Extre~ely satisfi~d .
3
1112
60
14
100
Rather satisfied 3~
15
·13
54
15
100
.Rather not satisfied
5
19 ...
14
45
17
100
Not satisfied at all
10
24
18
31
17
·100
Position on . the poor /rich scale:·
. 1
(poor)13 .
23
13·
30
21
100
2
8
21
.. 17
40
14
100
3
5
.19
14
47
15
100
4
3
14
1357
13
100
5
'3
. 12
13
59
13100
6
·3
12
1355
17
100
7
(rich)1
26
-11
49
13100
.. . . -Feeling of injustice: ....
Yes
·7
19
15
43
16
100
It depends
4
19
15.
44
18
100
-29-. 2-29-.1-29-.2-29-. Actual_knowledge of poverty conditions
Iri order to · more accurately define the scope of the, answers above, an additional question was •asked to all those .who claimed to· know of_ poverty_ 9r great precarioUsness ~nditions in the vicinity of their residence, i.e. 32 . % of our sample. This is expressed in terms of regularity, . frequency of encounters. with poQr people. ~
' . '
Question: Do you ever happen to. see for yourself the conditions ·under which these people live? Does that happen to you· often, sometimes or rarely?
Out
of
the . 32 % who. claimed to know drcumstances of poverty:Often Sometimes Rarely Never
?
TOTAL.
20) 44 )64%
22 .. ' 13.
1
100
Total
E.E~c.
.
.7 ) 14 )21%
7 4
Over six pel'Sons out . of- ten therefore· have a chance to see what poverty means in concrete terms. This prqportlon varies· from half· the people· in Belgium to nearly eight persons out of ten in Greece . Oi' Portugal. .··.
-' '·
The .income _level is a ~ghly discriminative factor in this instance. The other · social and political variables ar~ of Jittle help in the result(1) interpretation - except . for a slight-impact of the leadership and left political stand param.eters. _It should- be noted
that the c~mmunity of residence bas· no influence.
-( 1) ·The next results are shown usiri.g . an index computed by assigning the following coeffioentS: 3 - often, 2
=
sometimes, 1=
rarely, 0=
never.Income level:
+ +
2.53+
2.662.72 2.86
Leadership:
+ +
2.83+
2.772.63 2.60
Left political stand: left · 2.78
center · 2.66
right 2.66
It may be of· interest to cross -compare these two questions which are complemental in their approach of poverty: one question deals with the more or less dire character of the situationt the other concerns the frequency of the contacts, and how deeply rooted they are in the individuals' daily life:
Contacts with poverty circumstances
Extreme
Risk
ofpoverty Pov¢rty _ poverty Total
Frequency:
Often 27 42 31 100
Sometimes 8 '52. 40 100
Rarely 7 43 50 100
·Never 7 48 45 100
The fact of talking about extreme poverty and that of actually meeting paupers therefore seem to be strongly interconnected. Alsot frequent contacts with paupers are
. .
related to the positioD.ing on the verbal scale of poverty.
Poverty scale
-. 1 2 3 4
5
6 7Often 18 15 8
5
5
5 6Sometimes 21 20 17 13 12 10 14
Rarely 4 7 8 7 6 6 .8
Never 4 4 4 4 5 6 5
No answer 53 54 63 71 72 73 67
. -
31-2.1.3. Duration of poverty circumstanceS
Question: Again, talking of these.·people, would you. say they are·for the most part people·· who have always been . in that situation or. are they people who have fallen into .
-it
after having known something better?· · · ·~t of the 32 % who .claimed Whole
to·· come across poverty circumstances: sample
Always· been ·in their present situation
Fallen into it after knowing something better
? .. '
40 13
42 13
18 6
TOTAL 100 32%
Opinions vary greatly at EEC scale. . In analyzing the -·results country by country, a· contrast
em~rgesbetween
Northern European countries - where those polled ratherte~d
to consider poverty as cirCumstantial . and. Southern· European countries-· where poverty is rather -·perceived
as
an inter - generation hazard~In these countries; the notion probably e~compasses different types of realities: . · in the North, it· more often concerns people. hit by_ the economic crisis or unemployment, who end up -in precariousness or poverty. In the South, ther~ is a pregnant reference to .. rural populations not ·involved in the economic development.
These assumptions. are backed by an analysis of the social and demographic variables: a high level of instruction, . a · s_trong leadership, a commitment to post -materialistic_ values and ·a leftist political stand usually come with a marked tendency to
consider that poor people ''became" so.
-"-'--.
3 3
-2.1.4. How the change is perceived
In prder
tp
find out whether- Europeans· are_ perceiVing a rise. in poverty ' circumstances; the following' question was asked to the whole sample. ' "Que~tion: . In the area wher you live; are there more, the same,· or fewer poor people than
the~ were.
ten
years· ago? ·More-.
The same . . . ·~ . Fewer . -.. · . . . ·.- . . . .
' ?
-I I I I I I I . ' ' I I · I
·TOTAL
. .
...
.
. . . · • • . !
..
. . . .
.. . .
.
. .
11
26
32
31
.100
First of all, it should be. noted that one third of the people could not come · out with an answer. Among those who did . answer, the prevailing opinion is rather
' . . . . ' . .
()ptimistic. Indeed, for one third of the Europeans, poverty seems to be receding in their ·
' •• r '
district or village. _ Orily one person out of ten comes to the conclusion that the number · of paupers -is -increasing. It is in tl)e EC member ..::._countries showing the best standard of . living -that · those who _ do not answer ·. ar~ more. numerous (Denmark, Luxembourg,_ ·Netherlands). In the four southern European countries _and in Ireland, those who do not answer are less numerous_ and . the most -widely' accepted opinion is ·that ·the number of · paupers. is decreasing: nearly six Greeks and Italians out of ten are of this opinion. '
• . ' r . • ' .
·,
. Level of·
education:
Low
. Average _High
Income level:
+
++
Leadership:++.
+
--Post - materialism. index: Mate.rialists
Mixed
Post :-mat~rialists
Poverty .. seale:
1
2
3
4
5
6·
7. More As many
paupers paupers
10
28'
12
25
14
24
12
27
·13
29
11
. 26
11
26
18
2314
.24
9
27
8
29·
8.
29
12
26
16
23
17
. 30
14
3214
25
10
26
11
26
13
20
.zo
'27
Less
paupers No answer Total
37
25
100
28 .
'35,'
100
27'
35
100
32
29
100
30.
28
100
36
27
100
32
31
100
31
28
100
33
29
100
31
33
100
31 .
32 .
. 100.
37
26
100
31
31
100
27
34
100
t··
21
32·
100
27
27
100
30
31
100
33
31
100
33
30
100
38
29
100
22
31
100
3 5
-cOnversely, the fact of coming across poverty in one's .. envi~onment is' closely related to the assumption that the nu~ber of paupers is increasing:
·Presence of paupers in one's village or ~istrict
/ Extreme 'Risk of No·
•. poverty Poveity poverty poverty
Change in the ·number of paupers over the past
10
yearsMore 33
17
20
7
As·many
28
29
27
28
Less
21
36
29
35
No ai1Swer
18
. 18
24
30
TOTAL 100 -10o 100 ·100.
2.2 .
EXPlANATIONS TO POVERTY2.2.1. The grounds.· of poverty
Question: Why, in your opinion are there people who live in need? Here are four opinions, which is the closest to yours?
*
*
*
*
*
*
• \1.1
E.E.C.
1989 .
Because they have been unlucky . . . ·. . . 18 Because of laziness and lack of willpower . . . 17 Because there is much injustice
in our society . ·. . . 32 It is an inevitable part of modem progress . . . 17 . None of these . . . • . . . . ·. . . 7
? . . . . 9 TOTAL
. . .
~ ...
. . .
.. . .
.
. '. . .
..
•-. . .
100The same question has been asked in the survey conducted in 1976 (1). A · . compariSon of the results, country by country, shows that the polled persons are less committed to the idea that. poverty is a consequence of · laziness and · unwillin~ess:
compared ·to all EEC member- countries in 1976, this explanation is less chosen, especially in the corin~es where it was the most widely spread: United Kingdom (- 25 points), Ireland ( ~ 15 points); Lilxembourg ( -:- 6 points). The only exception is Denmark
( +
7 points).Conversely, the unfair character of the social system is chose~ by an increased
num~r of Germans (
+
11 poiilts), Britons (+
14 points), and Irish (+
11 points).. .
Among newcomers in the EEC, opinions differ between Spain and Portugal · on the one hand, and Greece - where results do not range within the European average
on the other hand.
The social and political variables are useful in understanding the results obtained: people having a high level · of education tend ·to select the unfair character of society. The leadership index plays . the same part. The commitment to post- materialistic - values usually indicates that the social system is blamed for· generating poverty. _
-.'37-No
Ummr.
luck Laziness society
Level of education:
Low
20
20
31
. . - /Average
16
17
3r
High .
17
13
38
Income level:
20
17
32
20
19
32
+
16
19
34
++
16
17
33
Leadership:
++
14
16
41
+
16
17
36
18
19
31
23
17
26
Post- materialism index:
' Materialists
23
20
26Mixed
17
18
33
Post- materialists
13
11 44Political stand:
Left
17
1145.
Center
·19
18
31
Right
17
2523 .
IneVitable-in our
modem world