Original Article
Detection of miRNA differential expression of
necrotizing enterocolitis in newborns by
high-throughput sequencing
Wei Zhou, Li Yang, Wei-Ming Yuan, Jie Yao, Xiao Rong, Yan-Bin Li, Juan Tang
Department of Neonatology, Guangzhou Women and Children’s Medical Center, Guangzhou Medical University, Guangzhou 510120, Guangdong Province, China
Received August 4, 2016; Accepted September 29, 2016; Epub January 15, 2017; Published January 30, 2017
Abstract: Objective: To detect miRNA differential expression of necrotizing enterocolitis (NEC) in infants using pe-ripheral blood samples. Method: From October 2014 to November 2015, 25 infants diagnosed as Bell stage II and above at Neonatal Intensive Care Unit (NICU) of Guangzhou Women and Children’s Medical Center were included and whole blood samples were collected. In the meantime, whole blood samples from 25 newborns without NEC were collected as the controls. Five peripheral blood samples were collected randomly from the two groups,
respec-tively, for high-throughput sequencing using Illumina technology. Differentially expressed miRNAs were identified
and the target genes and the corresponding biological roles were predicted. The remaining samples were used
for verification of the high-throughput sequencing result by RT-qPCR. Result: As compared with the control group, 482 miRNAs were differentially expressed significantly (P<0.05). Using the criteria of P<0.01, q<0.001 and |Log2 fold change | ≥1, 126 known miRNAs were found to be differentially expressed, including 58 upregulated miRNAs and 68 downregulated miRNAs. The miRNAs showing stable expression and high fold change were verified by RT-qPCR. The verification results agreed with the sequencing results for upregulated miRNAs, hsa-miR-223-5p,
-183-3p and -222-5p, and the downregulated miRNAs hsa-miR-23b-5p, -150-5p, -146a--183-3p and -1298-5p. Bioinformatics
analysis indicated that the target genes of differentially expressed miRNAs were regulatory of the Toll-like receptor
signaling pathway, MAPK pathway and JAK-STAT pathway. Conclusion: Between newborns with and without NEC,
some miRNAs in the peripheral blood leukocytes were differentially expressed and they might be involved in NEC by
regulating different target genes.
Keywords: miRNA, necrotizing enterocolitis, high-throughput sequencing, newborns
Introduction
Necrotizing enterocolitis (NEC) is a common and critically severe enteric disease in infants caused by various pathogenic factors, especial-ly for premature infants and very low birth weight infants. miRNA is a highly conservative non-encoding RNAs composed of 20-25 nucle-otides. Over 1/3 of human genes are regulated by miRNAs on the posttranscriptional level, which induces the degradation or inhibits the translation of target mRNAs. This is important for the regulation of different cell processes [1]. As to the pathogenesis of NEC, the role of miR-NAs in intestinal mucosal barrier, intestinal innate immunity and microbe-host interaction attracts most attention [2]. So far it has been known that miRNAs play important roles in intestinal mucosal inflammation, immunologic tolerance, innate immunity, tumor formation
and the proliferation, differentiation and apop-tosis of intestinal epithelial cells [3-5]. Besides, miRNAs are involved in various intestinal phys-iopathological processes through different reg-ulatory pathways associated with intestinal immunity or inflammatory response. To deter -mine the role of miRNA in NEC, we identified dif -ferentially expressed miRNAs using high-thro- ughput sequencing technology and verified the results by RT-qPCR. Moreover, the target genes were predicted and gene enrichment analysis was conducted. The findings shed new light into the understanding of pathogenesis of NEC. Materials and methods
Subjects
zhou Women and Children’s Medical Center from October 3rd 2014 to November 15th 2015
were collected. Informed consent was signed by the guardians of all subjects and the ex- perimental protocol was approved by ethics committee.
NEC group
Newborns diagnosed as Bell stage II and above were included [6]. Newborns were excluded if combined with history of severe infection and asphyxia or congenital malformation of brain, heart, gastrointestinal tract, kidney, liver and respiratory tract. Thus 25 newborns with NEC (13 males and 12 females) were included, with an average gestational age of 35.0±3.9 weeks and average birth weight of 2 370±746 g.
Control newborns were included following the criteria below
Non-NEC newborns; high risk newborns match-ed to NEC cases in gestational age, birth weight and gender; without gastrointestinal inflamma -tion or malforma-tion 2 months after birth. Twenty-five control newborns (13 males and 12 females) were included, with an average gesta-tional age of 35.1±3.9 weeks and average birth weight 2 417±694 g.
The two groups showed no significant differ -ence in gestational age, birth weight and the gender ratio (P>0.05).
Method
Sample collection and treatment: From NEC cases after diagnosis and from control cases before discharge, 1.5 ml of peripheral arterial blood was collected, respectively. Blood sam-ples were added with EDTA anti-coagulant and placed at room temperature for 2 h. Into the whole blood samples 5 times volume of 1× red blood cell lysis buffer (Beyotime, Shanghai) was added and the peripheral blood leukocytes were isolated. Then 1 ml of Trizol was added (Invitrogen, USA), mixed well and transferred to a EP tube at -80°C.
Detection of miRNA differential expression using high-throughput sequencing technique. Five samples were randomly selected from the control group and NEC group, respectively. Second-generation high-throughput sequenc-ing was conducted ussequenc-ing Illumina.
Total RNA extraction and quality evaluation
Total RNA extraction was performed using Trizol reagent and DNA contamination was removed by DNase I. All procedures were implemented according to the instruction manual. The extracted RNA was evaluated using an Agilent Bioanalyzer 2100 (Agilent Technologies, USA). RNA was considered qualified by the criteria of RNA integrity number (RIN) ≥7.0 and 28S/18S ≥0.7.
Building of small RNA library and sequencing
Illumina Truseq Small RNA Preparation Kit was used to build small RNA library (Illumina, USA). Adapter was connected to the 3’- and 5’-termi-nal of RNA and cDNA was synthesized by reverse transcription (RT) using primers com-plementary to the 3’-terminal of RNA. After qPCR, fragments of 140-160 bp were recov-ered using 6% polyacrylamide gel. The quality of the small RNA library generated was evalu-ated using an Agilent Bioanalyzer 2100. RNAs with the concentration above 20 nmol/L, length of 140-160 bp and free from dimer contamina-tion were used for high-throughput sequencing on the Illumina HiSeq 2500 platform. The raw reads were treated to obtain the clean reads for aligning against the full human genome using SOAP Toolkit 2.0 Software. The unaligned reads were removed and the matched ones were aligned against the genomic repeated sequenc-es, GenBank and Rfam10.0 database, respec -tively. Sequences annotated as other small molecules were removed and alignment was done for the remaining sequences against miR-base21.0 database using BLAST Program. The known miRNAs were classified and annotated and their expression levels were determined (RNA library building and sequencing were accomplished by BGI-Shenzhen).
Detection of miRNA differential expression
Verification of the differentially expressed miR -NAs
The remaining 20 samples from each group were used for RT-qPCR as verification. According to high-throughput sequencing, 7 differentially expressed miRNAs were chosen for stem-loop RT-qPCR. Total RNA (500 ng) was extracted and cDNA was synthesized by using the reverse transcription kit (RR037A, TaKaRa, Japan). Then qPCR was performed using the kit (RR820B, TaKaRa, Japan) on the ABI7500 instrument (ABI, USA) by taking 2 µl of the syn -thesized cDNA as the template. RNU6 SnRNA was used as internal control gene. Primers for stem-loop RT-qPCR and PCR were designed and synthesized by RiboBio Co. PCR conditions were as follows: predenaturation at 95°C for 30 s, denaturation at 95°C for 5 s, annealing at 60°C for 30 s, 40 cycles; 95°C 15 s, 60°C 1 min. PCR dissociation curve was plotted. Three replicates were set up for each sample and the average was taken. Results were analyzed using SDS 1.4 software and miRNA relative expression was calculated by using 2-ΔΔCt method.
Bioinformatics analysis
Target genes were predicted for 126 differ- entially expressed miRNAs using RNAhybrid, miRanda, targetscan and PITA. GO annotations and analysis of KEGG metabolic pathway and signal transduction pathways were done for all target genes using DAVID bioinformatics soft-ware. The threshold for significant difference was set as P≤0.05 after adjustment.
Statistical analysis
SPSS 17.0 software was used for statistical analyses. Measurements obeying the normal distribution were reported as _x±s. The indep- endent two-sample t-test was adopted for in- tergroup comparison. Counts were expressed as frequencies or percentages. miRNA differen-tial expression was analyzed in the two groups using DEGseq R language, with P<0.05 indicat -ing significant difference. q was defined as the probability of a differentially expressed miRNA being a false negative; it was a re-statistic amount of P. Differentially expressed miRNAs were divided into different groups by clustering analysis using the MeV4.9.0 software.
Results
Results of high-throughput sequencing
Small RNA libraries: Ten small RNA libraries
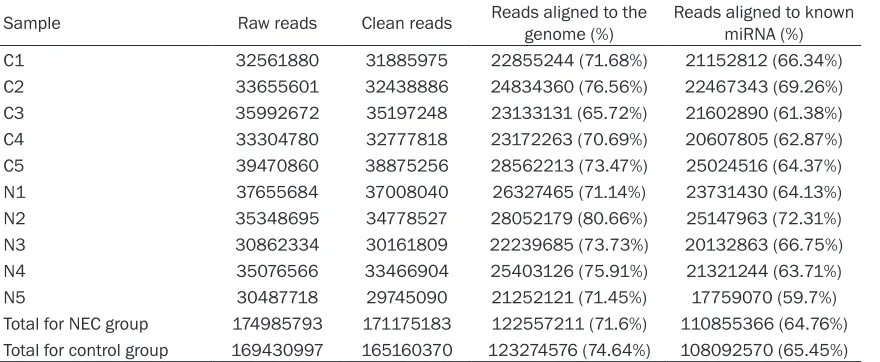
were built by sequencing (Table 1), with 174 985 793 and 169 430 997 raw reads in NEC group and control group, respectively; there were 171 175 183 and 165 160 370 clean reads, respectively, having 18-22 nucleotides generally. These small RNA sequences were qualified for alignment against the sequences from the databases (Figure 1). Alignment results indicated that NEC group and control group had 110 855 366 and 108 092 570 miRNA sequences, accounting for 64.76% and 65.45% among total clean reads, respectively.
Differentially expressed miRNA: Ten miRNA
[image:3.612.91.531.86.267.2]libraries in Table 1 were analyzed separately for Table 1. Small RNA libraries for sequencing
Sample Raw reads Clean reads Reads aligned to the genome (%) Reads aligned to known miRNA (%) C1 32561880 31885975 22855244 (71.68%) 21152812 (66.34%) C2 33655601 32438886 24834360 (76.56%) 22467343 (69.26%) C3 35992672 35197248 23133131 (65.72%) 21602890 (61.38%) C4 33304780 32777818 23172263 (70.69%) 20607805 (62.87%) C5 39470860 38875256 28562213 (73.47%) 25024516 (64.37%) N1 37655684 37008040 26327465 (71.14%) 23731430 (64.13%) N2 35348695 34778527 28052179 (80.66%) 25147963 (72.31%) N3 30862334 30161809 22239685 (73.73%) 20132863 (66.75%) N4 35076566 33466904 25403126 (75.91%) 21321244 (63.71%) N5 30487718 29745090 21252121 (71.45%) 17759070 (59.7%) Total for NEC group 174985793 171175183 122557211 (71.6%) 110855366 (64.76%) Total for control group 169430997 165160370 123274576 (74.64%) 108092570 (65.45%)
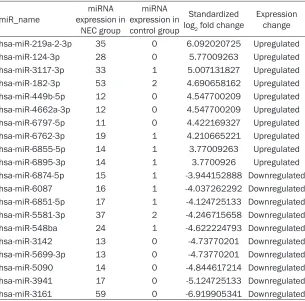
NEC group and control group using DEGseq, and 428 differentially expressed miRNAs were identified (P<0.05). According to the screening criteria of P<0.01, q<0.001 and standardized |Log2 (fold change) | ≥1, 126 known miRNAs were differentially expressed, including 58 upregulated miRNAs and 68 downregulated miRNAs (Table 2). For these miRNAs clustering analysis was performed. The two groups
[image:4.612.87.526.73.262.2]dif-had an S-shape. Ct value from each amplifica -tion curve was below 35. All dissocia-tion curves of miRNAs were unimodal, indicating no specif-ic amplifspecif-ication. As compared with the control group, hsa-miR-183-3p, -223-5p and -222-5p were significantly upregulated in NEC group; hsa-miR-23b-5p, -150-5p, -146a-3p and -1298-5p were downregulated significantly (P<0.05) (Table 3). RT-qPCR results basically agreed
Figure 1. Length of reads in small RNA libraries in the two groups.
Table 2. Top 10 miRNAs showing upregulated or downregulated expres-sion
miR_name expression in miRNA NEC group
miRNA expression in control group
Standardized
log2 fold change Expression change hsa-miR-219a-2-3p 35 0 6.092020725 Upregulated hsa-miR-124-3p 28 0 5.77009263 Upregulated hsa-miR-3117-3p 33 1 5.007131827 Upregulated hsa-miR-182-3p 53 2 4.690658162 Upregulated hsa-miR-449b-5p 12 0 4.547700209 Upregulated hsa-miR-4662a-3p 12 0 4.547700209 Upregulated hsa-miR-6797-5p 11 0 4.422169327 Upregulated hsa-miR-6762-3p 19 1 4.210665221 Upregulated hsa-miR-6855-5p 14 1 3.77009263 Upregulated hsa-miR-6895-3p 14 1 3.7700926 Upregulated hsa-miR-6874-5p 15 1 -3.944152888 Downregulated hsa-miR-6087 16 1 -4.037262292 Downregulated hsa-miR-6851-5p 17 1 -4.124725133 Downregulated hsa-miR-5581-3p 37 2 -4.246715658 Downregulated hsa-miR-548ba 24 1 -4.622224793 Downregulated hsa-miR-3142 13 0 -4.73770201 Downregulated hsa-miR-5699-3p 13 0 -4.73770201 Downregulated hsa-miR-5090 14 0 -4.844617214 Downregulated hsa-miR-3941 17 0 -5.124725133 Downregulated hsa-miR-3161 59 0 -6.919905341 Downregulated
fered significantly in color, but within either group, the color of each sample was similar, indi-cating good correlation and repeatability of the samples.
Verification by RT-qPCR
[image:4.612.93.398.308.609.2]with the sequencing, indicating reliability of the sequencing.
Bioinformatics analysis
Target genes were predicted for 126 differen-tially expressed miRNAs, and only the
[image:5.612.90.523.89.153.2]intersec-tions of the same target genes predicted by the same miRNAs were counted. Thus 6344 poten-tial target genes were predicted. GO enrich-ment analysis was performed and 78 signifi -cant GO terms were identified. The target genes of these differentially expressed miRNAs were mainly found in the cell membranes, protein Table 3. Relative expression of miRNA (_x±s)
miRNA miR-223-5p miR-183-3p miR-222-5p miR-23b-5p miR-150-5p miR-146a-3p miR-1298-5p
NEC group 7.254±0.243 5.186±0.592 3.636±0.157 0.743±0.095 0.444±0.326 0.296±0.219 0.247±0.202
Control group 0.955±0.834 1.219±0.850 1.024±0.408 1.227±0.516 1.132±0.587 1.066±0.823 1.394±0.549
t value 4.13 6.432 3.586 2.434 3.321 2.565 5.823
p value 0.001 <0.001 0.003 0.048 0.004 0.034 <0.001
Note: P<0.05 compared with the control group.
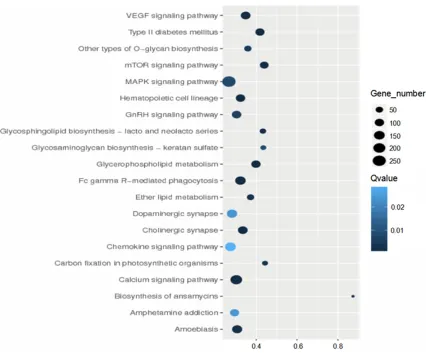
Figure 2. Top 20 pathways showing differential expression. Note: X axis represents the enrichment factor. The larger the dot, the higher the enrichment level and the more candidate genes exist in this pathway. The color representing
each dot indicates different range of q value; the darker the color, the greater the difference is. Y axis represents the name of the pathways, which are identified as follows: VEGF, type II diabetes mellitus, other types of O-glycan bio -synthesis, mTOR signaling pathway, MAPK signaling pathway, hematopoietic cell lineage, GnRH signaling pathway,
glycosphingolipid biosynthesis-lacto and neolacto series, glycosaminoglycan biosynthesis-keratan sulfate, glycero -lipid metabolism, Fc gamma R-mediated phagocytosis, ether -lipid metabolism, dopaminergic synapse, cholinergic
synapse, chemokine signaling pathway, carbon fixation in photosynthetic organisms, calcium signaling pathway,
[image:5.612.93.519.180.533.2]channels and receptor complexes. The main biological processes identified by GO enrich -ment analysis included immune response, che-motaxis-related regulation, cell junction, T-cell activation, regulation of receptor-mediated en- docytosis, positive stress-activated protein kinase cascade, formation of epithelial cells, multi-process regulation and positive regula-tion of histone acetylaregula-tion. As to molecular function, the gene sets are mainly involved in laminin binding, vascular endothelial growth factor receptor binding and protein kinase bind -ing. Enrichment analysis of KEGG pathway indi-cated that the target genes of the differentially expressed miRNAs were involved in 61 ways. They were typically mTOR signaling path-way, Toll-like receptor signaling pathpath-way, VEGF signaling pathway, NF-κB signaling pathway, NOD-like receptor pathway, FcγR-mediated phagocytosis, MAPK signaling pathway, B-cell signaling pathway, T-cell receptor signaling pathway and JAK-STAT signaling pathway (P<0.05) (Figure 2).
Discussion
NEC, a common enteric disease for newborns, especially premature babies, has high inci-dence and mortality. Many factors are believed to play a role in NEC, including premature deliv-ery, pathogen colonization and hypoxic and ischemic injury of the intestinal tract. These risk factors are associated with the inflamma -tory cascade, leading to intestinal inflamma -tion, hemorrhagic necrosis and apoptosis of intestinal epithelial cells and finally resulting in NEC [8]. miRNAs are important components in many physiopathological processes, including development, cell migration, proliferation, ne- crosis and apoptosis. They are also involved in intestinal inflammation and immune response via several pathways. For example, in inflamma -tory bowel disease, miR-132 maintains inflam -mation-dependent homeostasis by regulating the cholinergic signaling pathway [9]. miR-124 targeting STAT3 regulates intestinal injury in ulcerative colitis [10]. However, the correlation between miRNA correlation and NEC is not fully understood yet. We applied high-throughput sequencing to miRNA expression profile. With the criteria of P<0.01, q<0.001 and standard -ized |Log2 fold change | ≥1, 126 miRNAs were expressed differentially, including 58 upregu-lated miRNAs and 68 downreguupregu-lated miRNAs. For verification, 7 miRNAs showing high and
stable expression and high fold change in ea- ch group were subjected to RT-qPCR. Bioin- formatics analysis was conducted for 126 dif-ferentially expressed miRNAs.
-tory changes of the bowels [16]. The present study indicated that miR-1298-3p was signifi -cantly downregulated in newborns with NEC, but the regulatory mechanism requires further understanding.
Moreover, miR-223-5p, -34a, -222-3p and -183-3p were upregulated significantly in NEC. Bioinformatics analysis indicated that the tar-get genes of miR-223-5p were claudin-8 (CLDN8), forkhead box O 3a (FOXO3a), nucleo -tide-binding and oligomerization domain-like receptor 8 (NLRP8) and intercellular cell adhe-sion molecule-1 (ICAM1). These target genes are part of the intestinal barrier and involved in intestinal inflammation and immune regulation through the PPAR, NF-κB and MAPK signaling pathways. CLDN8 is an important component of the intestinal barrier and miR-223 as the pro-inflammatory factor is upregulated significantly in intestinal inflammation. miR-223 inhibits the expression of target gene CLDN8 and activates IL23/Th17 pathway, causing damage to the intestinal barrier and leading to intestinal inflammation and immune response [17]. In intestinal tissues from rats with inflammatory bowel disease, upregulated miR-223 inhibits the expression of inhibitors of nuclear tran-scription factor kappa B-α (IκBα), thus activat -ing NF-κB and NF-κB signal-ing pathway [18]. miR-34a is associated with the apoptosis of intestinal epithelial cells. In intestinal isch-emia/reperfusion injury, upregulated miR-34a-5p can cause active oxygen species accumula-tion and intestinal cell apoptosis by inhibiting the target gene STRT1 [19]. Combining with target gene prediction, the target genes of miR-34a-5p include STRT1 in newborns with NEC. Therefore, miR-34a-5p regulates apoptosis of intestinal epithelial cells and intestinal inflam -mation by targeting STRT1, but the specific mechanism is unknown. miR-222-3p induces the inflammation and migration of endothelial cells through angiotensin converting enzyme-2 (ACE2), thus causing the inflammation [20]. Besides, miR-222 mediates the Toll-like recep -tor signaling pathway and regulates intestinal inflammation [21]. According to our results, tar -get genes of miR-183-3p, namely, FOXO4 and PTS1, are regulatory of peroxisome signaling pathway. These target genes, along with the signaling pathway, play an important mediatory role in inflammation, cell differentiation, prolif -eration and apoptosis. From this we can infer that miR-183-3p may be involved in the
regula-tion of intestinal cell apoptosis and necrosis in newborns with NEC. In brief, the above-men-tioned miRNAs can regulate the necrosis and apoptosis of intestinal epithelial cells, intesti-nal barrier, intestiintesti-nal immunity and activation of intestinal inflammatory cells through the related target genes. This represents an impor-tant mechanism of the pathogenesis of NEC. Bioinformatics analysis over 126 differentially expressed miRNAs indicates that the enriched GO terms were immune response, chemotaxis-related regulation, cell junction, T-cell activa-tion, regulation of receptor-mediated endocyto-sis, positive stress-activated protein kinase cascade and formation of epithelial cells. These differentially expressed miRNAs may be invo- lved in the regulation of intestinal barrier, intes-tinal immunity and inflammation in newborns with NEC. Enrichment analysis of KEGG path-way indicated that the target genes of the dif-ferentially expressed miRNAs were involved in mTOR signaling pathway, Toll-like receptor sig -naling pathway, VEGF sig-naling pathway, NF-κB signaling pathway, NOD-like receptor pathway, FcγR-mediated phagocytosis, MAPK signaling pathway, B-cell signaling pathway, T-cell recep-tor signaling pathway and JAK-STAT signaling pathway. All these pathways are related to intestinal immunity, inflammation, cell prolifer -ation and apoptosis. Particularly, abnormal activation of Toll-like receptor signaling path -way is deemed as an important pathogenesis of NEC [22]. According to relevant studies, MAPK signaling pathway mediates the injury and apoptosis of intestinal epithelial cells in newborns with NEC [23]. But the specific miR -NAs and their target genes involved in this pro-cess are unknown and investigation into the working mechanism of the miRNAs is needed.
Acknowledgements
This work was supported by Science and Technology Program of Guangzhou, China (201510010217).
Disclosure of conflict of interest
None.
Address correspondence to: Wei Zhou, Depart- ment of Neonatology, Guangzhou Women and Children’s Medical Center, No. 318, Renminzhong Road, Guangzhou 510120, Guangdong Province, China. Tel: 81330578; Fax: +86-020-81861650; E-mail: [email protected]
References
[1] Bartel DP. MicroRNAs: genomics, biogenesis, mechanism, and function. Cell 2004; 116: 281-297.
[2] Sharma R and Hudak ML. A clinical perspec -tive of necrotizing enterocolitis: past, present, and future. Clin Perinatol 2013; 40: 27-51. [3] Zhang L, Cheng J and Fan XM. MicroRNAs: New
therapeutic targets for intestinal barrier dys-function. World J Gastroenterol 2014; 20: 5818-5825.
[4] Chen WX, Ren LH and Shi RH. Implication of
miRNAs for inflammatory bowel disease treat -ment: Systematic review. World J Gastrointest Pathophysiol 2014; 5: 63-70.
[5] Chivukula RR, Shi G, Acharya A, Mills EW,
Zeitels LR, Anandam JL, Abdelnaby AA, Balch GC, Mansour JC, Yopp AC, Maitra A and Mendell JT. An essential mesenchymal func-tion for miR-143/145 in intestinal epithelial regeneration. Cell 2014; 157: 1104-1116. [6] Shao XM, Ye HM and Qiu XS. Practical
neona-tal. 4th edition. Beijing: people’s medical pub-lishing house; 2012. pp. 478-479.
[7] Wang L, Feng Z, Wang X, Wang X and Zhang X.
DEGseq: an R package for identifying differen -tially expressed genes from RNA-seq data. Bioinformatics 2010; 26: 136-138.
[8] Jain L. Necrotizing enterocolitis prevention: art or science? Clin Perinatol 2013; 40: xiii-xv. [9] Runtsch MC, Round JL and O’Connell RM.
MicroRNAs and the regulation of intestinal ho-meostasi. Front Genet 2014; 5: 347.
[10] Koukos G, Polytarchou C, Kaplan JL, Morley-Fletcher A, Gras-Miralles B, Kokkotou E, Baril-Dore M, Pothoulakis C, Winter HS and Iliopoulos D. MicroRNA-124 regulates STAT3 expression and is down-regulated in colon tis-sues of pediatric patients with ulcerative coli-tis. Gastroenterology 2013; 145: 842-852, e2.
[11] Runtsch MC, Hu R, Alexander M, Wallace J,
Kagele D, Petersen C, Valentine JF, Welker NC,
Bronner MP, Chen X, Smith DP, Ajami NJ, Petrosino JF, Round JL and O’Connell RM. MicroRNA-146a constrains multiple parame-ters of intestinal immunity and increases sus-ceptibility to DSS colitis. Oncotarget 2015; 6: 28556-28572.
[12] Yang L, Boldin MP, Yu Y, Liu CS, Ea CK,
Ramakrishnan P, Taganov KD, Zhao JL and
Baltimore D. miR-146a controls the resolution of T cell responses in mice. J Exp Med 2012; 209: 1655-1670.
[13] Chassin C, Kocur M, Pott J, Duerr CU, Gütle D, Lotz M and Hornef MW. miR-146a mediates protective innate immune tolerance in the neo-nate intestine. Cell Host Microbe 2010; 8: 358-368.
[14] Ayyadurai S, Charania MA, Xiao B, Viennois E, Zhang Y and Merlin D. Colonic miRNA expres-sion/secretion, regulated by intestinal epithe-lial PepT1, plays an important role in cell-to-cell communication during colitis. PLoS One 2014; 9: e87614.
[15] Bian Z, Li L, Cui J, Zhang H, Liu Y, Zhang CY and Zen K. Role of miR-150-targeting c-Myb in co-lonic epithelial disruption during dextran sul-phate sodium-induced murine experimental colitis and human ulcerative colitis. J Pathol 2011; 225: 544-553.
[16] O’Connell RM, Rao DS, Chaudhuri AA and Baltimore D. Physiological and pathological roles for microRNAs in the immune system. Nat Rev Immunol 2010; 10: 111-122.
[17] Wang H, Chao K, Ng SC, Bai AH, Yu Q, Yu J, Li M, Cui Y, Chen M, Hu JF and Zhang S.
Pro-inflammatory miR-223 mediates the cross-talk
between the IL23 pathway and the intestinal
barrier in inflammatory bowel disease. Genome
Biol 2016; 17: 58.
[18] Kim HY, Kwon HY, Ha Thi HT, Lee HJ, Kim GI, Hahm KB and Hong S. MicroRNA-132 and
mi-croRNA-223 control positive feedback circuit by regulating FOXO3a in inflammatory bowel
disease. J Gastroenterol Hepatol 2016; 31: 1727-1735.
[21] Bai J, Li Y, Shao T, Zhao Z, Wang Y, Wu A, Chen H, Li S, Jiang C, Xu J and Li X. Integrating analy-sis reveals microRNA-mediated pathway
cross-talk among Crohn’s disease, ulcerative colitis
and colorectal cancer. Mol Biosyst 2014; 10: 2317-2328.
[22] Gribar SC, Sodhi CP, Richardson WM, Anand
RJ, Gittes GK, Branca MF, Jakub A, Shi XH, Shah S, Ozolek JA and Hackam DJ. Reciprocal
expression and signaling of TLR4 and TLR9 in the pathogenesis and treatment of necrotizing enterocolitis. J Immunol 2009; 182: 636-646.
[23] Talavera MM, Kralik N, Jin Y, Chen B, Liu Y and Nelin LD. Mitogen-activated protein kinase