T E C H N I C A L N O T E
Open Access
New finite-size correction for local alignment
score distributions
Yonil Park, Sergey Sheetlin, Ning Ma, Thomas L Madden and John L Spouge
*Abstract
Background:Local alignment programs often calculate the probability that a match occurred by chance. The calculation of this probability may require a“finite-size”correction to the lengths of the sequences, as an alignment that starts near the end of either sequence may run out of sequence before achieving a significant score.
Findings:We present an improved finite-size correction that considers the distribution of sequence lengths rather than simply the corresponding means. This approach improves sensitivity and avoids substituting anad hoclength for short sequences that can underestimate the significance of a match. We use a test set derived from ASTRAL to show improved ROC scores, especially for shorter sequences.
Conclusions:The new finite-size correction improves the calculation of probabilities for a local alignment. It is now used in the BLAST+ package and at the NCBI BLAST web site (http://blast.ncbi.nlm.nih.gov).
Background
Local alignments are an essential tool for biologists and often provide the first information about the function of an unknown nucleotide or protein sequence. An import-ant question concerns the relationship of the score of a local alignment with the probability that the alignment occurred by chance. Karlin and Altschul [1] developed an asymptotic theory for local alignments, assuming that no gaps are permitted. For two random sequencesIand
Jof lengthsmandn, respectively, the resulting distribu-tion of the optimal alignment score M^ approximates a Gumbel distribution [2]
PM^ >y1 expkmneλy: ð1Þ
The two statistical parameters in Equation (1) areλ, the scale parameter, andk, the pre-factor.
Several authors [3-12] extended this framework to local alignments with gaps and showed that the Gumbel distribution from Equation (1) is still valid, though dif-ferent values forλ andkare required. Altschul [13] dis-cussed the need for a “finite-size correction” to the lengths m and n to improve the accuracy of Equation
(1). The resulting statistics are an integral part of the Basic Local Alignment Search Tool (BLAST) [14].
The following presentation emphasizes intuition over mathematical formality, to explain how the finite-size correction can account for the finite sequence lengthsm
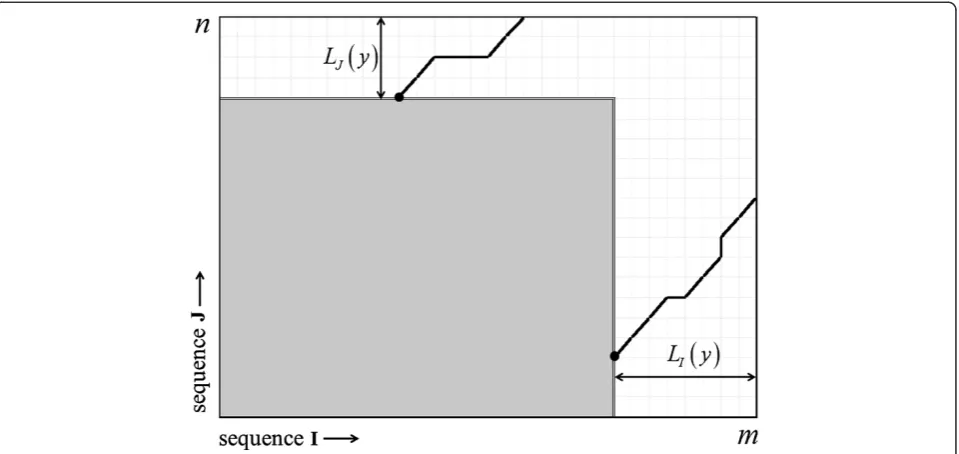
and n to improve the accuracy of Equation (1). Let us begin with an optimal local alignment, which starts from score 0 and requires a non-zero sequence length within bothIandJ, before it achieves scorey. LetLI(y) (LJ(y)) be the required random lengths within bothI(J), and let
lIð Þ ¼y EfLIð Þy g(lJð Þ ¼y EfLJð Þy g) be the corresponding means. The main idea is that the optimal local alignment cannot start anywhere along the full length m(n) of se-quence I (J), because there might be insufficient se-quence to permit it to achieve the score y (Figure 1). The finite-size correction described in [13] and used in BLAST therefore replaced the areamnof the alignment matrix for Equation (1) by
mlIð Þy
½ ½nlJð Þy : ð2Þ
Equation (2) approximates the area within the align-ment matrix where the optimal local alignalign-ment can start and on average still have enough space to exceed the score y. If m<lI(y) or n<lJ (y), however, the resulting value in Equation (2) might become negative. The BLAST code for the old finite-size correction therefore set the corrected sequence length to an ad hoc value
* Correspondence:[email protected]
National Center for Biotechnology Information, National Library of Medicine, Bethesda, MD 20894, USA
(typically 1). For very short query or database sequences, the ad hoc correction could underestimate the signifi-cance of an alignment by many orders of magnitude.
The purpose of this note is to present a new finite-size correction formula for the BLAST statistics. It avoids the
ad hoc correction and improves on them by considering the (approximately normal) distributions of the random lengthsLI(y) andLJ(y) explicitly, and not just the corre-sponding meanslI(y) andlJ (y). We demonstrate below that the new finite-size correction is better than the older one, both in theory and in practice. All BLAST+ protein-protein applications (i.e., BLASTP, BLASTX) use the new finite-size correction by default, starting with version 2.2.26.
Findings
New finite-size correction
As with the old finite-size correction, the expectation
lIð Þ ¼y ELIð Þy is approximated linearly:
lIð Þ ¼y aIyþbI: ð3Þ
Most practical scoring systems are symmetric, with
s(A, B) =s(B, A) for any two lettersAand B, and for a symmetric scoring matrix and symmetric sequence com-positions, expectations corresponding to Iand J are the same, e.g.,lI(y) =lJ(y) =l(y). For asymmetric scoring sys-tems or asymmetric sequence compositions, however,
the variatesLI(y) andLJ(y) can have different distribu-tions, so the following retains the subscriptsIandJ.
The new finite-size correction replacesmnin Equation (1) by
E ½mLIð Þy þ½nLJð Þy þ
; ð4Þ
where x+= max{x,0}. Rather than taking the expectation ofLI(y) andLJ(y) as in Equation (2), Equation (4) is the expected area within the alignment rectangle where an optimal local alignment can start and have enough ran-dom sequence length to reach the scorey(Figure 1).
The practical computation of Equation (4) approximates the distribution of (LI(y),LJ(y)) with a bivariate normal dis-tribution, with means lIð Þ ¼y ELIð Þy andlJð Þ ¼y ELJð Þy , variances var LI(y) =vI(y) and var LJ(y) =vJ (y), and co-variance cov (LI(y),LJ (y)) =c(y), all assumed to be linear in the scorey, i.e.,
lIð Þ ¼y aIyþbI;lJð Þ ¼y aJyþbJ;
vIð Þ ¼y αIyþβI;vJð Þ ¼y αJyþβJ;
c yð Þ ¼σyþτ:
ð5Þ
[image:2.595.60.540.89.316.2]The estimation of the parameters aI, aJ, αI, αJ and σ has mathematical depth and involves many unproved speculations, but involves a heuristic modeling of a ran-dom sequence alignment with Markov additive processes [15], ultimately with use of the renewal-reward theorem.
The Appendix presents formulas for computing aI, aJ, αI,αJandσ.
BLAST p-values are relatively insensitive to the values of the interceptsbI,bJ,βI,βJ, andτ, so the practical com-putation approximates them, as follows. Let au (αu) be
the value of aI(αI) for ungapped alignment. The math-ematical theories for random walks and for renewals yield analytic formulas for au and αu [16]. For an ungapped optimal alignment, the alignment length required to exceed the score y is the same within the sequencesIandJ, because it lacks gaps. Thus,auandαu do not depend on the sequence (IorJ) under consider-ation, so they contain no subscripts I or J. In a gapped alignment, let a gap of length 1 incurs a penalty G. The following uncontrolled approximations hold [17]:
bI ¼2G að uaIÞ;bJ ¼2G að uaJÞ βI ¼2GðαuαIÞ;βJ ¼2GðαuαJÞ
τ¼2GðαuσÞ:
ð6Þ
Under the normal approximation, routine computa-tion shows that Equacomputa-tion (4) is approximately
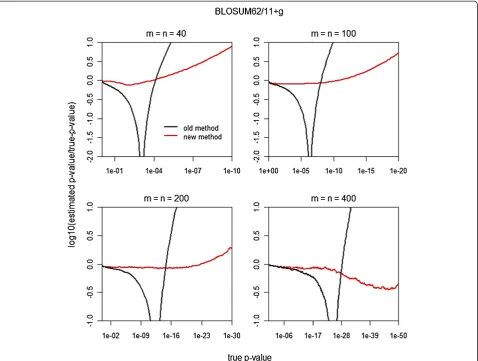
Figure 2Comparison ofp-values for the new and old finite-size corrections using the BLOSUM62 scoring matrix and 11 +gaffine gap penalty for equal sequence lengths (m=n) 40, 100, 200, and 400.Figure 2 plots log10^p=pagainstp, where^pis the calculatedp-value andp
[image:3.595.60.539.89.450.2]is thep-value from the simulation. Thus, a perfectp-value estimate corresponds to the horizontal liney= 0. The red line shows the results from the new finite-size correction; the black line, the old finite-size correction.
Table 1 Retrieval accuracy for different subsets of SCOP database with the new and old finite-size correction
Method 25thpercentile 50thpercentile Full database
New correction 0.10373 ± 0.00022 0.10073 ± 0.00019 0.08535 ± 0.00013 Old correction 0.09201 ± 0.00020 0.09282 ± 0.00017 0.08358 ± 0.00014
The three subsets contain proteins shorter than 91 residues (25th
percentile by length), shorter than 137 residues (50thpercentile by length), and the full database. ROC-4852 scores are presented with an error (one standard deviation). The 25th
E ½mLIð Þy þ½nLJð Þy þ
mlIð Þy
ð ÞPðX≤mΦÞ ffiffiffiffiffiffiffiffiffiffivIð Þy p
EðX;X≤mΦÞ
nlJð Þy
ð ÞPðX≤nΦÞ ffiffiffiffiffiffiffiffiffiffivJð Þy p
EðX;X≤nΦÞ
þ c yð ÞPðX≤mΦÞPðX≤nΦÞ
;
ð7Þ
where mΦ:¼½mlIð Þy = ffiffiffiffiffiffiffiffiffiffi
vIð Þy p
, nΦ:¼ðnlJð ÞyÞ= ffiffiffiffiffiffiffiffiffiffi
vJð Þy p
, and X is a standard normal variate. The final product PðX≤mΦÞPðX≤nΦÞ is an uncontrolled independence
approximation for the bivariate normal distribution.
Comparison ofp-values for the new and old finite-size corrections
We comparedp-values for the new finite-size correction with those for the old finite-size correction using the BLOSUM62 scoring matrix and affine gap penalty 11 +g. Hartmann used a rare-event simulation method to com-pute the local alignment score distribution for ranges that included small p-values like p= 10−50 [18], thereby producing a theoretical standard for smallp-values.
Figure 2 plots relative errors in logarithmic scale against true p-values for equal sequence lengthsm=n= 40, 100, 200, and 400. Using Hartmann’s theoretical standard, the new finite-size correction outperforms as the p-value decreases, sometimes by orders of magnitude.
Evaluation of accuracy
We evaluated the performance of the new finite-size correction using the ASTRAL SCOP 40 subset [19] of release 1.75 of the Structural Classification of Proteins
(SCOP) [20] database. We sorted the SCOP domains by lexicographic order and used the even numbered sequences as our query set, but removed any query that was the sole member of the superfamily in ASTRAL 40. For a given query sequence, we considered any database sequence belonging to the same SCOP superfamily as a true positive, and any database sequence belonging to a different SCOP fold as a false positive. Following [21], in the retrieval list for each query, we censored all sequences belonging to the same fold but different superfamily, so those sequences contributed neither true or false positives to the retrieval.
We report the performance in terms of the Receiver Operator Characteristics (ROC). Specifically, we report the ROCnscore, which is obtained by pooling the results of all queries, ordering them by expect value, but only keeping results up the n-th false positive [21]. The ex-pect value for the database search was obtained from the pairwise p-values using a length-proportional correction that takes the ratio of the database length to the target sequence length into account [13].
As discussed above, the new finite-size correction should show the greatest improvement for short sequences. Therefore, we also produced ROCnscores for different subsets of the SCOP database. One database subset has sequences shorter than the 25th percentile length (95 residues), and another has sequences shorter than the 50th percentile length (137 residues).
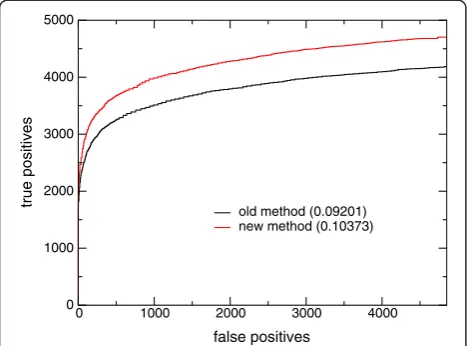
Table 1 presents ROCn scores for the full database as well as the two subsets described above. These scores have an average of one false positive per query (4852), a threshold found useful in other studies (Altschul SF, private communication). The ROC-4852 scores for the full database demonstrate a small improvement of the new finite-size correction over the older one. The sub-sets show a more impressive improvement. For the 50th percentile subset, the ROC-4852 score improves by 9%. For the 25th percentile subset, the ROC-4852 score shows a 13% improvement. In the 25th percentile sub-set, the new finite-size correction produces roughly 12% more true positives overall at 4852 false positives than the old finite-size correction (Figure 3). These results confirm our expectation that the new finite-size correc-tion will display greatest improvement in retrieval for short sequences.
To assess the significance of this improvement on BLAST searches, one may look to the length distribution of sequences in a heavily used protein BLAST database. The non-redundant (“nr”) database is the default protein database at the NCBI BLAST web site. Of the sequences in the nr database, 11% are 95 residues or shorter; and 21%, 137 residues or shorter. The new finite-size correc-tion improves the retrieval accuracy for a noticeable fraction of the proteins in the nr database.
0 1000 2000 3000 4000
false positives 0 1000 2000 3000 4000 5000 true positives
[image:4.595.57.291.90.263.2]old method (0.09201) new method (0.10373)
Conclusion
We have described a new finite-size correction. The new correction has a more rigorous derivation than the current finite-size correction and avoids the use of anad hocvalue for short sequences. We have tested the retrieval accuracy of the new finite-size correction on the gold standard SCOP set, and have shown that the improvement is most important for short sequences. This correction has been made part of the BLAST+ protein-protein applications (e.g., BLASTP, BLASTX) as well as at the NCBI BLAST web site. In the future, we plan to implement this cor-rection for nucleotide-nucleotide comparisons.
Availability and requirements
Project Name: BLAST Statistical Parameters
Project home page: http://www.ncbi.nlm.nih.gov/ CBBresearch/Spouge/html_ncbi/html/blast/
Operating systems: Windows, MacOSX, LINUX, UNIX Programming language: C++
License: Public Domain (see http://www.ncbi.nlm.nih. gov/books/NBK22952/)
Any restrictions to use by non-academics: None
Appendix
Let Zþ¼f0;1;. . .g. Consider two semi-infinite random
sequences, yielding alignment scores Si,j at each vertex
i;j ð Þ 2Z2
þ within their alignment graph. Define the edge
maximum score En¼ max max0≤i≤nSi;n;max0≤j≤nSn;j
. Let κ0¼Eκ0¼0 and κi¼ inffn:n>κi1;En>Eκi1g
for i≥1. We callκi theithSALE (strict ascending ladder epoch) andEκi theithSALE score. Let ΔEi:¼EκiEκi1,
the increment between the (i−1)thandithSALE scores. Let LIð Þ ¼y inf i:Si;j≥y;ð Þ 2i;j Z2þ
and LJð Þ ¼y inf j:Si;j≥y;ð Þ 2i;j Z2þ
. We also defineIn¼ inf i:Si;j¼
Eκn;ð Þ 2i;j Z2þgandJn¼ inf j:Si;j¼
Eκn;ð Þ 2i;j Z2þg. Let
ΔIi := Ii−Ii−1, the incremental sequence length between
(i−1)thandithSALEs in sequenceI, andΔJj:=Jj−Jj−1, the
incremental sequence length between (j−1)th and jth
SALEs in sequence J. Last, we define E½ΔIi:¼ EΔIieλEκi;κi<1, E ΔJj :¼E ΔJjeλEκj;κ
j<1
h i
, and EΔ
Ei
½ :¼EΔEieλEκi;κi<1.
The formulas for computingaI,aJ,αI,αJandσare:
aI ¼ lim i!1
EΔI
i
½
EΔ Ei
½ ;aJ ¼ lim j!1
E Δ Jj E ΔE
j
;
αI ¼ lim i!1
var½ΔIi EΔE
i
½ ;αJ ¼ lim j!1
var ΔIj E ΔE
j
;
σ¼ lim i!1
cov½ΔIi;ΔJi EΔE
i
½ ;
where var* and cov* represent the variance and covari-ance associated with the probability measure underlying
the expectation E. In practice, for computational effi-ciency, we use importance sampling to estimate the parameters above [15]. The parameters are estimated separately at each SALE. We then apply asymptotic re-gression to estimate the values of aI,aJ, αI, αJand σas i
!∞in the equation above [22].
Competing interests
The authors declare that they have no competing interests.
Authors’contributions
YP, TM and JS drafted the manuscript. YP designed thep-value evaluation method. SS implemented the new finite-size correction. NM integrated the correction into the BLAST+ code, ran tests, and calculated the ROC scores. JS devised the new finite-size correction. YP and SS are equal contribution first authors for this article. TLM and JLS are equal contribution last authors for this article. All authors read and approved the final manuscript.
Acknowledgements
We thank Greg Boratyn for help in running the accuracy evaluations with the SCOP set. This research was supported by the intramural research program of the NIH, National Library of Medicine.
Received: 30 March 2012 Accepted: 16 May 2012 Published: 12 June 2012
References
1. Karlin S, Altschul SF:Methods for assessing the statistical significance of molecular sequence features by using general scoring schemes.Proc Natl Acad Sci U S A1990,87(6):2264–2268.
2. Galambos J:The asymptotic theory of extreme order statistics. New York: Wiley; 1978.
3. Mott R:Maximum-likelihood-estimation of the statistical distribution of Smith-Waterman local sequence similarity scores.Bull Math Biol1992,
54(1):59–75.
4. Waterman MS, Vingron M:Rapid and accurate estimates of statistical significance for sequence data base searches.Proc Natl Acad Sci U S A
1994,91(11):4625–4628.
5. Altschul SF, Gish W:Local alignment statistics.Methods Enzymol1996,
266:460–480.
6. Bundschuh R:Rapid significance estimation in local sequence alignment with gaps.J Comput Biol2002,9(2):243–260.
7. Chia N, Bundschuh R:A practical approach to significance assessment in alignment with gaps.J Comput Biol2006,13(2):429–441.
8. Newberg LA:Significance of gapped sequence alignments.J Comput Biol
2008,15(9):1187–1194.
9. Agrawal A, Brendel VP, Huang X:Pairwise statistical significance and empirical determination of effective gap opening penalties for protein local sequence alignment.Int J Computat Biol Drug Des2008,1(4):347–367. 10. Poleksic A:Island method for estimating the statistical significance of
profile-profile alignment scores.BMC Bioinformatics2009,10:112. 11. Ortet P, Bastien O:Where does the alignment score distribution shape
come from?Evol Bioinformatics2010,6:159–187.
12. Agrawal A, Huang X:Pairwise statistical significance of local sequence alignment using sequence-specific and position-specific substitution matrices.IEEE/ACM Trans Comput Biol Bioinformatics2011,8(1):194–205. 13. Altschul SF:Evaluating the statistical significance of multiple distinct local
alignments. InTheoretical and computational methods in genome research. Edited by Suhai S. New York: Plenum Press; 1997:1–14.
14. Altschul SF, Madden TL, Schaffer AA, Zhang J, Zhang Z, Miller W, Lipman DJ:
Gapped BLAST and PSI-BLAST: a new generation of protein database search programs.Nucleic Acids Res1997,25(17):3389–3402.
15. Park Y, Sheetlin S, Spouge JL:Estimating the gumbel scale parameter for local alignment of random sequences by importance sampling with stopping times.Ann Stat2009,37(6A):3697–3714.
16. Asmussen S:Applied probability and queues. New York: Springer; 2003. 17. Altschul SF, Bundschuh R, Olsen R, Hwa T:The estimation of statistical
parameters for local alignment score distributions.Nucleic Acids Res2001,
18. Hartmann AK:Sampling rare events: statistics of local sequence alignments.Phys Rev E2002,65(5). doi:10.1103/PhysRevE.65.056102. 19. Chandonia JM, Hon G, Walker NS, Lo Conte L, Koehl P, Levitt M, Brenner SE:
The ASTRAL Compendium in 2004.Nucleic Acids Res2004,32:D189–D192. 20. Murzin AG, Brenner SE, Hubbard T, Chothia C:SCOP - a structural
classification of proteins database for the investigation of sequences and structures.J Mol Biol1995,247(4):536–540.
21. Schaffer AA, Aravind L, Madden TL, Shavirin S, Spouge JL, Wolf YI, Koonin EV, Altschul SF:Improving the accuracy of PSI-BLAST protein database searches with composition-based statistics and other refinements. Nucleic Acids Res2001,29(14):2994–3005.
22. Sheetlin S, Park Y, Spouge JL:Objective method for estimating asymptotic parameters, with an application to sequence alignment.Phys Rev E2011,
84(3). doi:10.1103/PhysRevE.84.031914.
doi:10.1186/1756-0500-5-286
Cite this article as:Parket al.:New finite-size correction for local
alignment score distributions.BMC Research Notes20125:286.
Submit your next manuscript to BioMed Central and take full advantage of:
• Convenient online submission
• Thorough peer review
• No space constraints or color figure charges
• Immediate publication on acceptance
• Inclusion in PubMed, CAS, Scopus and Google Scholar
• Research which is freely available for redistribution