Abstract
Background:Spatial gene expression quantification is required for modeling gene regulation in developing organisms. The fruit flyDrosophila melanogasteris the model system most widely applied for spatial gene
expression analysis due to its unique embryonic properties: the shape does not change significantly during its early cleavage cycles and most genes are differentially expressed along a straight axis. This system of development is quite exceptional in the animal kingdom.
In the sea anemoneNematostella vectensisthe embryo changes its shape during early development; there are cell divisions and cell movement, like in most other metazoans.Nematostellais an attractive case study for spatial gene expression since its transparent body wall makes it accessible to various imaging techniques.
Findings:Our new quantification method produces standardized gene expression profiles from raw or annotated
Nematostella in situhybridizations by measuring the expression intensity along its cell layer. The procedure is based on digital morphologies derived from high-resolution fluorescence pictures. Additionally, complete descriptions of nonsymmetric expression patterns have been constructed by transforming the gene expression images into a three-dimensional representation.
Conclusions:We created a standard format for gene expression data, which enables quantitative analysis ofin situ
hybridizations from embryos with various shapes in different developmental stages. The obtained expression profiles are suitable as input for optimization of gene regulatory network models, and for correlation analysis of genes from dissimilarNematostellamorphologies. This approach is potentially applicable to many other metazoan model organisms and may also be suitable for processing data from three-dimensional imaging techniques.
Keywords:Nematostella vectensis, Gene expression quantification, Gene network modelling, Embryonic development, Embryo morphology
Findings Introduction
Spatial gene expression assays are a substantial tool for verifying predicted regulatory interactions and for predict-ing properties of misspredict-ing components in a regulation net-work [1,2]. Still, their largest potential is in inferring numerical models of regulatory interaction networks, which is demonstrated for the embryonic development of fruit fly Drosophila melanogaster. To perform accurate
simulations, the spatial gene expression patterns are digit-ally quantified and formatted to consistent profiles.
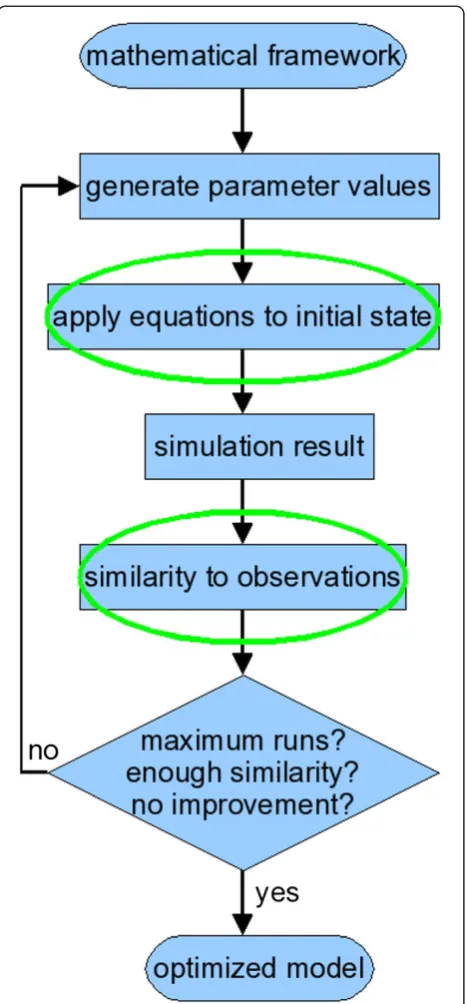
In systems biology, computational tools have become indispensable for deriving and validating gene regulation networks [3]. In data-driven modeling, parameter esti-mation can determine which set of rules represents the best network model to match a set of observations. Figure 1 shows an overview of the modeling cycle. First, a general mathematical framework is selected. The gene circuit model [4,5] (which is derived from the connec-tionist model [6]) is a convenient formalism that does not require knowledge about interactions or their mechanisms. The actual modeling starts with choosing parameter values for the general equations; the initial * Correspondence:[email protected]
Section Computational Science, University of Amsterdam, Science Park 904, 1098 XH, Amsterdam, The Netherlands
parameters are defined by the user or generated by an algorithm. The resulting equations are applied to the concentration profiles at the first timepoint, derived from experimental data. This simulation produces con-centration profiles at various timepoints. The simulated profiles are compared with observed expression profiles and the similarity is calculated with a predefined fitness measure. An optimization algorithm then picks new par-ameter values and starts a new simulation cycle. The optimization process ends when a stopping criterion is
reached, such as a fixed time duration or number of cycles, a satisfactory fitness or a series of cycles without significant fitness improvement. The output is the set of parameters that define the equations which represent the observed gene expression profiles best.
In any modeling approach, meaningful results require accurate reference data to initiate the simulation and to evaluate the simulation output. For gene regulation net-works, this means that gene expression patterns should be quantified in a consistent manner. A digital quantifi-cation procedure has been created and validated for the fruit fly [7].
Gene expression in Drosophila is quantified along a straight line during superficial cleavage. In this stage, nu-clei are dividing within a single cell membrane and the embryo’s outline does not change significantly. In most other animals however, nuclear division is coupled to cell division during cleavage and the early embryo dis-plays rapid cell movement and morphological changes. This is why we developed a method for gene expression quantification that accounts for a complex and changing embryo morphology.
Over the past decade,Nematostellahas become an im-portant model organism in the field of evolutionary devel-opmental biology [8]. As a research object, the animal is easy to culture and its small size and transparent body wall make it suitable for all kinds of microscopy. Subsequent gene expression studies and the sequencing of the genome have shown that Nematostella, curiously, shares more genes with humans than either Drosophila melanogaster or C. elegans [9]. Much work on Nematostella has been dedicated to the genetic regulation of development [10].
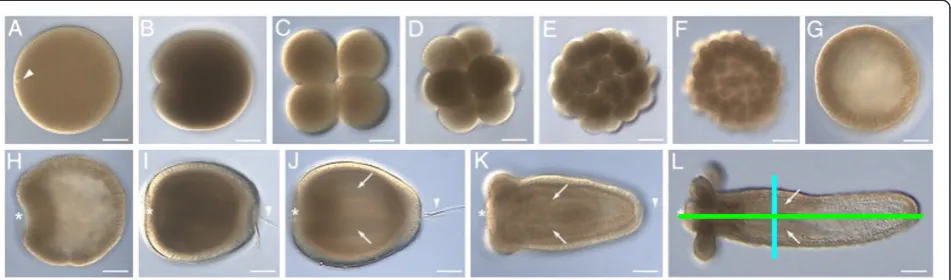
[image:2.595.58.292.87.590.2]The early developmental stages of Nematostella vec-tensis are displayed in Figure 2 (adapted from [11]). The Nematostella body wall consists of an outer cell layer (ectoderm) and an inner layer (endoderm). We are pri-marily concerned with the invagination process called gastrulation, when the presumptive endoderm moves
inwards and covers the ectoderm. The side of invagin-ation is the locinvagin-ation of the future mouth and is therefore referred to as the oral pole; the opposite side is the aboral pole. Nematostella displays bilateral symmetry: the line between the oral and aboral ends is the primary axis, while the line through the primary septa defines the secondary axis (the green and blue lines, respect-ively, drawn on Figure 2L).
In this paper we discuss a geometric method for extracting quantitative spatio-temporal gene expression data from in situ hybridizations in the sea anemone Nematostella vectensis. We measure gene expression during gastrulation using a gene expression quantifica-tion tool developed by de Jong [12]. We show in some preliminary results how this information can be analysed in a cluster analysis.
Results
Gene expression quantification
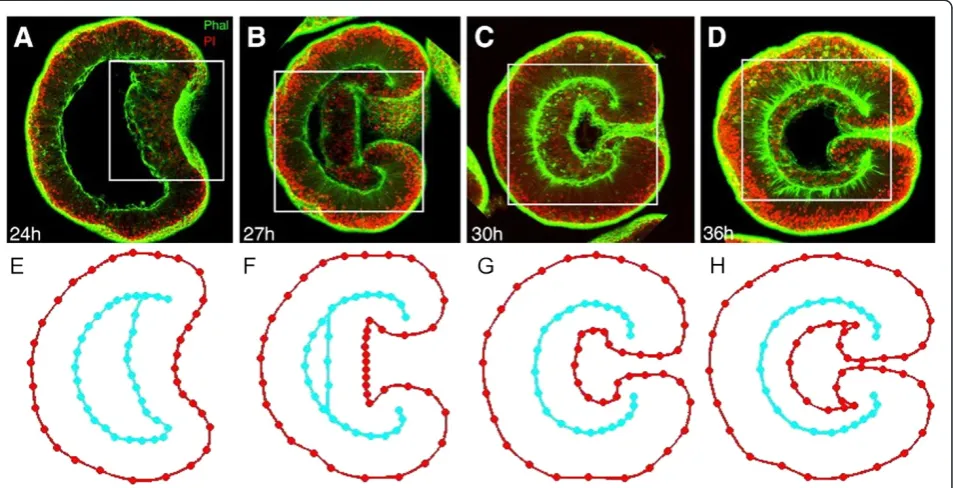
Microscopy images accentuate cell layer outlines of Nematostellaembryos stained for nuclei and filamentous actin (Figure 3A-D, copied from [13]). The latter is bound to the membrane as part of the cell cortex, so it highlights cellular shapes. From these images, average embryo morphologies have been derived for various stages of gastrulation (Figure 3E-H). An embryo geom-etry is derived from a confocal microscopy image (such as Figure 3A) by placing nodes on the cell layer bound-aries. Node locations from multiple (2 to 5) geometries are averaged to obtain an average embryo geometry (such as Figure 3E). This averaging reduces the effect of local irregularities, as the average geometry is supposed representative for embryos of a particular age. Strategic
points are picked to define a shape suitable for interpolation with the geometry in the subsequent stage. Interpolation of these average morphologies results in a continuous range of embryo morphologies.
In the following example, these graphical shapes are ap-plied to quantify gene expression patterns with the GEN-EXP program (Additional file 1). Published Nematostella gene expression images are collected in the CnidBase [14] and Kahi Kai [15] databases, and Kahi Kai also contains ex-pression images outside journal publications. Still, many Nematostellaexpression pictures are found in publications outside these databases.
[image:3.595.63.539.90.230.2]Example 1: a 1D expression profile from a symmet-rical pattern Figure 4A (adapted from [16]) displays an Nvnos2 in situhybridization in a late gastrula. The tran-scripts were hybridized with digoxigenin-labeled RNA probes. The published image is overlaid with the most similar morphology. The graphical geometry is then adjusted to the outline of this particular embryo by drag-ging the nodes to their final location (Figure 4B). The nodes are connected by a curve (about 105points) calculated with cubic spline interpolation [17]. The geometry is automatic-ally decomposed into parallel segments along the cell layer and color intensities are measured for all segments. The de-composition is performed by dividing the outer curve into sections with a user-defined length and calculating the nearest point on the inner spline for each boundary. This is repeated for the inner curve at sections with large gaps. The decomposition is finished by smoothening the bound-ary points on both curves to obtain segments that are more uniformly spaced. For the expression profile the red, green and blue color intensities of all pixels enclosed within a
segment are averaged. These average intensities are plotted against the position on the line through the segments’ cen-ters. To make an increasing intensity indicate an increase in concentration, the colors are inverted in Figure 4C and the corresponding intensities along the cell layer are displayed in Figure 4D.
The graph in Figure 4D contains features that do not represent the actual transcript concentration. The “en” and “ec”annotations cause a trough (orange arrow) and a ridge (green arrow), respectively, while an imperfect decomposition has shifted the peaks with regard to the center and introduced some noise (blue arrows). More-over, the nonuniform background and nonsymmetric lighting cause an asymmetric baseline. The profile is exported to an editor for additional processing to correct for these features. To remove artefacts caused by anno-tations, the user selects this section of the graph and can choose among linear interpolation, cubic spline interpolation, piecewise cubic Hermite interpolation [17] and replacement with a specified constant. Noise from erroneous decomposition is smoothened with a lowpass filter (with filter coefficients equal to the reciprocal of the span), known as ‘moving average’ [18]. The graph is lowered with a constant value to subtract the average background and regions without observed expression are put to zero. Both halves are averaged to cancel non-symmetric influences. The final expression profile is plotted in Figure 4E.
Three-dimensional expression pattern reconstruction
For expression patterns that are radially symmetrical around the primary axis, a one-dimensional profile is a complete description. However, most signaling pathways involve genes that are asymmetrically expressed along the secondary axis. A three-dimensional representation is required to fully define the expression pattern of these genes. Depending on the data available for a gene ex-pression pattern, a suitable method is determined for the approximation of this 3D pattern.
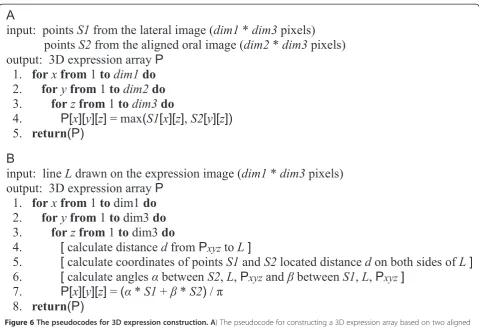
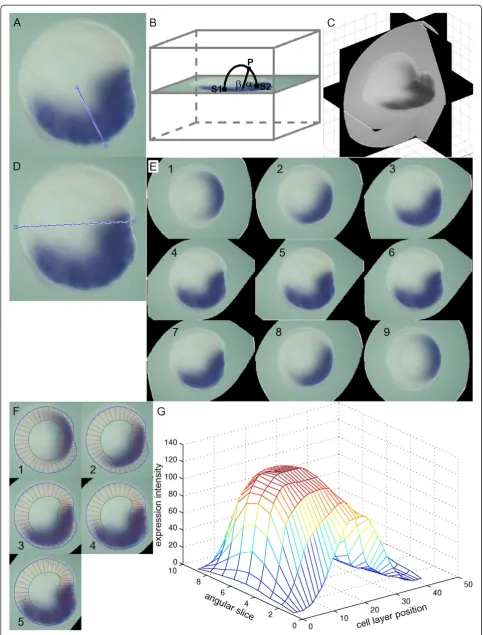
If a set of perpendicular expression images shows that an expression pattern is not radially symmetrical, then a 3D representation is constructed by mixing both images into a three-dimensional array (Figure 5C) with the TWOVIEWS program (Additional file 1). With points S1 on a lateral view in thex,zplane and pointsS2on an oral view in the y,zplane, the pointsPin the 3D array are defined by the al-gorithm in Figure 6A. Otherwise a radial expression pat-tern symmetry is assumed, and a 3D representation is created by smoothly averaging pairs of points on the image along circular arcs about an approximate axis of symmetry (Figure 7B) with the TWOVIEWS program (Additional file 1). The pseudocode for this operation is displayed in Figure 6B.
[image:4.595.62.539.90.334.2]Example 2: a 3D representation from perpendicular embryo views Figure 5A,B (adapted from [19]) shows the expression pattern of gene NvFoxB, which is
Figure 3Designing graphical embryo geometries from confocal microscopy images ofNematostella vectensis.A-D) Fluorescent
concentrated on two spots on opposite sides of the oral end. Two sets of reference points are picked to scale and align both pictures. The height of the oral image is adjusted to match these points in the lateral image.
Elements for the 3D array that represents the volumetric expression pattern are calculated as the minimum expression from the associated pair of pixels (Figure 5C). A greyscale
visualization of this array is displayed in Figure 5D. Two domains appear in the oral region as expected.
The 3D array is an intermediate step in the quantifica-tion process that is completed for the next example.
[image:5.595.58.539.90.498.2]Example 3: a 2D expression landscape from a single embryo view Figure 7A (based on [16]) shows the
expression ofNvvas2 in the early gastrula stage. The ex-pression domain covers the embryo’s lower half and its fu-ture mouth. A line is drawn on the image that divides the expression domain. Each element in the 3D array is the weighted average of the image pixels at both ends of a cir-cular arc around this line (Figure 7B,C).
This discrete volumetric expression array is not yet sui-ted to be compared to other patterns, because their shapes do not match or their cell layers are located at different Cartesian positions. To arrive at consistent profiles, slices are cut through the primary axis and decomposed. The pri-mary axis is drawn on the original image and slices of the 3D array through this axis are constructed (Figure 7D,E). These slices are overlaid with a geometry that fits the native image (Figure 7F) and through the decomposition proced-ure described in the one-dimensional example, a set of pro-files is produced. These propro-files are stacked in a 2D array and displayed as a landscape in Figure 7G.
Visualization and clustering
The profiles are easily interpolated and stored in arrays of equal length. Such a collection of standardized arrays can
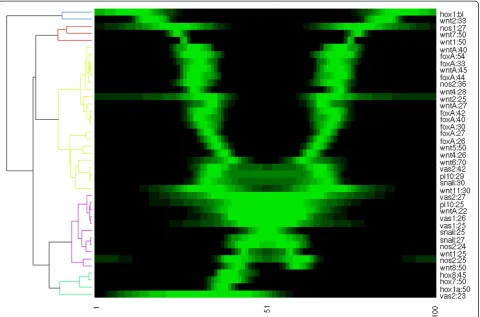
serve as input for conventional comparison and analysis software. For example, Figure 8 shows 41 1D expression profiles from 20 genes, ordered with hierarchical cluster-ing. In this fashion, a database is conveniently displayed and correlating patterns can be identified at a glimpse.
From the cluster tree, the patterns are divided in three main groups, and five individuals with little similarity. In green, all four asymmetric expression patterns are included. The purple patterns are restricted to the endoderm. The yel-low group is the largest, containing genes that are expressed in the presumptive pharynx and mouth. The remaining genes are expressed in ectoderm away from the mouth.
The clustering displayed in Figure 8 might be somewhat artificial as the expression domains clearly overlap. More-over, some regions are elongating faster during gastrula-tion than others and even after pinning the estimated endoderm-ectoderm boundary, stationary patterns such as NvFoxA seem to migrate. Still, the comparison is very helpful in observing correlations and proposing hypoth-eses. For example, the three main groups may indicate regulatory modules. More specific, the patterns with broad boundaries belong to embryos in a relatively early stage, indicating a regulatory cascade in which fuzzy domain boundaries are sharpened, comparable to theDrosophila gap genes. An extended and systematic set of profiles would enable an inference of the developmental gene regulation network inNematostella, based on the model-ing techniques and analyses that established many proper-ties of theDrosophilagap gene network [20-22].
Discussion
Our quantification procedure provides a standardized format for the most diverse spatial visualization techni-ques. In this paper, hybridized mRNA has been quanti-fied, but the method can be applied to any specific molecular entity. Potential examples include native pro-teins visualized with antibody staining and overexpressed proteins fused to a fluorescent agent [11,23].
Current limitations arise from the strong assumptions imposed on the images that are used to construct 3D repre-sentations. For a rotated pattern, it is formally assumed that only expression in the plane of dissection is visible, while in fact observed expression is not restricted to this plane.
More serious is the requirement that the embryos used for the reverse projection are completely transparent, while the endoderm and aboral ectoderm are hidden on most oral images. Sometimes, only the cumulative signal on the periphery of an expression region is detected, as in Figure 5A (the speckled region at the arrow and on the opposite side).
[image:6.595.57.291.87.283.2]The embryo is also assumed to be viewed from exactly perpendicular angles, but the sample is often rotated imperfectly. Additionally, slight deformations can occur during rotation, causing small domains
Figure 5A three-dimensional array constructed from perpendicularNematostellaembryo views. A,B)NvFoxB
with granular expression to overlap improperly and thus to be misrepresented. These issues are observed in Figure 5 as well.
With the advance of direct three-dimensional imaging the volumetric array construction may become superflu-ous, and these limitations will be removed. Confocal laser scanning microscopy has already been applied to zebrafish [24], Drosophila [25] and sea urchin [26] embryos. This method may provide quantitative, spatial expression data for Nematostella as well. Conversely, general methods for mapping these data to the embryo’s morphology should be useful for comparison and ana-lysis in these other organisms.
Future developments
An integrated method has been presented that combines geometry extraction and gene expression quantification. The basic concept is that gene expression is conveni-ently measured along the cell layer in a morphology that can be viewed as a continuous sheet of cells. This straightforward approach can be applied generally to embryos across the animal kingdom. As confocal laser scans with high three-dimensional spatial resolution are
widely applied, application of this method is not limited to symmetrical body shapes.
We have shown how to extract quantified gene expres-sion profiles from Nematostella in situ hybridizations, and how a preliminary comparison and cluster analysis lead to new insights. The next step is to estimate para-meters that describe interactions among genes in the Nematostellaregulatory network. The powerful methods designed for parameter inference [4,5,20] and network analysis [21,22] inDrosophilacan now be applied to the standardized gene expression profiles of Nematostella vectensisand other model species in genetics.
[image:7.595.58.538.86.413.2]Currently, a database of published images is processed into 1D arrays, annotated with roughly estimated devel-opment times based on comparison with high resolution micrographs. This comparison is very subjective, as our designation often differs from the developmental stage originally claimed. Moreover, the embryos change very subtly in the hollow sphere stage (Figure 2G) and be-tween invagination and septa formation (Figure 2I), so timestamps are highly ambiguous. If a gene or a combin-ation of genes is found with continuously changing ex-pression patterns, we can derive labelling protocols to
determine the exact developmental time. (Registration techniques like this have already been described and proved useful forDrosophila[27].)
Spatial gene expression quantification can be com-bined with modern quantitative polymerase chain
reaction (qPCR) techniques [28]. The absolute total amount of transcripts measured with qPCR coupled to the spatial distribution from quantified in situ images should enable the calculation of absolute local mRNA concentrations.
dimensional profiles is done in a similar fashion as in example 1 (main text).
[image:9.595.59.540.316.633.2]Availability and requirements Project name
BioPreDyn (new bioinformatics methods and tools for data-driven predictive dynamic modelling in biotechno-logical applications)
Project home page www.biopredyn.eu. Operating system(s) Linux, Windows, MacOS. Programming language Matlab. Other requirements None. License None.
Any restrictions to use by non-academics None.
Additional file
Additional file 1:Matlab programs:“genexp.m”for cell layer decomposition of gene expression images and profile editing;
“oneview.m”for a 2D gene expression array from a single decomposed image;“twoviews.m”for a 2D array from a
decomposed image and perpendicular view.Supporting files: Matlab user interface“genexp.fig”(necessary to run“genexp.m”); directory
“embryodata”containing geometry definitions; directory“functions” containing Matlab functions used in the main programs. Matlab script:
“stanpro.m”for creating a standardized 1D array from a GENEXP profile figure. Manuals:“readme_genexp.m”for GENEXP program;
“readme_oneview.m”for ONEVIEW program;“readme_twoviews.m”for TWOVIEWS program.
Competing interests
The authors declare that they have no competing interests.
Authors’contributions
All authors participated in the design of the study, and wrote the manuscript together. DB conducted the analysis of data and simulations, and made the figures. All authors read and approved the final manuscript.
Acknowledgements
Daniel Botman was funded by the FP7 project BioPreDyn. We would like to thank Mark Martindale (Kewalo Marine Laboratory, University of Hawaii) for allowing us to use the pictures shown in Figure 3.
Received: 15 March 2012 Accepted: 26 September 2012 Published: 5 October 2012
References
1. Li E, Davidson EH:Building developmental gene regulatory networks. Birth Defects Res C Embryo Today2009,87:123–130.
2. Chan TM, Longabaugh W, Bolouri H, Chen HL, Tseng WF, Chao CH, Jang TH, Lin YI, Hung SC, Wang HD, Yuh CH:Developmental gene regulatory networks in the zebrafish embryo.Biochim Biophys Acta2009,
1789:279–298.
3. de Jong H:Modeling and simulation of genetic regulatory systems: a literature review.J Comput Biol2002,9:67–103.
4. Reinitz J, Sharp DH:Mechanism of eve stripe formation.Mech Dev1995,
49:133–158.
5. Jaeger J, Surkova S, Blagov M, Janssens H, Kosman D, Koslov KN, Manu, Myasnikova E, Vanario-Alonso CE, Samsonova M, Sharp DH, Reinitz J:
Dynamic control of positional information in the early Drosophila embryo.Nature2004,430:368–371.
6. Mjolsness E, Sharp DH, Reinitz J:A connectionist model of development.J Theor Biol1991,152:429–453.
7. Janssens H, Kosman D, Vanario-Alonso CE, Jaeger J, Samsonova M, Reinitz J: A high-throughput method for quantifying gene expression data from early Drosophila embryos. Dev Genes Evol
2005, 215:374–381.
8. Darling JA, Reitzel AR, Burton PM, Mazza ME, Ryan JF, Sullivan JC, Finnerty JR:Rising starlet: the starlet sea anemone, Nematostella vectensis. BioEssays2005,27:211–221.
9. Putnam NH, Srivastava M, Hellsten U, Dirks B, Chapman J, Salamov A, Terry A, Shapiro H, Lindquist E, Kapitonov VV, Jurka J, Genikhovich G, Grigoriev IV, Lucas SM, Steele RE, Finnerty JR, Technau U, Martindale MQ, Rokhsar DS:
Sea anemone genome reveals ancestral eumetazoan gene repertoire and genomic organization.Science2007,317:86–94.
10. Byrum CA, Martindale MQ: Gastrulation in the Cnidaria and the Ctenophora. In Gastrulation: From Cells to Embryo. Edited by Stern CA. Cold Spring Harbor: Cold Spring Harbor Laboratory Press; 2004:33–50.
11. Lee PN, Kumburegama S, Marlow HQ, Martindale MQ, Wikramanayake AH:
Asymmetric developmental potential along the animal-vegetal axis in the antozoan cnidarian, Nematostella vectensis, is mediated by Dishevelled.Dev Biol2007,310:169–186.
12. de Jong J:Quantitative analysis of gene expression in Nematostella vectensis. Section Computational Science: MSc thesis. University of Amsterdam; 2009. 13. Magie CR, Daly M, Martindale MQ:Gastrulation in the cnidarian
Nematostella vectensis occurs via invagination not ingression.Dev Biol
2007,305:483–497.
14. Cnidarian Evolutionary Genomics Database.http://www.cnidbase.org/ index.cgi.
15. Comparative Marine Invertebrate Gene Expression Database.
www.kahikai.org/index.php?content=genes.
16. Extavour CG, Pang K, Matus DQ:Martindale MQ: vasa and nanos expression patterns in a sea anemone and the evolution of bilaterian germ cell specification mechanisms.Evol Dev2005,
7:201–215.
17. MathWorks Documentation Center.http://www.mathworks.com/help/ matlab/ref/interp1.htm.
18. MathWorks Documentation Center.http://www.mathworks.com/help/ curvefit/smooth.htm.
19. Magie CR, Pang K, Martindale MQ:Genomic inventory and expression of Sox and Fox genes in the cnidarian Nematostella vectensis.Dev Genes Evol2005,215:618–630.
20. Fomekong-Nanfack Y, Kaandorp JA, Blom J:Efficient parameter estimation for spatio-temporal models of pattern formation: case study of Drosophila melanogaster.Bioinformatics2007,
23:3356–3363.
21. Fomekong-Nanfack Y, Postma M, Kaandorp JA:Inferring Drosophila gap gene regulatory network: a parameter sensitivity and perturbation analysis.BMC Syst Biol2009,3:94.
22. Fomekong-Nanfack Y, Postma M, Kaandorp JA:Inferring Drosophila gap gene regulatory network: pattern analysis of simulated gene expression profiles and stability analysis.BMC Res Notes2009,2:256.
23. Wikramanayake AH, Hong M, Lee PN, Pang K, Byrum CA, Bince JM, Xu R, Martindale MQ:An ancient role for nuclear beta-catenin in the evolution of axial polarity and germ layer segregation.Nature2003,
426:446–450.
24. Welten MCM, de Haan SB, van den Boogert N, Noordermeer JN, Lamers GEM, Spaink HP, Meijer AH, Verbeek FJ:ZebraFISH: fluorescent in situ hybridization protocol and three-dimensional imaging of gene expression patterns.Zebrafish2006,3:465–476.
25. Luengo Hendriks CL, Keränen SV, Fowlkes CC, Simirenko L, Weber GH, DePace AH, Henriquez C, Kaszuba DW, Hamann B, Eisen MB, Malik J, Sudar D, Biggin MD, Knowles DW:Three-dimensional morphology and gene expression in the Drosophila blastoderm at cellular resolution I: data acquisition pipeline.Genome Biol2006,7:R123.
26. Flynn CJ, Sharma T, Ruffins SW, Guerra SL, Crowley JC, Ettensohn CA: High-resolution, three-dimensional mapping of gene expression using GeneExpressMap (GEM).Dev Biol2011,357:532–540.
Submit your next manuscript to BioMed Central and take full advantage of:
• Convenient online submission
• Thorough peer review
• No space constraints or color figure charges
• Immediate publication on acceptance
• Inclusion in PubMed, CAS, Scopus and Google Scholar
• Research which is freely available for redistribution

![Figure 5 A three-dimensional array constructed fromand scale the oral imageexpression in the early larva appears focused on two spots aroundthe oral pole (original images from [19])](https://thumb-us.123doks.com/thumbv2/123dok_us/8278349.282714/6.595.57.291.87.283/figure-dimensional-constructed-fromand-imageexpression-focused-aroundthe-original.webp)