R E S E A R C H A R T I C L E
Open Access
Identification and validation of quantitative
real-time reverse transcription PCR reference
genes for gene expression analysis in teak
(Tectona grandis
L.f.)
Esteban Galeano, Tarcísio Sales Vasconcelos, Daniel Alves Ramiro, Valentina de Fátima De Martin
and Helaine Carrer
*Abstract
Background:Teak (Tectona grandisL.f.) is currently the preferred choice of the timber trade for fabrication of woody products due to its extraordinary qualities and is widely grown around the world. Gene expression studies are essential to explore wood formation of vascular plants, and quantitative real-time reverse transcription PCR (qRT-PCR) is a sensitive technique employed for quantifying gene expression levels. One or more appropriate reference genes are crucial to accurately compare mRNA transcripts through different tissues/organs and experimental conditions. Despite being the focus of some genetic studies, a lack of molecular information has hindered genetic exploration of teak. To date, qRT-PCR reference genes have not been identified and validated for teak.
Results:Identification and cloning of nine commonly used qRT-PCR reference genes from teak, includingribosomal protein 60s(rp60s), clathrin adaptor complexes medium subunit family(Cac), actin(Act), histone 3(His3), sand family(Sand), β-Tubulin(Β-Tub), ubiquitin(Ubq), elongation factor 1-α(Ef-1α),andglyceraldehyde-3-phosphate dehydrogenase(GAPDH). Expression profiles of these genes were evaluated by qRT-PCR in six tissue and organ samples (leaf, flower, seedling, root, stem and branch secondary xylem) of teak. Appropriate gene cloning and sequencing, primer specificity and amplification efficiency was verified for each gene. Their stability as reference genes was validated by NormFinder, BestKeeper, geNorm and Delta Ct programs. Results obtained from all programs showed thatTgUbqandTgEf-1αare the most stable genes to use as qRT-PCR reference genes andTgActis the most unstable gene in teak. The relative expression of the teakcinnamyl alcohol dehydrogenase(TgCAD) gene in lignified tissues at different ages was assessed by qRT-PCR, usingTgUbqandTgEf-1αas internal controls. These analyses exposed a consistent expression pattern with both reference genes.
Conclusion:This study proposes a first broad collection of teak tissue and organ mRNA expression data for nine selected candidate qRT-PCR reference genes. NormFinder, Bestkeeper, geNorm and Delta Ct analyses suggested that TgUbqandTgEf-1αhave the highest expression stability and provided similar results when evaluatingTgCADgene expression, while the commonly usedActshould be avoided.
Keywords:Relative expression, Trees, Transcript stability, Lignin
* Correspondence:[email protected]
Departamento de Ciências Biológicas, Escola Superior de Agricultura“Luiz de Queiroz”, Universidade de São Paulo, Av. Pádua Dias, 11, Piracicaba, SP 13418-900, Brazil
© 2014 Galeano et al.; licensee BioMed Central Ltd. This is an Open Access article distributed under the terms of the Creative Commons Attribution License (http://creativecommons.org/licenses/by/4.0), which permits unrestricted use, distribution, and reproduction in any medium, provided the original work is properly credited. The Creative Commons Public Domain Dedication waiver (http://creativecommons.org/publicdomain/zero/1.0/) applies to the data made available in this article, unless otherwise stated.
Background
The flux of information from DNA to protein is con-nected by mRNA, and the level of mRNA transcription is one of the factors determining the degree of gene ex-pression [1]. Changes in gene exex-pression are critical for cell development [2], integration of metabolism [3] and resistance to biotic and abiotic stresses [4,5], and as such are a research area of great interest to the fields of medi-cine, pharmacy, life sciences and agronomy.
Methods currently available for gene expression assess-ment include microarray analysis, Northern blotting, in situ hybridization, RNase protection assay, RNA sequen-cing (RNA-seq), qualitative RT-PCR, competitive RT-PCR, and quantitative real-time reverse transcription RT-PCR (qRT-PCR). The qRT-PCR is considered an efficient, safe (free of radioactive reagents), fast, affordable, reproducible, reliable and specific for quantifying levels of transcripts [6]. However, some variables such as the integrity, amount and purity of the RNA used as well as enzyme efficiency during cDNA synthesis and PCR amplification make an additional step to normalize the data necessary [7]. Normalization re-quires the use of one or more reference genes (also called internal control genes) for which expression is constant and stable at different developmental stages, nutritional conditions or experimental conditions [8]. Unfortunately, a gene has not been found for which expression is absolutely stable under all circumstances or across species that can be used indiscriminately for qRT-PCR analysis.
Bioinformatics tools have been developed to assess and identify the most suitable reference genes for qRT-PCR data normalization. geNorm shows expression sta-bility throughout a set of housekeeping candidates [9], the Normfinder algorithm chooses the best candidate reference genes according to its calculations [10], while the Excel-based tool called BestKeeper determines the best candidate of pair-wise correlations [11]. Other stat-istical approaches used include Delta Ct [12] and “Stabil-ity index”methods [13].
Reference genes commonly used that present sufficiently stable expression are those related to cell maintenance such as actin, tubulin, glyceraldehy3-phosphate de-hydrogenase,elongation factor 1-αand18S ribosomal RNA [8,14]. New genes have been studied as internal controls in model or commercial plants, such as Arabidopsis[15], Populus[16] andBrachypodium[17]. Tests for the selec-tion of reference genes for qRT-PCR in teak have not been published yet.
Teak is a deciduous tree, native to countries of southeast Asia such as Myanmar, Thailand, India, Laos and Java [18]. Its wood is known internationally for its beauty, weightlessness, durability and weather resistance and it is used in the building of ships, furniture, house floors and walls, and general carpentry [19,20]. Currently, the wood market has a great interest in teak extractives such as
naphthoquinones and anthraquinones, which have shown remarkable antifungal and antitermitic effect [21,22]. Add-itionally, teak populations serve significant environmental roles, as they can be used in agroforestry systems and for-est recovery [22]. These characteristics make teak one of the most widely grown and economically profitable trees around the world [23]. Despite the great economic im-portance of teak, there are no studies of gene expression, the genome sequence is not available and sequenced genes are limited.
To select suitable qRT-PCR internal control genes for teak, this study analyzed the expression levels of candidate reference genes in different tissues and organs such as leaves, flowers, seedlings, roots, stem and branch second-ary xylem of trees. Eight candidate reference genes were identified by their orthologous genes in model plants. These candidates were cloned, sequenced and tested. The selected genes are involved in different biological functions such as the formation of cellular cytoskeleton (Actin and
β-Tubulin), elongation phase of translation (Elongation factor 1-α), DNA packaging (Histone 3) protein modifica-tion (Ubiquitin), intracellular transport (Clathrin adaptor complexes medium subunit family), vesicular transport (SAND family), protein biosynthesis (Ribosomal protein 60s) and carbohydrate metabolism ( Glyceraldehyde-3-phos-phate dehydrogenase).
Finally, in order to validate our results, the most stable reference genes were used to assess theTgCADgene ex-pression levels in different tissues and organs.
Results
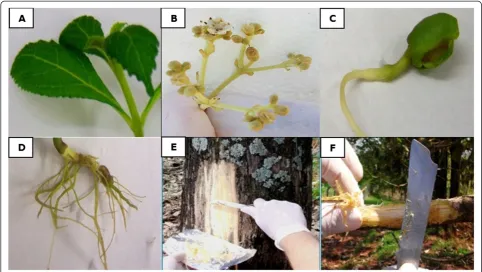
Normalization of gene expression experiments, especially of qRT-PCR using a set of reference genes is currently a critical procedure when analyzing expression levels of tar-get genes in different tissues or under different conditions. In the present study, nine potential reference genes for qRT-PCR of teak were assessed. A total of 36 cDNA sam-ples including several organ types (leaf, root, and flower) and secondary xylem tissues from stems and branches of different ages were analyzed (Figure 1).
Identification and cloning of references genes in teak
at least four sequences were used in the alignments. De-generate primers were designed to amplify the most con-served domains and at least 250 bp of the teak cDNA (Table 1, Additional file 2).
The degenerate primers were able to produce specific amplicons ranging from 271 to 1440 bp using cDNA of teak leaves as template (Table 1). After gel purification, PCR fragments were cloned into the pJET1.2/Blunt vec-tor (Thermo Scientific, USA) and transformed into DH5α™ competent cells (Life Technologies, USA). Re-combinant colonies were selected to extract plasmid DNA for sequencing.
The teak nucleotide identities were checked by BLAST [29] against NCBI non redundant sequences (http://
[image:3.595.56.539.89.361.2]blast.ncbi.nlm.nih.gov) and the results showed that all the clones contained the expected fragments. The most conserved genes were TgAct and TgEf-1α with 92% of similarity, followed byTgUbqandTgβ-Tubwith 91% and 87%, respectively (data not shown). All genes showed at least 79% of similarity. Translated amino acid sequences were obtained by Expasy Translation Tool (http://web. expasy.org/translate/) and used to check for the presence of the expected domains in Pfam Database (http://pfam. sanger.ac.uk). Thereafter, teak amino acid sequences were compared against NCBI protein sequences with the algorithm tBLASTn (http://blast.ncbi.nlm.nih.gov). Re-sults of the in silicoanalysis showed that all teak puta-tive protein sequences possess the predicted domains, Figure 1Teak tissue and organ sample set. A= leaf,B= flower,C= seedling,D= root,E= stem secondary xylem,F= branch secondary xylem.
Table 1 Candidate reference genes, primers used to amplify in teak and their PCR parameters
Gene symbol Gene name Primer sequences (5′-3′) forward/reverse* Tm (°C) Amplicon (bp)
rp60s Ribosomal protein 60S ATGGTGAAGTTCTTGAAGCC/TGGTTCTTTACCAAGCTC 55 399
Cac Clathrin adaptor complex AAGGATAACTTTGTCATTGT/TGGGAAATACATGAAGGCG 58 794
Act Actin GTTAGCAATTGGGATGATATGG/ATCCAGACACTGTACTTCCT 57 797
His3 Histone 3 ACNGGTGGAGTGAAGAAGCC/TCCTTGGGCATGATNGTNAC 61 275
Sand Sand family protein ATATATTCCAGATATGGAGATGA/TAYATGAAATGCCAAAGTCCA 55 941 Β-Tub Β-Tubulin ACNCARCAAATGTGGGATGC/TCCCCAGTGTACCARTGCAA 60 335
Ubq Ubiquitin TRACGGGNAAGACCATAAC/ACCTTCTTNTTCTTGTGCTT 56 271
Ef-1α Elongation factor 1-α CATCAACATTGTGGTCATTGG/CCAGANCGCCTGTCAATCTTG 55 1095 Degenerate bases are indicated in bold.
*Degenerate nucleotides used in some primers: N = any base, Y = C or T, R = A or G.
Galeanoet al. BMC Research Notes2014,7:464 Page 3 of 13
[image:3.595.57.540.588.717.2]presenting high similarity with the selected reference genes (Additional file 3). At protein level, the most con-served genes were TgAct, TgEf-1α, TgHis3, Tgβ-Tub and TgUbqpresenting 99% of similarity (data not shown).
Primer specificity and PCR efficiency
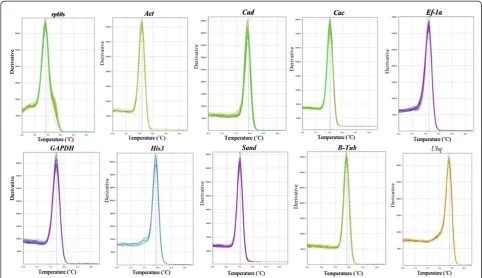
Real-time PCR primers (Table 2, Additional file 4) were designed to amplify the teak sequences of the eight clones (Tgrp60s, TgCac, TgAct, TgHis3, TgSand, Tgβ-Tub, TgUbq and TgEf-1α) and TgGAPDH(Table 2), and were used to detect transcript levels. Primer specificity was evaluated with a single peak in all ten melting curves (Figure 2) and as a single band in the agarose gel analysis (Additional file 5). qRT-PCR efficiency (E) varied from 91.4% for Tgrp60s to 108.5% forTgSandand correlation coefficients (R2) os-cillated from 98.2% for TgΒ-Tub to 99.9% for TgEf-1α (Table 2). The acceptable range for PCR efficiencies calcu-lated using standard curve serial dilution experiments is 90–110% (i.e. a slope between 3.1 and 3.58) [30]. The an-nealing temperature of 65°C was effective for all primers; nevertheless, its choice can impact on the efficiency of the reaction. Altogether, the results showed that the chosen primers accurately amplified the candidate refer-ence genes.
To compare the differences in transcript levels be-tween reference genes, the Cq range was determined and the coefficient of variance was calculated for each gene across all samples based on the interquartile range (25-75% percentiles). The average Cq values of the dif-ferent genes ranged from 22 to 34 cycles (Figure 3, Table 3). TgUbq, Tgβ-Tub and Tgrp60s showed the nar-rowest variance (lowest Cq dispersion), whileTgActand TgCac exhibited widest variance (highest dispersion). The gene with the most abundant transcript level was TgEf-1α while TgCac was the least abundant, reaching mean threshold fluorescence with 23 and 31 amplifica-tion cycles, respectively.
Expression stability of the nine candidate reference genes
To evaluate the reference genes’expression stability, four different methodologies were used: geNorm, NormFinder, BestKeeper and Delta Ct.
geNorm
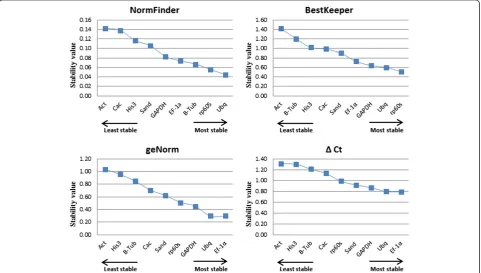
geNorm was used to rank the reference genes by calculating the gene expression stability valueM,which corresponds to the average pairwise variation (V) of a particular gene with all other control genes [9]. The most stable reference gene has the lowestMvalue, while the least stable has the highest M value. To identify reference genes with stable expres-sion, geNorm indicates genes with M values below the threshold of 1.5, however Vandesompele et al. [9] suggests Mvalues lower than 1.0 to ensure the selection of the most stable genes. When all 36 samples were analyzed together with geNorm (Figure 4), eight genes had M< 1.0, with TgUbqandTgEF1αshowing the highest expression stability (M= 0.295) in different tissues.Actwas the only gene with M > 1.0, with the lowest expression stability of 1.035.
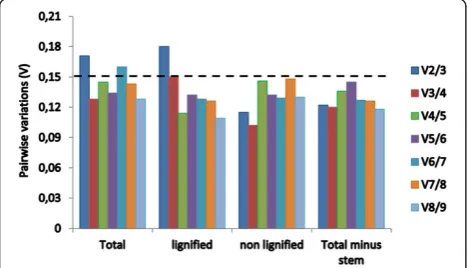
[image:4.595.56.540.571.733.2]To obtain reliable results from qRT-PCR studies, two or more reference genes should be used for data normalization. The optimal number of reference genes can be determined by calculating the pairwise variation (Vn/n+1) using the geNorm algorithm [9]. It is calculated between the two se-quential normalization factors (NF), NFnand NFn+1, for all the samples analyzed. Slight variations mean addition of another gene has a low effect on the normalization. Vande-sompele et al. [9] proposed 0.15 as the cut-off value for V, below which the inclusion of an additional control gene is not required. This means that if Vn/n+1< 0.15, it is not ne-cessary to use≥n + 1 reference genes for normalization. In this study, the paired variable coefficients indicated that the inclusion of the third reference gene (i.e. TgUbq, TgEF1αandTgGAPDH) would be useful for normaliza-tion when considering total samples and only lignified sam-ples, whereas two stable reference genes (TgGAPDH and
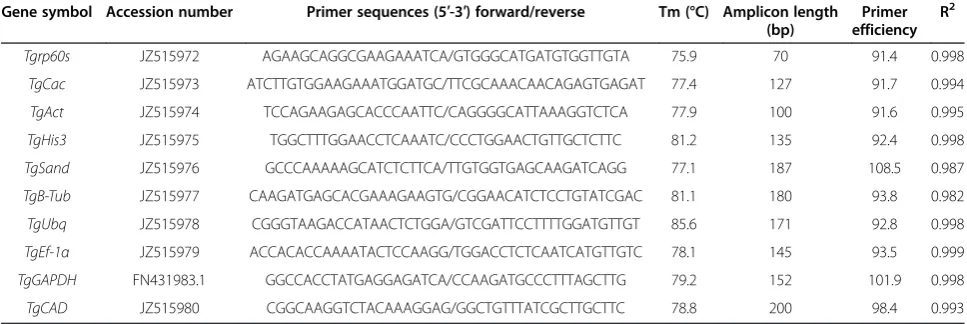
Table 2 Candidate reference genes,TgCADtarget gene, specific qRT-PCR primers and different parameters derived from qRT-PCR analysis
Gene symbol Accession number Primer sequences (5′-3′) forward/reverse Tm (°C) Amplicon length (bp)
Primer efficiency
R2
Tgrp60s JZ515972 AGAAGCAGGCGAAGAAATCA/GTGGGCATGATGTGGTTGTA 75.9 70 91.4 0.998
TgCac JZ515973 ATCTTGTGGAAGAAATGGATGC/TTCGCAAACAACAGAGTGAGAT 77.4 127 91.7 0.994
TgAct JZ515974 TCCAGAAGAGCACCCAATTC/CAGGGGCATTAAAGGTCTCA 77.9 100 91.6 0.995
TgHis3 JZ515975 TGGCTTTGGAACCTCAAATC/CCCTGGAACTGTTGCTCTTC 81.2 135 92.4 0.998
TgSand JZ515976 GCCCAAAAAGCATCTCTTCA/TTGTGGTGAGCAAGATCAGG 77.1 187 108.5 0.987
TgΒ-Tub JZ515977 CAAGATGAGCACGAAAGAAGTG/CGGAACATCTCCTGTATCGAC 81.1 180 93.8 0.982
TgUbq JZ515978 CGGGTAAGACCATAACTCTGGA/GTCGATTCCTTTTGGATGTTGT 85.6 171 92.8 0.998
TgEf-1α JZ515979 ACCACACCAAAATACTCCAAGG/TGGACCTCTCAATCATGTTGTC 78.1 145 93.5 0.999
TgGAPDH FN431983.1 GGCCACCTATGAGGAGATCA/CCAAGATGCCCTTTAGCTTG 79.2 152 101.9 0.998
Tgrp60s) can be employed when analyzing non-lignified tis-sues (Figure 5). However, if the samples of stem secondary xylem (the most lignified tissue) are excluded from the ana-lysis, two reference genes (TgUbq and TgEF1α) would be optimal for normalizing gene expression (Figure 6).
NormFinder
[image:5.595.56.539.89.367.2]NormFinder is a Microsoft Excel-based Visual Basic appli-cation that allows estimation of stability values of single candidate reference genes. The algorithm is based on intra-and inter-group variations intra-and combines both results into Figure 2Specificity of qRT-PCR amplification.Melting curves (dissociation curves) of the 10 amplicons (rp60s, Act, Cad, Cac, Ef-1α, GAPDH, His3, Sand, B-Tub, Ubqgenes) after the qRT-PCR reactions, all showing one peak.
Figure 3Expression levels of candidate reference genes in different plant samples.Expression data displayed as Cq values for each reference gene in allT. grandissamples. The horizontal lines of the box indicate the 25th and 75th quartiles. The central horizontal line across the box is depicted as the median. The whisker caps represent the maximum and minimum values. Dots represent outliers. Genes are in order from the most (lower Cq, on the left) to the least abundantly expressed (higher Cq, on the right).
Galeanoet al. BMC Research Notes2014,7:464 Page 5 of 13
[image:5.595.57.543.490.686.2]a stability value for each candidate reference gene [10]. The results of the NormFinder analysis were somewhat similar to those of geNorm. Both methods ranked TgUbq, TgEF1α and Tgrp60s as among the four most stable reference genes (Figure 5) andTgActandTgHis3 as the least stable (Figure 4). However,Tgβ-Tubemerged as the third most stably expressed using NormFinder, whereas it was ranked seventh by geNorm. These dis-crepant results could be explained due to inter-tissue
[image:6.595.57.545.99.253.2]expression variations detected by NormFinder ana-lysis, which is not take account for gene stability calcu-lations in the geNorm algorithm. When considering only intra-tissue variations, Tgβ–Tub was the most stable gene in lignified tissues (i.e. roots, branches and stems) (Table 4). However, in non-lignified tissues (leaves, flowers and seedlings) Tgβ–Tub was ranked eighth of nine genes, corroborating results obtained by geNorm.
Table 3 Descriptive statistics and expression level obtained by BestKeeper
Factor Tgrp60s TgSand TgAct TgCac TgGAPDH TgΒ-Tub TgHis3 TgUbq TgEf-1α
N 36 36 36 36 36 36 36 36 36
GM [CP] 28.59 29.92 26.21 31.05 25.63 29.59 28.24 26.77 23.45
AM [CP] 28.59 29.94 26.27 31.07 25.64 29.62 28.27 26.78 23.47
Min [CP] 27.52 28.08 24.15 28.71 24.21 28.00 26.31 25.99 22.50
Max [CP] 29.82 32.15 29.91 33.11 27.36 33.54 31.66 28.71 25.23
SD [±CP] 0.51 0.90 1.42 0.99 0.64 1.21 1.02 0.60 0.73
CV [%CP] 1.78 3.01 5.40 3.20 2.49 4.10 3.62 2.23 3.12
Min [x-fold] −1.99 −3.82 −3.84 −4.58 −2.72 −2.62 −3.53 −1.63 −1.79
Max [x-fold] 2.22 5.13 11.12 3.85 3.38 10.89 9.29 3.37 2.99
SD [±x-fold] 1.39 1.79 2.50 1.90 1.51 2.19 1.94 1.47 1.61
Abbreviations: N: number of samples; CP: crossing point; GM [CP]: geometric CP mean; AM [CP]:arithmetic CP mean; Min [CP] and Max [CP]: CP threshold values; SD [±CP]: CP standard deviation; CV [%CP]: variance coefficient expressed as percentage of CP level; Min [x-fold] and Max [x-fold]: threshold expression levels expressed as absolute x-fold over- or under-regulation coefficient; SD [±x-fold]: standard deviation of absolute regulation coefficient.
SD and CV are indicated in bold.
[image:6.595.58.540.423.696.2]BestKeeper
The Bestkeeper software was adopted for descriptive analysis. The program is an Excel-based software tool that estimates gene expression stability based on the co-efficient of correlation (r) between each reference gene and an index, defined as the geometric mean of all can-didate reference gene Ct (or CP) values [11]. The Best-Keeper also calculates the CP standard deviation (SD) and the coefficient of variance (CV) of each candidate gene. Reference genes with SD values >1 are considered not stable and should be avoided. Results of analysis are shown in Table 3. Similarly to geNorm and NormFinder, BestKeeper ranked Act andHis3 among the three least stable reference genes with SD values >1.0 (1.42 and 1.02 respectively). In addition, Tgβ–Tub presented un-stable expression with SD value of 1.21, being one of the
least stable genes as observed in the geNorm analysis (Figure 4). The best reference genes are those that have the lowest coefficient of variance and standard deviation. In this study,Tgrp60sandTgUbqhad CV ± SD values of 1.78 ± 0.51 and 2.23 ± 0.60, respectively, displaying a stable expression in all samples. The results of the Best-Keeper analysis showed a similar pattern of stability to those obtained from geNorm, which described TgUbq, Tgrp60s, TgEF1α and TgGAPDH as the four best refer-ence genes for the normalization of qRT-PCR data in teak. In the NormFinder analysis, TgGAPDH was re-placed byTgβ–Tubamong the top four regarding stabil-ity (Figure 4).
Delta Ct
[image:7.595.59.540.89.252.2]The Delta Ct method is based on the ‘pairs of genes’ comparison using a simple ΔCt approach [12]. The for-mula used in this method is similar to the standard com-parative Ct method (ΔΔCt) [31] except that no endogenous Figure 5Gene expression differences among the candidate reference genes analyzed by NormFinder.Black circles represent the
log-transformed gene expression levels. Vertical bars give a confidence interval for the inter-tissue variation. Top and bottom lines from the graphic represent the maximum standard deviation of the candidate reference genes, with the difference log expression levels between 0.2 and−0.2.
Figure 6Pairwise variations (V) calculated by geNorm to determine the optimal number of reference genes.The average pairwise variations Vn/n+1was analyzed between the normalization
factors NFnand NFn+1to indicate the optimal number of reference
[image:7.595.57.292.512.646.2]genes required for qRT-PCR data normalization in all the samples, lignified tissues (root, stem secondary xylem, branch secondary xylem), non-lignified tissues (leaf, flower, seedling) and in all samples minus stem secondary xylem.
Table 4 NormFinder intragroup expression stability for teak candidate reference genes
Gene Non-lignified* Lignified** Total
Tgrp60s 0.032 (6) 0.016 (5) 0.048 (4)
TgSand 0.024 (5) 0.015 (4) 0.039 (3)
TgAct 0.043 (7) 0.023 (6) 0.066 (7)
TgCac 0.012 (2) 0.037 (8) 0.059 (6)
TgGAPDH 0.017 (3) 0.023 (6) 0.050 (5)
TgΒ-Tub 0.069 (8) 0.011 (1) 0.080 (8)
TgHis3 0.113 (9) 0.037 (8) 0.150 (9)
TgUbq 0.009 (1) 0.012 (2) 0.021 (1)
TgEf-1α+ 0.017 (3) 0.014 (3) 0.031 (2)
Between parenthesis: ranking of stability.
*Column 1: non-lignified tissues (flower, leaf, seedling). **Column 2: lignified tissues (root, branch, stem).
Galeanoet al. BMC Research Notes2014,7:464 Page 7 of 13
[image:7.595.304.539.568.708.2]reference gene is incorporated since the purpose is to de-fine stably expressed genes to normalize. In this approach, all pairs of genes are compared to each other and the genes are ranked according to the ΔCt values, from lowest to highest [12]. As observed in geNorm and Bestkeeper ana-lysis,TgEF1α, TgUbq and TgGAPDH were the best refer-ence genes, as they had the highest expression stability (lowestΔCt values) (Figure 4). As was detected in all used programs,TgHis3andTgAct were the least stable internal controls for gene expression normalization.
Validation of TgUbq and TgEF-1a as internal controls to assess expression of the teak cinnamyl alcohol
dehydrogenase gene in lignified tissues
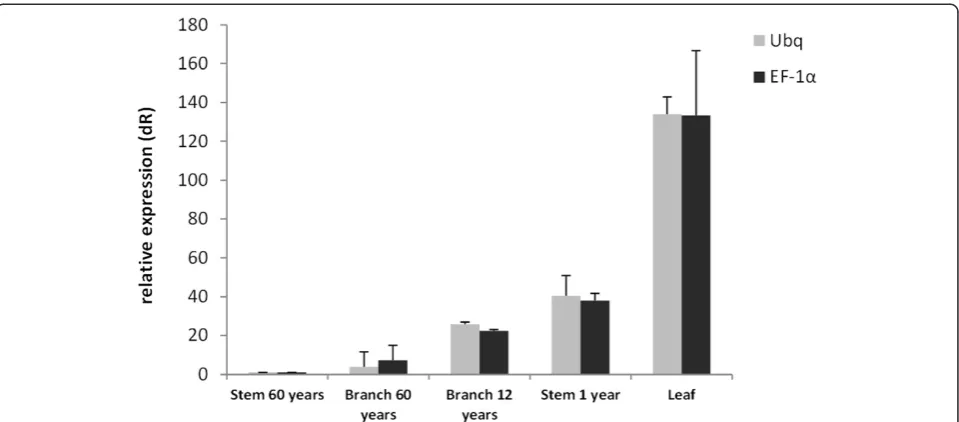
The use of different reference genes to evaluate relative expression data has an important impact on the final nor-malized results. AsTgUbq and TgEF-1a showed the best stability values by geNorm, Delta Ct, NormFinder and BestKeeper analyses (Figure 7), they were used to evaluate the transcript level of a gene of interest, the teakcinnamyl alcohol dehydrogenase (TgCAD). TgCAD was identified and cloned using the same methodologies described for the reference genes. To validate the selected reference genes, the transcript levels were quantified in leaves from four month-old greenhouse grown teak, and in lignified tissues and organs such as stem secondary xylem from 60 year-old trees, stem from 1 year-old plants and branch secondary xylem from 60 and 12 year-old teak trees. Re-sults showed that no matter which gene is used (TgUbqor TgEF-1a), TgCAD expression decreased in the following order: leaf > stem from 1 year-old plants > branch second-ary xylem from 12 year-old trees > branch secondsecond-ary xylem from 60 year-old trees > stem secondary xylem from 60 year-old trees (Figure 8). On the other hand, between tissues, leaf was the tissue with highest expression and stem and branch secondary xylem from 60 year-old teak trees were the tissues with lowest expression of the TgCADgene.
Discussion
In plant molecular biological research, qRT-PCR has im-proved the detection and quantification of expression profiles of target genes due to its sensitivity, specificity and accuracy. For correct qRT-PCR measurements, ref-erence genes are used as endogenous controls for gene expression normalization when analyzing the expression of genes of interest [5,24]. Therefore, a careful choice of reference genes is essential to obtain an accurate quanti-fication of the target gene transcript levels [25].
Currently, teak is one of the most important trees worldwide due to its wood’s properties. Despite the grow-ing importance of teak wood and extractives to the world market, the number of studies adopting techniques of modern biology for teak improvement is still quite limited. As far as has been documented, this is the first study of cloning and expression stability of qRT-PCR reference genes in teak tissues. In total, eight candidate genes (Tgrp60s,TgCac, TgAct, TgHis3, TgSand, TgΒ-Tub, TgUbq, andTgEf-1α) were successfully identified.
One of the challenges of studying gene expression in trees is to ensure good quality of total RNA isolated from stems and branches, which are woody tissues with high lignin contents. In this study, the use of the Salzman protocol [32] for total RNA extraction, followed by a DNAse I (Promega) treatment, provided high quality RNA from all lignified tissues and was chosen as standard method for RNA extraction.
[image:8.595.59.540.557.704.2]The stability of nine reference genes for qRT-PCR normalization was assessed by four statistical approaches, geNorm, NormFinder, BestKeeper and Delta Ct method, in teak lignified and non-lignified tissues at different devel-opmental stages. In spite of some inconsistencies that are usually observed between these methods [24,26,33], our results were quite constant regardless of the algorithm used for analysis. When considering the rank of four most and least stable genes,TgUbq and TgEF1α were selected among the most stable in all methods, whileTgAct,TgHis3
andTgCacshowed the least expression stability. The only clear discrepancy within the results was the inclusion of Tgβ-Tubin the most stable group by NormFinder and in the least stable group by the other programs (Figure 4). In the NormFinder intra-tissues analysis,Tgβ–Tub was the most stable gene in lignified tissues, whereas it was ranked eighth of the nine genes in non-lignified tissues (Table 4). These results suggest thatTgβ–Tubis a suitable reference gene in lignified tissues and could be used as internal con-trol for quantifying gene expression in them.
Among recent studies in trees searching for suitable reference genes, control genes such asAct,Ubq,Ef1α,α -Tub, Cac, Sand, β-Tub were considered to be stable in various tissues and different conditions [24-28].Act,Ubq and Ef1αwere shown to be suitable reference genes for normalization in lignified tissues of Vernicia fordii [25] and Quercus suber[26]. In our analysis, the most stable genes wereUbqandEF1α(Figure 7).
Genes encoding elongation factor-1α and ubiquitin are frequently considered consistent reference genes under dif-ferent experimental conditions.EF1αhas been found to be one of the most stable reference genes in several plants and conditions such asNicotiana tabacum[34],Lolium perenne [35] and Capsicum annuum[36]. The Ubq gene showed high stability for qRT-PCR normalization in Platycladus orientalis[24] andBrachypodium distachyon[37]. In com-bination, Ubq and EF1α showed stable expression across different tissues of Vernicia fordii [25] and Dimocarpus longan [33]. However,Ef1αand Ubq were the most vari-able reference genes inLycopersicum esculentum[38] and Euphorbia esula [39], respectively, suggesting that these genes might not be suitable for qRT-PCR normalization in
some plants and/or conditions. AlthoughActis one of the most commonly used reference gene in plants, in teak it showed low stability when assessed in different tissue sam-ples and with different statistical methods. Similar results were observed inNicotiana tabacumplants with viral in-fections [40] andGlycine max[41].
Studies have shown that the expression of reference genes can vary significantly under different experimental conditions [33,42]. To mitigate these variations, the use of multiple reference genes to assess target gene expression is appropriate. geNorm analysis of paired variable coefficients suggested the inclusion of a third reference gene (i.e. TgUbq,TgEF1α and TgGAPDH) for normalization when considering the total number of samples (Figure 6). Al-though the cut off value ≤0.15 is frequently used to con-firm the optimal number of reference genes [9], this is not an absolute number because small datasets require fewer reference genes than larger ones and previous studies have reported proper normalization with higher cut-off values [40]. In this study, the combination of the two most stable reference genes (TgUbq and TgEF1α) to evaluate expres-sion stability in all samples provided a coefficient of 0.17 and, thus, can be sufficient for the normalization of qRT-PCR data in teak, especially considering that the use of more than two reference genes in large scale gene expres-sion profiles will significantly increase the costs of analysis.
[image:9.595.59.539.88.299.2]To validate the utility of TgUbq and TgEF-1a as refer-ence genes, the expression profile ofTgCADwas assessed in teak leaves and lignified tissues collected from plants in the field at different development stages (Figure 8).CAD functions in one of the final steps of monolignol biosyn-thesis in the phenylpropanoid pathway and its study is Figure 8Expression levels of theTgCADgene.It was used different tissues and organ ages of teak tree, using the best validated reference genes (TgUbqandTgEF-1a) for normalization and the results are represented as mean fold changes in relative expression compared to stem secondary xylem from 60 years-old trees. Bars are mean standard deviation calculated from the 3 biological replicates.
Galeanoet al. BMC Research Notes2014,7:464 Page 9 of 13
essential to understand the lignin deposition and cell wall formation in trees. It catalyzes the NAPDH-dependent reduction of cinnamyl aldehydes to cinnamyl alcohols prior to their transport to the secondary cell wall for polymerization into the lignin heteropolymer [43]. In plants,CADexpression may vary according to tissue and development stage [44]. In addition, it has been shown that CAD/CAD-like genes are differentially expressed in plants infected with pests and pathogens [45,46].
UsingTgUbq or TgEF-1aas reference genes, qRT-PCR results showed that TgCAD was strongly expressed in leaves (average 133-fold), followed by stems from 1 year-old plants (40-fyear-old), branch secondary xylem from 12 year-old trees (24-fold), branch secondary xylem from 60 year-old trees (5-fold) and stem secondary xylem from 60 year-old trees (calibrator) (Figure 8). We observed higher expression of TgCAD in younger lignified tissues compared to older ones, probably due to less lignin depos-ition and secondary wall formation in 60 year-old trees. TheTgCADexpression in lignified tissues and leaves pre-sented the same pattern whichever internal control used, indicating that the reference genes identified in this study are suitable for qRT-PCR normalization in different tissues and plant ages.
This is the first attempt to identify qRT-PCR reference genes in several teak tissues. These results suggest the use of TgUbq and TgEF-1a as the best combination of reference genes for gene expression assessment in leaves, flowers, seedlings, roots, and lignified stem and branch secondary xylem of varying ages in teak. In addition, we recommend the researchers to validate the reference genes in their samples of interest before performing any experiment. The different tissues show thatTgAct is not a suitable reference gene to normalize gene expression in this tree, highlighting the need to evaluate commonly used reference genes for particular species, conditions, tissues and organs. Finally, they advise that the use of reference genes without validation may reduce precision or produce misleading results.
Conclusions
To the best of our knowledge, this study is the first attempt at cloning, sequencing and evaluating a set of commonly used candidate reference genes for the normalization of gene expression analysis using qRT-PCR in teak. Our data showed that expression stability varied considerably among the nine genes tested in the different samples of teak tissues. Stability analysis using NormFinder, Bestkeeper, geNorm and Delta Ct showed that TgUbq and TgEF-1a are the most stable genes across different tissues and organs, while TgAct was deemed to be unsuitable as a reference gene.TgCAD ex-pression analyses confirmedTgUbqandTgEF-1a stabil-ity for correct normalization in teak. Consequently, they
can be used in future gene expression studies of target genes in different teak tissues.
Methods Plant material
Roots, seedlings and leaves were obtained from fifteen four month-old greenhouse grown teak. Flowers and branch and stem secondary xylem (Figure 1) were collected from fifteen twelve year-old teak trees located in Piracicaba, São Paulo State, Brazil. All the harvested tissues were imme-diately frozen by immersion in liquid nitrogen and stored at−80°C.
Total RNA extraction, purification and quality controls
Frozen tissue samples of 1.0 g were weighed and ground to fine powder in liquid nitrogen using a sterilized mortar and pestle. The fifteen samples from each tissue or organ were divided into three different RNA extractions (five samples for each extraction). Total RNA was extracted following a protocol developed for lignified tissues by Salzman et al. [32]. RNA quality assessment included purity (absence of protein and DNA) and integrity (absence of RNA degrad-ation). 1μl of each extraction was analyzed spectrophoto-metrically using a Nanodrop ND-1000 Spectrophotometer (NanoDrop Technologies Inc., USA) and only RNA sam-ples with 260/280 ratio between 1.9 and 2.1 and 260/230 ratio greater than 2.0 were used for subsequent analyses. The concentration of each sample was approximately 2 μg/μl, so they were diluted to a final concentration of 1μg/μl and 4 μg of total RNA from each sample was treated with DNAse I (Promega). Then, 0.5 μl of each treated sample was analyzed in agarose gels, all displaying clear bands corresponding to rRNA, absence of DNA and no degradation. In addition, PCR control reactions to examine for genomic DNA contamination were performed using total RNA without reverse transcription as template, and negative results (absence of bands) were assessed by electrophoresis on a 1% (w/v) agarose gel with ethidium bromide staining.
cDNA synthesis
Multiple sequence alignments, PCR and qRT-PCR primer design
Primers (Table 1) were manually designed flanking the conserved domains of rp60s, Cac, Act, His3, Sand, Β -Tub, Ubq, and Ef-1α after doing Clustal alignment (http://www.ebi.ac.uk/Tools/msa/clustalw2) of several orthologous plant sequences obtained from GenBank (http://www.ncbi.nlm.nih.gov/genbank) to amplify by PCR those genes from teak leaf cDNA (Additional file 2). The eight amplified fragments gel electrophoresis were excised, purified with Fragment CleanUp® (Invisorb, USA) and inserted into the pJET1.2/Blunt vector from the CloneJet™PCR Cloning Kit (Thermo Scientific, USA) fol-lowing the manufacturer’s recommendations. Plasmids were cloned inDH5α™competent cells (Life Technologies, USA) and recombinant colonies were sequenced with the 3100 Genetic Analyzer (Applied Biosystems, USA) using pJET1.2/Blunt vector specific primers. Finally, sequences were blasted using blastx (http://blast.ncbi.nlm.nih.gov) to confirm their percentage amino acid similarity to the con-served domains and were translated (http://web.expasy. org/translate/) to amino acid sequences, which were sub-mitted to PFAM search (http://pfam.sanger.ac.uk/search) (Sanger Institute, England) to confirm the presence of each gene’s canonical protein domains. The primers for qRT-PCR were designed flanking the eight cloned teak se-quences andGAPDH(Table 2) with OligoPerfectTM De-signer (Life technologies, USA) with default parameters. Teak candidate reference genes,TgCADtarget gene, NCBI accession numbers, qRT-PCR primer information and dif-ferent parameters derived from qRT-PCR analysis are shown in Table 2.
Primer specificity, qRT-PCR Efficiency and R2
Confirmation of primer specificity was based on the dis-sociation curve at the end of each run (Figure 3). To de-termine the amplification efficiencies of the candidate genes, it was used cDNA samples from the teak leaf with five dilutions to obtain the standard curve, and then the PCR efficiency for each gene was calculated according to the equation (1 + E) = 10slope. The correlation coefficient (R2) and slope values were obtained from the standard curve (Table 2).
Quantitative real-time reverse transcription PCR
The qRT-PCR mixture contained 5.0μl of a 1:80 dilution of the six synthesized cDNAs from each tissue or organ, primers to a final concentration of 50μM each, 12.5μl of the SYBR Green PCR Master Mix (Applied Biosystems, USA) and PCR-grade water up to a total volume of 25μl. Each gene reaction was performed in technical replicate. PCR reactions without template were also done as nega-tive controls for each primer pair. The quantitanega-tive PCRs were performed employing the StepOnePlus™ System
(Applied Biosystems, USA). All PCR reactions were per-formed under the following conditions: 2 min at 50°C, 2 min at 95°C, and 45 cycles of 15 s at 95°C and 1 min at 65°C in 96-well optical reaction plates (Applied Biosystems, USA). Leaf samples were used as calibrator to normalize the values between different plates.
Analysis of gene expression stability
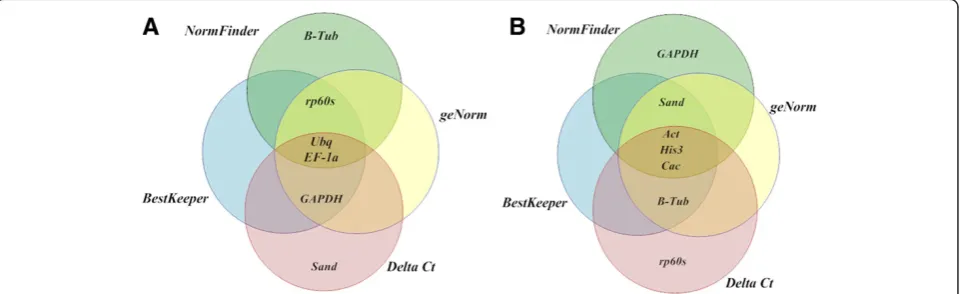
Gene expression stability was evaluated by applying four different statistical approaches: geNorm [9], NormFinder [10], Bestkeeper [11] and Delta Ct [12]. qRT-PCR data was exported from the StepOnePlus™ System (Applied Biosys-tems, USA) into an Excel datasheet (Microsoft Excel 2003) as Raw Crossing Point data (Additional file 6) and those values were log transformed by the 2-ΔCtmethod for further requirements. Each of these approaches generated a meas-ure of reference gene stability, by which each gene was ranked. Venn diagrams were constructed with the Smart-draw® program.
Validation of reference genes
One gene of interest, putatively coding for acinammyl al-cohol dehydrogenase(CAD) (Table 2), an enzyme involved in lignin biosynthesis, one of the terminal steps of the phe-nylpropanoid pathway, was used to validate the best two reference genes. The relative expression level of the target gene was determined in leaves, and the lignified tissues of stem and branch secondary xylem of 60 year-old trees, stem of 1 year-old trees and branch secondary xylem of 12 year-old trees, expecting a higher expression level in younger tissues with a continuous secondary wall forma-tion. The experimental procedure was the same used for the selection of the reference genes. Stem secondary xylem of 60 year-old tree samples were chosen as calibrator.
Additional files
Additional file 1:Information related to the orthologous plant sequences used in this study.
Additional file 2:Clustal alignments used for designing primers to amplify orthologous sequences in teak.Red and green squares mean forward and reverse primers, respectively.
Additional file 3:Protein clustal alignments for teak candidate reference genes.
Additional file 4:Teak sequences (with accession numbers) used for designing qRT-PCR primers (Underlined and bolded).
Additional file 5:Agarose gel (2%) electrophoresis showing amplification of a specific PCR product of the expected size for each gene.M represents 50 bp DNA ladder marker (GeneRuler™50 bp DNA Ladder, Thermo Scientific, USA) and“-”represents negative control.
Additional file 6:Raw CP data used for statistical analysis in this study.
Abbreviations
Tg:Tectona grandis;rp60s:Ribosomal protein 60s; Cac: Clathrin adaptor complexes medium subunit family; Act: Actin; His3: Histone 3; Sand: Sand family;Β-Tub:β-Tubulin; Ubq: Ubiquitin; Ef-1α: Elongation factor 1-α;
Galeanoet al. BMC Research Notes2014,7:464 Page 11 of 13
GAPDH: Glyceraldehyde-3-phosphate dehydrogenase; CAD: Cinnamyl alcohol dehydrogenase; cDNA: Complementary DNA;ΔCt: Delta cycle threshold; mRNA: Messenger RNA; PCR: Polymerase chain reaction;
qRT-PCR: Quantitative real-time reverse transcription PCR; CP: Crossing-point cycle number; GM: Geometric mean; AM: Arithmetic mean; SD: Standard deviation; CV: Coefficient of variation; bp: Base pairs; Tm: Melting temperature; R2: Correlation coefficient.
Competing interests
The authors declare that they have no competing interests.
Authors’contributions
EG is the primary author of the manuscript. EG, TSV and DAR performed all the sample collection and preparation, experimental procedures, data analysis, qRT-PCR experiments and drafted the manuscript. VF and HC participated in the study design and provided helpful discussions and contributed with reagents, materials and analysis tools. EG, TSV, DAR and HC authors participated in the structuring and editing of the manuscript. HC coordinated the study, supervised the research and provided financial support. All authors read and approved the final manuscript.
Acknowledgements
The authors gratefully acknowledge Proteca Biotecnologia Florestal Company for kindly providing teak seeds. EG was recipient of a fellowship from“Coordenação de Aperfeiçoamento de Pessoal de Nível Superior” (CAPES), Brazil. TSV, DAR and HC were recipient of fellowships from “Fundação de Amparo à Pesquisa do Estado de São Paulo”(FAPESP).
Received: 11 February 2014 Accepted: 16 July 2014 Published: 22 July 2014
References
1. Hauptman N, Glavac D:MicroRNAs and long non-coding RNAs: prospects in diagnostics and therapy of cancer.Radiol Oncol2013,47(4):311–318. 2. Conte I, Banfi S, Bovolenta P:Non-coding RNAs in the development of sensory organs and related diseases.Cell Mol Life Sci2013,70:4141–4155. 3. Ohdan T, Francisco PB Jr, Sawada T, Hirose T, Terao T, Satoh H, Nakamura Y:
Expression profiling of genes involved in starch synthesis in sink and source organs of rice.J Exp Bot2005,56(422):3229–3244.
4. Mackay IM, Arden KE, Nitsche A:Real-time PCR in virology.Nucleic Acids Res2002,30(6):1292–1305.
5. Zhu J, Zhang L, Li W, Han S, Yang W, Qi L:Reference gene selection for quantitative real-time PCR normalization inCaragana intermediaunder different abiotic stress conditions.PLoS One2013,8(1):e53196. 6. Kubista M, Andrade JM, Bengtsson M, Forootan A, Jonak J, Lind K, Sindelka
R, Sjoback R, Sjogreen B, Strombom L, Stahlberg A, Zoric N:The real-time polymerase chain reaction.Mol Asp Med2006,27:95–125.
7. Bustin SA, Benes V, Garson JA, Hellemans J, Huggett J, Kubista M, Mueller R, Nolan T, Pfaffl MW, Shipley GL, Vandesompele J, Wittwer CT:The MIQE guidelines: minimum information for publication of quantitative real-time PCR experiments.Clin Chem2009,55(4):611–622. 8. Dheda K, Huggett JF, Chang JS, Kima LU, Bustin SA, Johnson MA, Rook
GAW, Zumla A:The implications of using an inappropriate reference gene for real-time reverse transcription PCR data normalization.
Anal Biochem2005,344:141–143.
9. Vandesompele J, De Preter K, Pattyn F, Poppe B, Van Roy N, De Paepe A, Speleman F:Accurate normalization of real-time quantitative RT-PCR by geometric averaging of multiple internal control genes.Genome Biol
2002,3(7):34.
10. Andersen CL, Jensen JL, Orntoft TF:Normalization of real-time quatitative reverse transcription-PCR data: a model-based variance estimation approach to identify genes suited for normalization, applied to bladder and colon cancer data sets.Cancer Res2004,64:5245–5250.
11. Pfaffl MW, Tichopad A, Prgomet C, Neuvians TP:Determination of stable housekeeping genes, differentially regulated target genes and sample integrity: bestkeeper-Excel-based tool using pair-wise correlations.
Biotechnol Lett2004,26:509–515.
12. Silver N, Best S, Jiang J, Thein SL:Selection of housekeeping genes for gene expression studies in human reticulocytes using real-time PCR.
BMC Mol Biol2006,7:33.
13. Brunner AM, Yakovlev IA, Strauss SH:Validating internal controls for quantitative plant gene expression studies.BMC Plant Biol2004,4:14. 14. Radoni A, Thulke S, Mackay IM, Landt O, Siegert W, Nitsche A:Guideline to
reference gene selection for quantitative real-time PCR.Biochem Biophys Res Commun2004,313:856–862.
15. Czechowski T, Stitt M, Altmann T, Udvardi MK, Scheible W:Genome-wide identification and testing of superior reference genes for transcript normalization in arabidopsis.Plant Physiol2005,139:5–17.
16. Xu M, Zhang B, Su X, Zhang S, Huang M:Reference gene selection for quantitative real-time polymerase chain reaction inPopulus.
Anal Biochem2011,408:337–339.
17. Chambers JP, Behpouri A, Bird A, Ng CK:Evaluation of the use of the Polyubiquitin Genes,Ubi4andUbi10as reference genes for expression studies inBrachypodium distachyon.PLoS One2012,7(11):e49372. 18. Verhaegen D, Fofana IJ, Logossa ZA, Ofori D:What is the genetic origin of
teak (Tectona grandisL.) introduced in Africa and in Indonesia?Tree Genetics Genomes2010,6:717–733.
19. Miranda I, Sousa V, Pereira H:Wood properties of teak (Tectona grandis) from a mature unmanaged stand in East Timor.J Wood Sci2011,57:171–178. 20. Lukmandaru G, Takahashi K:Variation in the natural termite resistance of
teak (Tectona grandisLinn. fil.) wood as a function of tree age.Ann For Sci2008,65:708.
21. Guerrero-Vásquez GA, Andrade CKZ, Molinillo JMG, Macías FA:Practical first total synthesis of the potent phytotoxic (±)-naphthotectone, isolated fromTectona grandis.Eur J Org Chem2013,2013(27):6175–6180. 22. Healey SP, Gara RI:The effect of a teak (Tectona grandis) plantation on
the establishment of native species in an abandoned pasture in Costa Rica.For Ecol Manag2003,176:497–507.
23. Hallett JT, Diaz-Calvo J, Villa-Castillo J, Wagner MR:Teak plantations: economic bonanza or environmental disaster?J For2011,109(5):288–292. 24. Chang E, Shi S, Liu J, Cheng T, Xue L, Yang X, Yang W, Lan Q, Jiang Z:
Selection of reference genes for quantitative gene expression studies in
Platycladus orientalis(Cupressaceae) using real-time PCR.PLoS One2012,
7(3):e33278.
25. Han X, Lu M, Chen Y, Zhan Z, Cui Q, Wang Y:Selection of reliable reference genes for gene expression studies using real-time PCR in tung tree during seed development.PLoS One2012,7(8):e43084.
26. Marum L, Miguel A, Ricardo CP, Miguel C:Reference gene selection for quantitative real-time PCR normalization inQuercus suber.PLoS One2012,
7(4):e35113.
27. Wang HL, Chen J, Tian Q, Wang S, Xia X, Yin W:Identification and validation of reference genes forPopulus euphraticagene expression analysis during abiotic stresses by quantitative real-time PCR.Physiol Plant2014, in press. 28. Imai T, Ubi BE, Saito T, Moriguchi T:Evaluation of reference genes for
accurate normalization of gene expression for real time-quantitative PCR inPyrus pyrifoliausing different tissue samples and seasonal conditions.
PLoS One2014,9(1):e86492.
29. Altschul SF, Gish W, Miller W, Myers EW, Lipman DJ:Basic local alignment search tool.J Mol Biol1990,215:403–410.
30. Pfaffl MW:Quantification Strategies in Real-Time PCR.InThe Real-Time PCR Encyclopedia, A–Z of Quantitative PCR.Edited by Bustin SA. La Jolla: International University Line; 2004:87–120.
31. Livak KJ, Schmittgen TD:Analysis of relative gene expression data using real-time quantitative PCR and the 2-ΔΔCTmethod.Methods2001,25:402–408.
32. Salzman RA, Fujita T, Zhu-Salzman K, Hasegawa PM, Bressan RA:An improved RNA isolation method for plant tissues containing high levels of phenolic compounds or carbohydrates.Plant Mol Biol reports/ISPMB1999,17:11–17. 33. Lin YL, Lai ZX:Reference gene selection for qPCR analysis during somatic
embryogenesis in longan tree.Plant Sci2010,178:359–365. 34. Schmidt GW, Delaney SK:Stable internal reference genes for
normalization of real-time RT-PCR in tobacco (Nicotiana tabacum) during development and abiotic stress.Mol Genet Genomics2010,283:233–241. 35. Lee JM, Roche JR, Donaghy DJ, Thrush A, Sathish P:Validation of reference
genes for quantitative RT-PCR studies of gene expression in perennial ryegrass (Lolium perenneL.).BMC Mol Biol2010,11:8.
36. Bin WS, Wei LK, Ping DW, Li Z, Wei G, Bing LJ, Gui PB, Jian WH, Feng CJ:
Evaluation of appropriate reference genes for gene expression studies in pepper by quantitative real-time PCR.Mol Breed2012,30:1393–1400. 37. Hong S, Seo PJ, Yang M, Xiang F, Park C:Exploring valid reference genes
38. Expósito-Rodríguez M, Borges AA, Borges-Pérez A, Pérez JA:Selection of internal control genes for quantitative real-time RT-PCR studies during tomato development process.BMC Plant Biol2008,8:131.
39. Chao WS, Doğramaci M, Foley ME, Horvath DP, Anderson JV:Selection and validation of endogenous reference genes for qRT-PCR analysis in leafy spurge (euphorbia esula).PLoS One2012,7(8):e42839.
40. Liu D, Shi L, Han C, Yu J, Li D, Zhang Y:Validation of reference genes for gene expression studies in virus-infectedNicotiana benthamianausing quantitative real-time PCR.PLoS One2012,7(9):e46451.
41. Libault M, Thibivilliers S, Bilgin DD, Radwan O, Benitez M, Clough SJ, Stacey G:Identification of four soybean reference genes for gene expression normalization.Plant Genome2008,1(1):44–54.
42. Barsalobres-Cavallari CF, Severino FE, Maluf MP, Maia IG:Identification of suitable internal control genes for expression studies inCoffea Arabica
under different experimental conditions.BMC Mol Biol2009,10:1. 43. Trabucco GM, Matos DA, Lee SJ, Saathoff AJ, Priest HD, Mockler TC, Sarath
G, Hazen SP:Functional characterization ofCinnamyl alcohol dehydrogenaseandcaffeic acid O-methyltransferaseinBrachypodium distachyon.BMC Biotechnol2013,13:61.
44. Barakat A, Bagniewska-Zadworna A, Frost CJ, Carlson JE:Phylogeny and expression profiling ofCADandCAD-like genes in hybrid Populus (P. Deltoides × P. Nigra): evidence from herbivore damage for subfunctionalization and functional divergence.BMC Plant Biol2010,
10:100.
45. Bhuiyan NH, Selvaraj G, Wei Y, King J:Gene expression profiling and silencing reveal that monolignol biosynthesis plays a critical role in penetration defense in wheat against powdery mildew invasion.
J Exp Bot2009,60(2):509–521.
46. Coelho AC, Horta M, Neves D, Cravador A:Involvement of acinnamyl alcohol dehydrogenaseofQuercus suberin the defence response to infection byPhyutophthora cinnamomi.Physiol Mol Plant Pathol2006,
69:62–72.
doi:10.1186/1756-0500-7-464
Cite this article as:Galeanoet al.:Identification and validation of quantitative real-time reverse transcription PCR reference genes for gene expression analysis in teak (Tectona grandisL.f.).BMC Research Notes20147:464.
Submit your next manuscript to BioMed Central and take full advantage of:
• Convenient online submission
• Thorough peer review
• No space constraints or color figure charges
• Immediate publication on acceptance
• Inclusion in PubMed, CAS, Scopus and Google Scholar
• Research which is freely available for redistribution
Submit your manuscript at www.biomedcentral.com/submit
Galeanoet al. BMC Research Notes2014,7:464 Page 13 of 13