R E S E A R C H A R T I C L E
Open Access
Performance of EQ-5D,
howRu
and Oxford
hip & knee scores in assessing the outcome
of hip and knee replacements
Tim Benson
1,2, Dan H Williams
3,4and Henry W W Potts
2*Abstract
Background:We aimed to compare the performance of EQ-5D-3 L andhowRu, which are short generic patient-reported outcome measures (PROMs), in assessing the outcome of hip and knee replacements, using the Oxford Hip Score (OHS) and the Oxford Knee Scores (OKS) for comparison.
Methods:Outcome was assessed as the difference between pre-surgery and 6-month post-surgery scores. We used a large sample from the NHS PROMs database, which used EQ-5D-3 L, and a small cohort of patients having the same operations collected by MyClinicalOutcomes (MCO), which usedhowRu. Both cohorts completed the OHS (hips) or the OKS (knees).
Results:The change (outcome) between pre-op and post-op scores as measured byhowRuwas greater than that measured by EQ-5D, relative to that measured by OHS or OKS.
For hip replacements, the correlation for change measured byhowRuand OHS wasr= 0.77 (0.66–0.85). The corresponding correlation for change measured by EQ-5D Index and OHS wasr= 0.64 (0.63–0.64).
For knee replacements the correlation between change inhowRuand OKS wasr= 0.86 (0.75–0.92); between EQ-5D Index and OKSr= 0.59 (0.58–0.60).
Conclusions:For hip and knee replacement, the outcome measured byhowRuwas more highly correlated with that measured by the condition-specific Oxford Hip and Knee Scores than were EQ-5D Index or EQ-VAS. The magnitude of change before and after surgery was also greater.
Keywords:Patient-reported outcome measures, Total hip arthroplasty, Total knee arthroplasty, EQ-5D, howRu, Oxford hip score, Oxford knee Score
Background
Patient-reported outcome measures (PROMs) have the potential to help improve health and care services by focusing attention on what matters most to people re-ceiving treatment [1–3].
Changes measured using different measures should be highly correlated and show similar change magnitude. Many different measures have been developed but the changes measured by different instruments do not agree well [4]. Direct comparisons between two measures show the extent of agreement between them, but cannot
show whether one measure is better than another. For this we need a gold standard for comparison.
In this study, we set out to compare the changes following hip and knee replacement surgery as measured by two generic PROMs – EQ-5D-3 L [5] and howRu [6] – using condition-specific measures – Oxford Hip Score (OHS) [7] and Oxford Knee Score (OKS) [8]–for comparison.
We compared comparable cohorts from two existing databases as a natural experiment – NHS PROMs and MyClinicalOutcomes. Since 2009, all patients having hip and knee replacement surgery paid for by the NHS have been asked to complete EQ-5D-3 L and the Oxford scores before and six months after surgery. Anonymised results are published for further analysis. This programme has led
* Correspondence:[email protected]
2UCL Institute of Health Informatics, 222 Euston Road, London NW1 2DA, UK
Full list of author information is available at the end of the article
to more than 60 research papers [9]. MyClinicalOutcomes has collected a database on a wide range of patients where it has collected howRu and the Oxford Scores [10]. We extracted a subset of those with hip and knee replacement surgery. This allows a comparison of EQ-5D-3 L with howRu by seeing how both perform against the same condition-specific measures on similar cohorts of patients.
The measures
The OHS [7] and the OKS [8] are condition-specific PROMs for the evaluation of joint replacement im-plants and techniques. Each measure has 12 items, with five responses each. Each item is scored on a 0– 4 scale. The score for each item is added, giving an overall score on a scale from 0 (worst possible score) to 48 (best possible score).
[image:2.595.304.539.461.725.2]EQ-5D-3 L [5] is a generic PROM with two parts, the EQ-5D Index and a visual analogue scale (EQ-VAS). The EQ-5D Index is derived from 5 items: mobility (walking about), self-care (washing and dressing), usual activities (e.g. work, study, housework, family or leisure activities), pain or discomfort, and anxiety or depression. Each item has 3 possible responses. The EQ-5D Index is derived by applying weights to each response based on valuations derived from a population survey. The NHS PROMs programme uses the UK tariff [11]. These weights pur-port to represent the perspective of society as a whole. The range of possible scores for the EQ-5D Index is from−0.594 (worst state) to 1.0 (best state), with death allocated a value of 0. The EQ-VAS is a 20 cm visual analogue scale with a range from 0 (worst imaginable health state) to 100 (best imaginable health state). The EQ-VAS is intended for use as a quantitative measure of health outcome as judged by the individual respondents [12, 13].
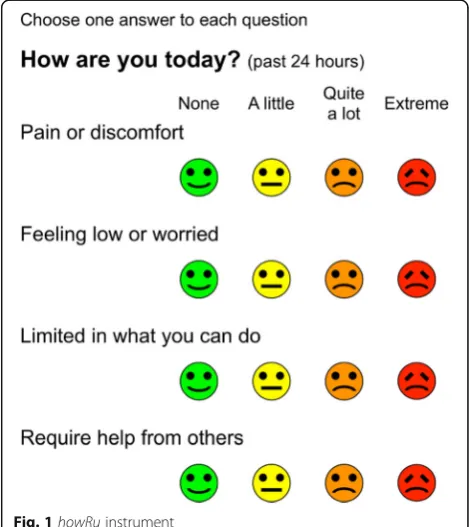
HowRu[9] is a short generic patient-reported measure of health-related quality of life, with 4 items: pain or discomfort; feeling low or worried; limited in what you can do; need help from others. Each item has four pos-sible responses: extreme, quite a lot, a little, and none. These are scored from 0 (extreme) to 3 (none). The summary howRu score is the sum of the item scores, giving a scale with 13 possible values with a range from 0 (4 × extreme) to 12 (4 × none).
Previous studies have compared howRu with SF12 [6] and with EQ-5D [14], and show thathowRuhas compar-able overall performance at a single point in time. HowRu is considerably shorter than EQ-5D with 37 words vs. 230 words and has been validated for use at the individual patient level [15]. Since the original publi-cation of howRu [6], some small changes have been made. The original item "Dependent on others" has been changed to "Require help from others", to improve un-derstanding. The user instructions have been simplified
from "Circle one face on each line to tell us how you are today" to "Choose one answer to each question". The main question "How are you today?" has been qualified by adding "(past 24 hours)" to clarify that it means this day rather than right now. These changes have slightly changed the word counts (see Fig. 1).
All of these instruments were developed as measures of patient benefit, so we might expect that they would show a similar level of improvement and be highly correlated. However, condition-specific measures only take account of those aspects of each patient’s health directly associated with the condition being treated, while generic measures have a more holistic view, includ-ing co-morbidities. For this reason, condition-specific measures usually show larger improvements after surgery than generic measures [3].
Methods
The data collected in the NHS PROMs programme covers all hospitals providing hip and knee replace-ments paid by the NHS. Most data are collected using paper booklets. Pre-operative questionnaires are com-pleted at a pre-operative assessment clinic or on admis-sion. Post-operative questionnaires are mailed to each patient’s home address 6 months later.
To use the MCO web-based system, patients register, complete the appropriate condition-specific measures (here, OHS or OKS) and howRu, and consent to share their health information with their medical team. Patients
are issued new question sets every three months and are shown feedback indicating the absolute and rate of change in their score. The MCO data for this study was collected between August 2011 and October 2013. The MCO data is not publicly available.
The MCO system had 1,696 patients with an OHS and 1,395 patients with an OKS. Of these, 178 hip re-placement patients and 103 knee rere-placement patients had both a pre-operative and post-operative ratings. The proportion is relatively low because most patients also completed NHS PROMs surveys for hip and knee replacement operations, which involved duplica-tion of the OHS and OKS scores. Entries with matched pre-op and a 5, 6 or 7-month post-op rat-ings for both howRu and OHS or OKS as appropriate were selected for analysis. Where more than one set of post-operation ratings was available, we selected the one closest to 6 months after the operation. All patient records that were incomplete for any reason were excluded from the analysis. This yielded data on 74 hip replacements and 42 knee replacements.
The original scores for both NHS and MCO records were used without case-mix adjustment.
Each instrument uses a different scale, which compli-cates comparison between results using different instru-ments (Table 1). We transformed each scale arithmetically to provide a common 0–100 scale from minimum (0) to maximum (100).
We used Excel or Stata/IC for Windows 12.1 to calcu-late the distributions, means, standard deviations and correlations for each measure.
The generic measures are compared with condition-specific measures in the following ways.
The proportion of patients reporting improvements using each measure.
Pre-op and post-op scores for each measure. The mean change between each patient’s
pre-operative and post-pre-operative scores for each measure, using the 0–100 scale.
Correlation of the change between pre-operative and post-operative scores for each generic measure with the relevant condition-specific measure.
Results
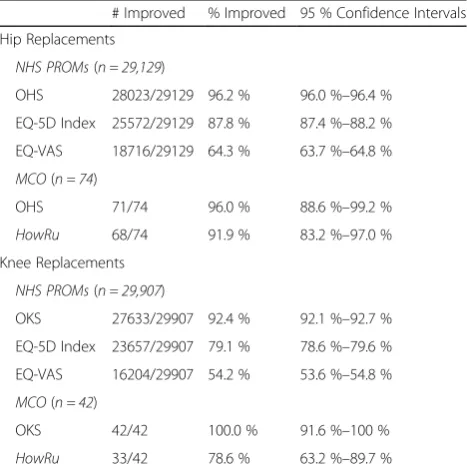
Table 2 shows the number of patients in each cohort and the proportion of patients who have shown im-provement for each measure with the 95 % confi-dence limits.
Table 3 shows, for each cohort and measure, the mean pre-operative and post-operative scores and the mean change after surgery (the outcome), calculated as the post-operative score minus the pre-operative score. These are shown transformed to a common 0–100 scale. The same data using the original scales are provided as an Additional file 1.
The use of the 0–100 scale allows a comparison of the outcome as measured by each instrument for each type of operation (Fig. 2). For hip replacement, EQ-5D shows an improvement of 26.0, compared with 42.2 for OHS (62 % of the OHS score) for the NHS cohort. HowRu shows an improvement of 32.5 compared with 43.9 for OHS (74 %) for the MCO cohort.
For knee replacement, EQ-5D shows an improve-ment of 18.9, compared with 31.8 for OKS (59 %) for the NHS cohort. HowRu shows an improvement of 25.6 compared with 36.4 for OHS (70 %) for the MCO cohort.
[image:3.595.305.539.494.729.2]The MCO patients have greater improvement than the NHS patients, which may be due to different pop-ulations. The howRu instrument shows a greater im-provement, relative to the condition-specific measure than EQ-5D.
Table 1Range of possible scores for each instrument
Measure Use Minimum score Maximum score OHS Hip replacement 0 48
OKS Knee replacement 0 48 EQ-5D Index Generic −0.594 1.0 EQ-VAS Generic 0 100
HowRu Generic 0 12
Table 2Percentage of patients reporting any improvement and 95 % confidence intervals
# Improved % Improved 95 % Confidence Intervals Hip Replacements
NHS PROMs(n = 29,129)
OHS 28023/29129 96.2 % 96.0 %–96.4 % EQ-5D Index 25572/29129 87.8 % 87.4 %–88.2 % EQ-VAS 18716/29129 64.3 % 63.7 %–64.8 %
MCO(n = 74)
OHS 71/74 96.0 % 88.6 %–99.2 %
HowRu 68/74 91.9 % 83.2 %–97.0 % Knee Replacements
NHS PROMs(n = 29,907)
OKS 27633/29907 92.4 % 92.1 %–92.7 % EQ-5D Index 23657/29907 79.1 % 78.6 %–79.6 % EQ-VAS 16204/29907 54.2 % 53.6 %–54.8 %
MCO(n = 42)
OKS 42/42 100.0 % 91.6 %–100 %
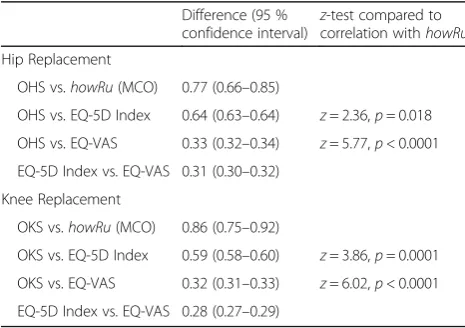
[image:3.595.57.291.648.732.2]The correlations for each measure within each cohort are shown in Table 4 for the scores before surgery and 6 months after surgery. Table 5 and Fig. 3 show the correlation of the change or outcome of surgery, as mea-sured by each instrument.
The correlations between howRu with OHS and OKS are higher than the corresponding correlations with EQ-5D Index. Tables 4 and 5 also givez-tests comparing the correlations: correlations with howRu are statistically significantly higher than with EQ-5D Index for the out-come of hip and knee replacement and pre-operatively for the knee replacement. The correlations of OHS and OKS withhowRuare much higher and statistically signifi-cantly higher than those with the EQ-VAS. For example, considering the outcomes of hip surgery, a correlation of r= 0.77 (OHS vs. howRu) explains 59 % of the variance (r2), while correlation of r= 0.64 (OHS vs. EQ-5D Index) explains 41 % of the variance and correlation of r= 0.33 (OHS vs. EQ-VAS) explains only 11 % of the variance.
Discussion
In a previous paper, [14] we compared and discussed the differences betweenhowRu and EQ-5D in a study of the same population. That study showed that howRu is shorter, has better readability statistics, a higher comple-tion rate, used a wider range of states and has a smaller ceiling effect than EQ-5D.
This study suggests that, for similar types of patient, howRu shows larger relative improvements, compared with condition-specific measures, than the EQ-5D Index and much larger improvements that EQ-VAS. HowRu also shows higher correlations for the surgery outcome, the difference between pre and post-operative scores.
[image:4.595.57.291.123.380.2]One explanation for these differences may be the noise introduced by the weighting system or tariff used to cal-culate the EQ-5D Index scores. This view is supported
Table 3Mean pre-op and post-op scores and the mean change after surgery (post-op score minus pre-op score) using 0–100 scales
0–100 scale mean
Pre-op score Post-op score Change after surgery (Post-op minus Pre-op) Hip Replacements
NHS PROMs(n = 29,129)
OHS 38.0 80.1 42.2 EQ-5D Index 59.7 85.7 26.0 EQ-VAS 65.4 75.6 10.2
MCO(n = 74)
OHS 41.6 85.4 43.9
HowRu 55.2 87.7 32.5
Knee Replacements
NHS PROMs(n = 29,907)
OKS 39.4 71.2 31.8 EQ-5D Index 62.9 81.8 18.9 EQ-VAS 67.6 72.2 4.6
MCO Knee Replacements(n = 42)
OKS 40.3 76.7 36.4
HowRu 56.5 82.1 25.6
[image:4.595.60.540.480.684.2]by the release of the new tariff for EQ-5D-5 L [16], which has substantial differences from that used for the 3 L version [17].
The scores calculated in this paper for NHS patients, covering a 6-month period without risk adjustment, are very similar to those presented in the final published re-sults for the whole year 2011–12, which include risk ad-justment [18].
The condition-specific scores show high levels of im-provement (the means are between 31.8 and 43.9 on the 0–100 scale). Generic measures such as EQ-5D Index andhowRu capture each patient’s symptoms and disabil-ity from any cause (not just hips or knees). These show substantial but not as high improvements (between 18.9 to 32.5). On all measures, the results at six months are better for hips than for knees.
The improvements measured by EQ-VAS (10.2 for hips and 4.6 for knees) are much lower than for EQ-5D Index. EQ-VAS also shows low correlations with the EQ-5D Index. These large differences between EQ-VAS and EQ-5D Index were known in the 1990s
for patients with rheumatic disease such as those hav-ing hip and knee replacement [19]. The new EQ-5D-5 L version [16] with more response levels may have better properties [20].
Feng, Parkin and Devlin [21] investigated the perform-ance of the EQ-VAS in the NHS PROMs programme with similar results to those presented here and sug-gested that the results might be improved by providing better guidance on collection and coding. Our view is that EQ-VAS is measuring something substantially dif-ferent from the other measures. EQ-VAS asks the pa-tient to rate their health state on a scale with end points of best and worst imaginable health states. This implies inclusion of aspects such as prognosis (including that of other comorbidities), social deprivation and optimism, which are not covered by the other measures and may not be changed by joint replacement.
Hip and knee replacements are major operations with substantial costs in terms of both money and post-operative recovery periods. For these, and indeed all operations, patients, surgeons and commissioners need to know the likelihood of a favorable outcome. However, preliminary analysis of the first three years results of the NHS PROMs programme has shown little impact on hospital performance [22]. This may in part be be-cause information feedback was slow. For example, the final results for operations performed in 2009 were not released until August 2011. Furthermore, these re-sults were issued using a complex interactive spread-sheet (the PROMs Score Comparison Tool) [23] that is difficult to use.
[image:5.595.57.541.99.261.2]Each measure uses a different scale range, which cre-ates a barrier to comparison and understanding [24]. Transformed 0–100 scales, shown in Table 3 and Fig. 2, are much easier to interpret than the original scales when comparing mean scores. To illustrate this, Table 6 shows the original and the 0–100 scales for the average change as measured by the Oxford scores, EQ-5D and
Table 4Correlations between condition-specific and generic scores
Pre-op
(95 % confidence interval)
Post-op
(95 % confidence interval)
Pre-opz-test compared to correlation withhowRu
Post-opz-test compared to correlation withhowRu Hip Replacement
OHS vs.howRu(MCO) 0.82 (0.73–0.86) 0.80 (0.75–0.84)
OHS vs. EQ-5D Index 0.74 (0.74–0.74) 0.76 (0.76–0.76) z= 1.82,p= 0.069 z= 0.84,p= 0.4 OHS vs. EQ-VAS 0.38 (0.37–0.39) 0.60 (0.60–0.61) z= 6.45,p< 0.0001 z= 3.37,p= 0.0008 EQ-5D Index vs. EQ-VAS 0.36 (0.35–0.37) 0.64 (0.64–0.64)
Knee Replacement
OKS vs.howRu(MCO) 0.84 (0.71–0.88) 0.79 (0.72–0.84)
OKS vs. EQ-5D Index 0.70 (0.70–0.70) 0.77 (0.77–0.77) z= 2.10,p= 0.036 z= 0.34,p= 0.7 OKS vs. EQ-VAS 0.38 (0.37–0.38) 0.60 (0.59–0.60) z= 5.05,p< 0.0001 z= 2.39,p= 0.017 EQ-5D Index vs. EQ-VAS 0.35 (0.34–0.36) 0.62 (0.62–0.63)
Table 5Correlations of differences between post-op and pre-op scores
Difference (95 % confidence interval)
z-test compared to correlation withhowRu Hip Replacement
OHS vs.howRu(MCO) 0.77 (0.66–0.85)
OHS vs. EQ-5D Index 0.64 (0.63–0.64) z= 2.36,p= 0.018 OHS vs. EQ-VAS 0.33 (0.32–0.34) z= 5.77,p< 0.0001 EQ-5D Index vs. EQ-VAS 0.31 (0.30–0.32)
Knee Replacement
OKS vs.howRu(MCO) 0.86 (0.75–0.92)
[image:5.595.56.289.568.732.2]EQ-VAS for NHS hip and knee replacements. The original scales are shown in the Additional file 1.
Limitations of this study include the modest number of MCO patients analysed. However, confidence inter-vals show that the numbers are statistically precise enough for our purposes. Case-mix adjustment was not applied to the scores [25]. The mean pre-operative condition-specific scores for the MCO cohorts are not significantly different from the NHS scores, but the post-operative scores are higher than the corresponding NHS scores (p< 0.05). This may be because the MCO patients comprise a different population from the NHS group, being younger [26], less deprived [27], more
self-selecting and self-motivated [28], all of which may con-tribute to better outcome. NHS patients may have more co-morbidity, which might increase the gap between condition-specific and generic outcomes.
Conclusions
In this study,howRu, as a generic score, better measures improvement following hip and knee replacement surgery than EQ-5D compared to the OHS/OKS gold standard. Given the wide use of EQ-5D, we recommend that larger studies confirm or refute these findings.
Additional file
Additional file 1:Summary statistics scores using original scales. (DOCX 16 kb)
Abbreviations
EQ-5D:EuroQol 5 dimensions; EQ-VAS: EuroQol visual analogue scale; HSCIC: Health and social care information centre; MCO: MyClinicalOutcomes; NHS: National health service; OHS: Oxford hip score; OKS: Oxford knee score; PROM: Patient-reported outcome measures
Acknowledgements None.
Funding
Tim Benson’s work was supported in part by the Technology Strategy Board project 101062e-Commissioning Community to Support NHS GP Consortia 2011–2013.
Availability of data and materials
The HSCIC dataset analysed during the current study is available from the Health and Social Care Information Centre (HSCIC) website at
http://digital.nhs.uk/proms.
[image:6.595.61.538.87.285.2]The MCO dataset analysed during the current study is not publicly available for commercial reasons, but is available from the corresponding author on reasonable request.
Table 6Comparison of mean improvement between pre-op and post-op measure on the original and transformed (0–100) scales
Improvement Original scales 0–100 scale NHS hip replacements
OHS 20.2 42.2 EQ-5D Index 0.415 26.0 EQ-VAS 10.2 10.2 NHS knee replacements
OHS 15.3 31.8 EQ-5D Index 0.301 18.6 EQ-VAS 4.6 4.6 MCO hip replacements
OHS 21.1 43.9
howRu 3.9 32.5
MCO Knee replacements
OKS 17.5 36.4
howRu 3.1 25.6
[image:6.595.56.290.521.731.2]For this study we used an anonymous dataset from November 2011 to April 2012, downloaded from Health and Social Care Information Centre (HSCIC) website, now available at http://digital.nhs.uk/proms.
Authors’contributions
The study was conceived and developed by TB and DHW. The data were analysed by TB and HWWP. TB wrote the first draft of the paper and all authors contributed to the writing of the final paper.
Competing interests
Tim Benson developedhowRuand is a shareholder in R-Outcomes Ltd. Dan Williams co-founded and is a shareholder in MyClinicalOutcomes Ltd. Henry Potts has done consultancy work for Crystallise Ltd.
Consent for publication Not applicable.
Ethics approval and consent to participate
Data came from two anonymised datasets available for research purposes.
Author details
1R-Outcomes Ltd, Hermitage, Thatcham RG18 9WL, UK.2UCL Institute of
Health Informatics, 222 Euston Road, London NW1 2DA, UK.3Royal Cornwall Hospital, Truro TR1 3LJ, UK.4MyClinicalOutcomes Ltd, London, UK. Received: 28 July 2015 Accepted: 15 September 2016
References
1. Black N. Patient reported outcome measures could help transform healthcare. BMJ. 2013;346:f167.
2. Hunter C, Fitzpatrick R, Jenkinson C, Darlington A, Coulter A, Forder J, Peters M. Perspectives from health, social care and policy stakeholders on the value of a single self-report outcome measure across long-term conditions: a qualitative study. BMJ Open. 2015;5:e006986.
3. Appleby J, Devlin N, Parkin D: Using patient reported outcomes to improve health care. Chichester: John Wiley & Sons Ltd; 2016
4. Richardson J, Khan MA, Iezzi A, Maxwell A. Comparing and explaining differences in the magnitude, content, and sensitivity of utilities predicted by the EQ-5D, SF-6D, HUI 3, 15D, QWB, and AQoL-8D multiattribute utility instruments. Med Decis Mak. 2015;35(3):276–91.
5. Brooks R. EuroQol: the current state of play. Health Policy. 1996;37(1):53–72. 6. Benson T, Sizmur S, Whatling J, Arikan S, McDonald D, Ingram D. Evaluation of a new short generic measure of health status:howRu. Inform Prim Care. 2010;18(2):89–101.
7. Dawson J, Fitzpatrick R, Carr A, Murray D. Questionnaire on the perceptions of patients about total hip replacement. J Bone Joint Surg (Br).
1996;78(2):185–90.
8. Dawson J, Fitzpatrick R, Murray D, et al. Questionnaire on the perceptions of patients about total knee replacement. J Bone Joint Surg (Br). 1998;80:63–9. 9. National patient-reported outcome measures bibliography. London:
London School of Hygiene and Tropical Medicine. http://proms.lshtm.ac. uk/publications/. Accessed 16 Sep 2016.
10. Williams D. The myClinicalOutcomes website: providing real-time, patient-level PROMs data. Bull R Coll Surg Engl. 2012;94(1):20–1.
11. Dolan P. Modeling valuations for EuroQol health states. Med Care. 1997;35:1095–108.
12. Oemar M, Oppe M: EQ-5D-3 L User Guide: Basic information on how to use the EQ-5D-3 L instrument. Rotterdam: Version 5.0 EuroQol Group, October 2013.
13. Rabin R, de Charro F. EQ-5D: a measure of health status from the EuroQol Group. Ann Med. 2001;33(5):337–43.
14. Benson T, Potts HWW, Whatling J, Patterson D. Comparison ofhowRuand EQ-5D measures of health-related quality of life in an outpatient clinic. Inform Prim Care. 2013;21(1):12–7.
15. Hendriks SH, Rutgers J, van Dijk PR, Groenier KH, Bilo HJ, Kleefstra N, Kocks JW, van Hateren KJ, Blanker MH. Validation of the howRu and howRwe questionnaires at the individual patient level. BMC Health Serv Res. 2015;15(1):447.
16. Herdman M, Gudex C, Lloyd A, Janssen M, Kind P, Parkin D, et al. Development and preliminary testing of the new five-level version of EQ-5D (EQ-5D-5 L). Qual Life Res. 2011;20(10):1727–36.
17. Devlin N, Shah K, Feng Y, Mulhern B, van Hout B. Valuing Health-Related Quality of Life: An EQ-5D-5L Value Set for England. London: OHE; 2016. Research Paper 16/01.
18. Finalised Patient Reported Outcome Measures (PROMs) in England: April 2011 to March 2012. HSCIC, 15 October 2013. http://digital.nhs.uk/ catalogue/PUB11359/final-proms-eng-apr11-mar12-fin-report-v2.pdf. Accessed 16 Sep 2016.
19. Wolfe F, Hawley DJ. Measurement of the quality of life in rheumatic disorders using the EuroQol. Rheumatology. 1997;36(7):786–93.
20. Conner-Spady BL, Marshall DA, Bohm E, Dunbar MJ, Loucks L, Al Khudairy A, Noseworthy TW. Reliability and validity of the EQ-5D-5 L compared to the EQ-5D-3 L in patients with osteoarthritis referred for hip and knee replacement. Qual Life Res. 2015;24(7):1775–84.
21. Feng Y, Parkin D, Devlin N. Assessing the performance of the EQ-VAS in the NHS PROMs programme. Qual Life Res. 2014;23(3):977–89. doi:10.1007/ s11136-013-0537-z.
22. Varagunam M, Hutchings A, Neuberger J, Black N. Impact on hospital performance of introducing routine patient reported outcome measures in surgery. J Health Serv Res Policy. 2014;19(2):77–84.
doi:10.1177/1355819613506187.
23. Wineberg A: Guide to Patient Reported Outcome Measures (PROMs), Part 2: The Score Comparison Tool. HSCIC 12 February 2014 Video https://www. youtube.com/watch?v=tGR78wEAhDQ (accessed 18 July 2015)
24. Hildon Z, Neuberger J, Allwood D, van der Meulen J, Black N. Clinicians’and patients’views of metrics of change derived from patient reported outcome measures (PROMs) for comparing providers’performance of surgery. BMC Health Serv Res. 2012;12:171. doi:10.1186/1472-6963-12-171. 25. Nuttall D, Parkin D, Devlin N. Inter-provider comparisons of patient-reported
outcomes: Developing an adjustment to account for differences in patient case-mix. Health Econ. 2015;24(1):41–54. doi:10.1002/hec.2999.
26. Williams DP, Price AJ, Beard DJ, Hadfield SG, Arden NK, Murray DW. The effects of age on patient-reported outcome measures in total knee replacement. J Bone Joint Surg (Br). 2013;95-B:38–44.
27. Soljak M, Browne J, Lewsey J, Black N. Is there an association between deprivation and pre-operative disease severity? A cross-sectional study of patient-reported health status. Int J Qual Health Care. 2009;21:311–5. 28. Hutchings A, Neuburger J, Gross Frie K, van der Meulen J, Black N. Factors