R E S E A R C H A R T I C L E
Open Access
Next generation sequencing-based expression
profiling identifies signatures from benign stromal
proliferations that define stromal components of
breast cancer
Xiangqian Guo, Shirley X Zhu, Alayne L Brunner, Matt van de Rijn and Robert B West
*Abstract
Introduction:Multiple studies have shown that the tumor microenvironment (TME) of carcinomas can play an important role in the initiation, progression, and metastasis of cancer. Here we test the hypothesis that specific benign fibrous soft tissue tumor gene expression profiles may represent distinct stromal fibroblastic reaction types that occur in different breast cancers. The discovered stromal profiles could classify breast cancer based on the type of stromal reaction patterns in the TME.
Methods:Next generation sequencing-based gene expression profiling (3SEQ) was performed on formalin fixed, paraffin embedded (FFPE) samples of 10 types of fibrous soft tissue tumors. We determined the extent to which these signatures could identify distinct subsets of breast cancers in four publicly available breast cancer datasets. Results:A total of 53 fibrous tumors were sequenced by 3SEQ with an average of 29 million reads per sample. Both the gene signatures derived from elastofibroma (EF) and fibroma of tendon sheath (FOTS) demonstrated robust outcome results for survival in the four breast cancer datasets. The breast cancers positive for the EF signature (20-33% of the cohort) demonstrated significantly better outcome for survival. In contrast, the FOTS signature-positive breast cancers (11-35% of the cohort) had a worse outcome.
Conclusions:We defined and validated two new stromal signatures in breast cancer (EF and FOTS), which are significantly associated with prognosis. Our group has previously identified novel cancer stromal gene expression signatures associated with outcome differences in breast cancer by gene expression profiling of three soft tissue tumors, desmoid-type fibromatosis (DTF), solitary fibrous tumor (SFT), and tenosynovial giant cell tumor
(TGCT/CSF1), as surrogates for stromal expression patterns. By combining the stromal signatures of EF and FOTS, with our previously identified DTF and TGCT/CSF1 signatures we can now characterize clinically relevant stromal expression profiles in the TME for between 74% to 90% of all breast cancers.
Introduction
The tumor microenvironment (TME) is comprised of fibroblasts, endothelial cells, immune cells and extracel-lular matrix (ECM). The cells within the TME have been demonstrated to play significant roles in the develop-ment and progression of cancer [1-8], but most studies view each of these cell groups as a relatively uniform population that is similar across different patients.
Profiling the non-neoplastic cells within the TME directly is difficult due to the variety and relative paucity of these cells in the tissue and practical issues with the isolation of these cells. Our approach rests on the hypothesis that, similar to lymphomas where each tumor is a clonal outgrowth of a particular lymphoid cell type, each soft tissue tumor type can also be regarded as a clonal outgrowth of a particular connective tissue cell type to represent subclasses of stromal proliferation that occur in epithelial tumors.
In our approach, soft tissue tumors (STTs) which are a homogenous collection of a single mesenchymal * Correspondence:[email protected]
Department of Pathology, Stanford University School of Medicine, Stanford, CA 94305-5324, USA
cell type have phenotypes distinct from each other, can be easily profiled and act as “discovery tools” for various types of TME expression patterns to yield a relatively uniform signature. Using gene array-based expression profiling of fresh frozen specimens of fi-broblastic tumors (desmoid type fibromatosis-DTF and solitary fibrous tumor-SFT) and macrophage-rich tumors (tenosynovial giant cell tumor-TGCT/CSF1), we previously discovered novel types of stromal reaction patterns that emphasize the variations in the fibroblast and macrophage compartment in breast cancer between different patients [1,2,8,9]. The biological significance of the identification of these stromal reaction patterns was borne out by the fact that several of these stromal expres-sion patterns have prognostic significance independent from traditional prognosticators such as tumor size, tumor grade and even lymph node status [1,2,8].
Based on our previous findings, the DTF signature robustly defined a stromal pattern for 25 to 35% of invasive breast cancers [2], while the TGCT/CSF1 signature was found in 17 to 28% of breast cancers [1]. However, a signifi-cant number of breast cancers were not classified by these signatures. In order to find additional stromal patterns we performed gene expression profiling on a spectrum of fi-broblastic lesions. As most of these lesions are quite small, they are routinely entirely submitted as formalin fixed par-affin embedded (FFPE) tissue. Here, we have applied an RNA-Seq method for the expression profiling of archival, FFPE tissue, termed 3SEQ (3′end RNA sequencing), which we have previously developed. This method can be used to perform global gene expression profiling of FFPE material [10-12], as well as to discover and characterize expression levels for lncRNAs [13]. Within this study, we have used 3SEQ to determine specific gene expression signatures for 10 types of fibroblastic tumors and found that 2 can identify breast cancers with distinct clinical outcome. Taken together with the two previously identified stromal signatures (DTF and TGCT/CSF1 signatures), the combined four stromal signatures now classify 74% to 90% of breast carcinomas.
Methods
Samples selection, treatment and 3SEQ analysis
Paraffin blocks from 53 fibrous tumors were collected from the Department of Pathology at Stanford University Hospital, with Health Insurance Portability and Ac-countability Act (HIPAA)-compliant Stanford University Medical Center Institutional Review Board approval. And the tissues were collected with a waiver of consent due to the archival nature of the specimens. The samples con-sisted of collagenous fibroma (FC, six cases), elastofi-broma (EF, four cases), infantile digital fielastofi-bromatosis (IF, three cases), palmar fibromatosis (PF, eight cases), nasopharyngeal angiofibroma (NPAF, six cases), fibroma of tendon sheath (FOTS, four cases), nodular fasciitis (NF,
six cases), dermatofibrosarcoma protuberans (DFSP, four cases), desmoid type fibromatosis (DTF, seven cases) and solitary fibrous tumor (SFT, five cases). Multiple 2 mm-diameter cores were taken from diagnostic FFPE material for RNA isolation as reported previously [12].
3SEQ sequencing and data analysis
3SEQ libraries for next generation sequencing-based ex-pression profiling were built according to previously de-scribed methods [10-13] and protocols in our lab website [14], and then were sent to Stanford Center for Genomics and Personalized Medicine to be sequenced directionally (36 bp) from 5′end of mRNA fragments towards their poly (A) ends using Illumina GA IIx machines (Illumina, Inc., San Diego, CA, USA).
Sequence reads, after filtering for read quality, were re-filtered by fastx (fastx_artifacts_filter) [15], and mapped to the transcriptome (refMrna, downloaded from the UCSC genome browser, www.genome.ucsc.edu/) by using SOAP2, allowing at most two mismatches [16]. Total numbers of sequence reads for each gene symbol from the transcriptome mapping were determined and were used to create the gene-expression profile matrix. Read counts from each library were normalized to transcripts per million reads (TPM). Adequacy of sequencing depth for each library was assessed using an estimation of library saturation for transcriptome detection, which showed that our sequencing depths were sufficient to detect an average of 67% of reference mRNAs. The distances between sequencing reads and 3′ends of mRNAs were measured to be around 100 to 200 nt as we expected based on the length of mRNA after shearing.
Hierarchical clustering was performed as previously described (filter by SD100, adjust data by“log transform data” and“center genes”, then perform Hierarchical clus-tering with “Spearman Rank Correlation” and “Centroid Linkage”) [8] and a clustered heatmap was visualized with Java TreeView (http://sourceforge.net/projects/jtreeview/ files/). Two class SAM analysis (Significance Analysis of Microarrays) [17] was used to identify genes expressed dif-ferentially between each type of fibrous tumor versus the other fibrous tumors with FDR of 0.05. Genes that were specific for a particular tumor type and that were highly expressed were used to define the fibrous tumor signature for each tumor type. All gene expression profiling data used for this study have been deposited in the Gene Ex-pression Omnibus (GEO) and are publicly accessible through GSE42948. The 3SEQ and SAM analyses scripts for this study are attached as Additional file 1.
Analysis of breast cancer microarray expression data
GSE4922 [21]). The combined sets of positively expressed genes that are unique for each fibrous tumor signature were identified in each of the four breast cancer datasets. Using only the expression data for these genes, the breast cancers were grouped by unsupervised hierarchical clustering using Cluster 3 software (http://bonsai.hgc.jp/~mdehoon/ software/cluster/). The resulting heatmap was visualized with Java TreeView. We then identified the breast cancer cases that were most closely associated with each fibrous tumor signature. These cases were visually identified in the heatmap as sharing the largest group of genes with high ex-pression. These observations were validated by calculating the volume of expression (the averaged expression values of each probe within the gene set after removing all the nega-tive values in the matrix) to confirm that the visually identi-fied group of cases had indeed the highest levels of expression relative to other groups of cases.
After studying 10 fibrous tumor signatures in four breast cancer expression datasets, we identified the fibrous tumor signatures which significantly stratify breast cancers into two groups with different outcomes; only the EF and FOTS signatures divided each of four breast cancer datasets into two groups with statistically significant outcome differences in the four datasets. To refine our analysis, we determined the“core”genes for EF and FOTS signatures: genes that are consistently coordinately and highly expressed in the breast cancer datasets. We defined the EF and FOTS core genes as those exhibiting greater than 0.1 correlated expression and present in at least three of the four gene clusters in four datasets [1,2].
For the association analysis between core gene signa-tures, a chi-square test was performed using the software GraphPad (GraphPad Software, Inc., La Jolla, CA, USA). Kaplan-Meier plots were used to compute the survival curves, and Log-rank (Mantel-Cox) Test was used to de-termine the statistical significance of survival between groups by using GraphPad Prism5 software. Univariate and multivariate analysis by the Cox proportional hazard method was performed by using the survival package in R. Analysis of gene ontology (GO) and the Kyoto Encyclopedia of Genes and Genomes (KEGG) Pathway was done by using DAVID Bioinformatics Resources version 6.7 (http://david.abcc.ncifcrf.gov/).
Results
Expression of fibrous tumor gene signatures in breast cancer
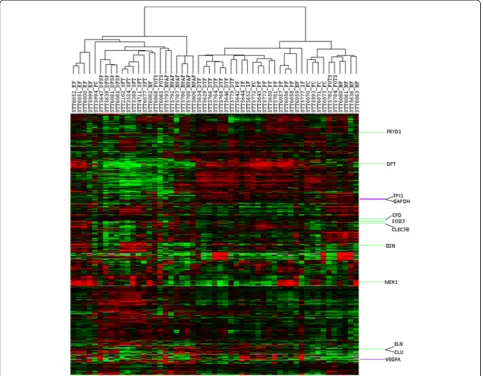
Gene expression profiling by 3SEQ was performed on 53 fibrous tumors representing 10 groups of benign fibrous soft tissue tumors (Figures 1 and 2, see Additional files 2, 3, 4). For each diagnostic entity, up to 2,598 genes were highly expressed relative to all other tumors based on two-class SAM analysis, defining 10 unique fibrous tumor gene signatures (Table 1, see Additional file 5).
To the fibrous tumor gene signatures in breast cancer, we analyzed four publicly available breast cancer data-sets (GSE1456, GSE4922, GSE3494 and the NKI Data-set). Each breast cancer dataset was clustered separately with the gene sets specific for each of the 10 fibrous tumor signatures. We identified the fibrous tumor genes coordinately over-expressed in a subset of breast cancers for each dataset as representing the stromal expression pattern in the breast cancers that is most similar to that particular fibroblastic tumor. Four fibrous tumor signa-tures did not show coordinated expression patterns in the four breast cancer datasets. Another four fibrous tumor signatures demonstrated coordinated expression patterns in the breast cancer datasets, but did not con-sistently show a statistically significant difference in the prognosis between the two groups of breast cancers de-fined by these fibrous tumor signatures. On the contrary, both the EF and FOTS gene signatures demonstrated meaningful outcome results for survival in all four breast cancer datasets (see Additional file 6).
Core gene sets of FOTS and EF and their implication in the prognosis of breast cancer
[image:3.595.307.539.90.258.2]To extend our analysis, we determined the fibrous tumor “core” gene signature as being the genes coordi-nately over expressed in all four breast cancer datasets as we previously had defined the core gene set for DTF signature [2], by requiring that each “core” gene has to be present in at least three of the four gene clusters in four datasets. For each core gene signature and breast cancer dataset, the group of breast cancer samples with the highest aggregate of expression of fibrous tumor sig-nature genes was identified as having a correlation >0.2 (Figure 3). The breast cancer subgroups were assessed for clinicopathologic correlations in each of the four
Figure 2Unsupervised hierarchical clustering of expression profiles of 10 groups of 53 fibrous tumors.Unsupervised hierarchical clustering of 53 tumors (columns) using 961 genes (rows). Within the heatmap, red represents higher expression, black represents mean expression, green represents lower expression, and gray represents normalized expressional level zero. Note: In several instance tumors of the same diagnosis appear adjacent to each other in the figure. It should be noted that the arms of the dendrogram can rotate freely and that it is the length of the dendrogram arms that determines the similarity between cases.
Table 1 Differentially expressed genes between each type of tumors and all others by SAM
Diagnosis of fibrous tumors Sigillum Number of cases Number of genes up-expressed Number of genes down-expressed
1 Desmoid type fibromatosis DTF 7 42 0
2 Solitary fibrous tumor SFT 5 2,598 51
3 Dermatofibrosarcoma protuberans DFSP 4 452 8
4 Collagenous fibroma FC 6 30 0
5 Elastofibroma EF 4 259 279
6 Infantile digital fibromatosis IF 3 191 0
7 Palmar fibromatosis PF 8 166 1
8 Nasopharyngeal angiofibroma NPAF 6 273 26
9 Fibroma of tendon sheath FOTS 4 66 0
[image:4.595.61.536.578.733.2]breast cancer datasets. The EF core gene signature positive breast cancers demonstrated significantly better outcome (P <0.05) for survival than EF core gene signature-negative cases (Figures 3 and 4). EF-like breast cancers account for 20 to 33% of all breast cancers in each cohort (see Additional file 7). The EF signature was defined by 41 genes (see Additional file 8). In contrast to the EF signature, the FOTS core gene signature positive breast cancers had a worse outcome than breast cancers (P <0.05) that failed to express it (Figures 3 and 4). FOTS-like breast cancers account for 11 to 35% of all breast cancers in each cohort (see Additional file 7). This gene set was comprised of 16 genes (see Additional file 8). Multivariate analysis showed that both the FOTS and EF signatures are independent of other clinical parameters, such as tumor grade, lymph node status, ER expression and so on (see Additional file 9).
To better understand the functions of the two new stromal core gene set signatures (EF and FOTS), we performed Gene Ontology (GO) and KEGG pathway analysis. The results show that the EF core genes are significantly enriched in biological processes including ‘response to wounding’and BMP signaling, were enriched in Pathways including Tyrosine metabolism, Complement and coagulation cascades (see Additional file 8). For the FOTS core gene set, biological processes, including glycolysis, were enriched based on the 16 core genes
(see Additional file 8), KEGG pathways including “ Gly-colysis/Gluconeogenesis” and “Fructose and mannose metabolism”were enriched (see Additional file 8).
Independent signatures of FOTS and EF with DTF fibroblast and TGCT/CSF1 macrophage signatures
[image:5.595.57.540.90.358.2]the association between TGCT/CSF1 macrophage cases and FOTS-like cases is also not statistically significant in three of four datasets (see Additional file 10). These data show that the signatures associated with good outcome (DTF and EF) identify non-overlapping sets of tumors and that similarly the two signatures associated with poor outcome (TGCT/CSF1 and FOTS) also describe distinct sets of tumors.
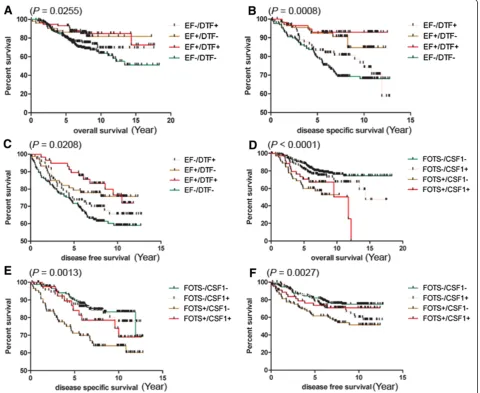
To examine the degree to which the two new signa-tures provide additional information to the previously identified DTF/TGCT/CSF1 signatures, we stratified breast cancer into four categories based on DTF/EF signatures for good outcome (DTF+/EF+, DTF+/EF-, DTF-/EF+, DTF-/EF-) or FOTS/TGCT/CSF1 signatures for poor outcome (FOTS+/TGCT/CSF1+, FOTS-/TGCT/ CSF1+, FOTS+/TGCT/CSF1-, FOTS-/TGCT/CSF1-) in the four breast cancer datasets. EF+/DTF + breast can-cers account for 11 to 16% of the cases, while EF-/ DTF- breast cancers account for 44 to 47% of the cases. FOTS+/TGCT/CSF1+ breast cancers account for 6 to 12% of the cases, whereas FOTS-/TGCT/CSF1- breast cancers account for 41 to 65% of the cases in the four
breast cancer datasets (see Additional file 7). The progno-sis of these four categories for DTF/EF signatures or FOTS/TGCT/CSF1 signatures was assessed by overall survival (OS), disease specific survival (DSS), and disease free survival (DFS) by the pooled cases of four datasets (Figure 5). EF-/DTF- breast cancers demonstrated signifi-cantly worst outcome in overall survival, disease specific survival and disease free survival. EF + breast cancers showed the best outcome in overall survival, disease specific survival and disease free survival, independent of DTF signature status, while the EF-/DTF + breast cancers showed better outcome than EF-/DTF- breast cancers. FOTS-/TGCT/CSF1- breast cancers demonstrated signifi-cantly better outcome in overall survival, disease specific survival and disease free survival. The FOTS+/TGCT/ CSF1- breast cancer showed the worst outcome in overall survival, disease specific survival and disease free survival.
[image:6.595.59.539.88.396.2]ER negative (6.45%), PR negative (12.5%), Grade 3 (9.06%) and p53 mutant (5.24%). These FOTS+/TGCT/ CSF1+ breast cancers were also more likely to be Basal subtype (17 in 34), while FOTS-/TGCT/CSF1- breast cancers were more likely to be Luminal A subtype (94 in 270). EF+/DTF + breast cancers were less likely to be ER negative (7%), PR negative (11.76%), Grade 3 (7.61%) and p53 mutant (8.96%) than EF-/DTF- breast can-cers that were ER negative (24.51%), PR negative (31.82%), Grade 3 (40.48%) and p53 mutant (32.88%) (see Additional file 11).
Discussion
Stromal components within the TME are known to be involved in cancer initiation, progression and prognosis [1-4,6,7,9,22-27]. In many studies, the different cellular components of the TME are treated as relatively
invariable factors that are assumed to play a similar role in tumor samples from different patients. How-ever, through systematic analysis of breast cancer H&E images with a novel machine learning based method, C-Path, we have recently shown that the morphological features of the tumor stroma vary markedly between tumor samples and that they are not only significantly associated with survival in breast cancer, but that their impact on outcome is even stronger than the features of the epithelial component itself [9].
[image:7.595.60.541.91.484.2]gene expression pattern in carcinoma cells as these cells often represent the majority of the cells within a tumor and often show the most variation in expression patterns. Thus, their transcript levels represent the strongest signal in the sample. As a result, differences between tumors based on their stromal expression patterns are often not observed in datasets where the entire gene expression profile of the sample is used.
It is difficult to obtain gene expression profiles from normal fibroblast subtypes as in normal and tumor tissue they are typically closely associated with other cell types, such as epithelial cells, and techniques, such as micro-dissection, are laborious. Our approach rests on the hypothesis that, similar to lymphomas where each tumor is a clonal outgrowth of a particular lymphoid cell type, each fibroblast tumor type can be regarded as a clonal outgrowth of a particular connective tissue cell type [28]. Fibroblastic tumors thus represent neoplasms of different normal fibroblast subtypes and differentially express genes typical for various fibroblast functions. Moreover, each fibroblastic tumor type represents a largely homogenous population of cells and can be robustly profiled. By using this approach, our group has previously demonstrated that a specific stromal gene expression pattern, the DTF fibroblast signature, could robustly and reproducibly define a subgroup of breast cancer patients with good prognosis [2,8] and that a second stromal pattern, the TGCT/CSF1 macrophage signature, is associated with breast cancers of a higher tumor grade, with decreased expression of ER/PR, and increased mutations of TP53 [1]. Subsequent studies have shown that these different TME variants can even be identified in cases of pre-invasive ductal carcinoma [6]. These findings indicated that the type of TME can vary between patients and that expression profiles obtained from STTs form a useful tool to distinguish these TME variants.
Our prior studies allowed us to identify distinct TME subtypes in up to 50% of breast cancers. In order to extend our findings we determined the gene expression profile for an additional eight fibroblastic tumors. Previ-ous studies required fresh frozen tumor samples, but for many of the fibroblastic lesions we intended to analyze only FFPE material was available. We therefore used a novel gene expression profiling approach (3SEQ) that uses next generation sequencing of RNA fragments purified by oligo-dT selection from FFPE material (Additional file 12). Applying eight novel fibrous signa-tures to four publicly available breast cancer expression profiling datasets, we found that three of these signatures were not expressed in the breast cancers in a coordinated manner. Of the five remaining signatures, three did not show differences in outcome analysis. In contrast, the EF and FOTS signatures could stratify the breast cancer
samples into two groups, through highly coordinated gene expression with consistent association with outcome in all the four breast cancer datasets. The EF signature positive breast cancers demonstrated good outcome, while the FOTS signature positive breast cancers showed bad outcome. In this study, the SFT signature is significantly associated with worse outcome only in the NKI dataset, but there is no clear pattern in the other three datasets, consistent with our previous findings [2]. The current DTF-(3SEQ) signature, which is similar to the DTF signa-ture previously defined against SFT [2,8], is associated with good outcome in three of the four breast cancer data-sets, though the association in this analysis is not statisti-cally significant. The difference in the significances of old and new signatures related to outcome can be explained by the fact that the genes differentially expressed for a particular lesion is to a great extent determined by the other samples in the dataset to which it is compared. The original DTF was determined through a comparison with SFT only while the currently defined DTF-(3SEQ) signa-ture was determined through a comparison with a much larger number of distinct fibrous tumor types. As a result, the current DTF-(3SEQ) signature contains 42 genes from the comparison between DTF and the other nine types of fibrous tumors including SFT, while the original DTF signature contains 237 genes from the comparison be-tween DTF and only one other type of fibrous tumor, SFT. The EF and the previously identified DTF fibroblast signature both identify good outcome in breast cancer, while the FOTS and the previously identified TGCT/ CSF1 macrophage signature both identify bad outcome in breast cancer. In order to explore the relationships between the good or bad signatures, we compared the breast cancer sample assignments between them. The comparison results showed that 11 to 16% of breast cancers were positive for both EF and DTF core gene sets, while 44 to 47% of breast cancers were negative for both, 23 to 33% of breast cancers were EF-/DTF+, and 9 to 20% of breast cancers were EF+/DTF-. In addition, 6 to 12% of breast cancers were positive for both of FOTS and TGCT/CSF1 core gene sets, 41 to 65% of breast cancers were negative for both FOTS and TGCT/CSF1 core gene sets, 5 to 24% of breast cancers were FOTS+/TGCT/ CSF1-, and 23 to 24% of breast cancers were FOTS-/ TGCT/CSF1+. EF+/DTF + breast cancer cases were more likely to be ER+/PR+, low grade, with less lymph node than EF-/DTF- breast cancers. FOTS+/TGCT/CSF1+ breast cancers are more likely to be ER-/PR-, high grade, base-like breast cancers than FOTS-/TGCT/CSF1- breast cancer cases.
specific survival (DSS) and disease free survival (DFS). Kaplan-Meier analysis for the combined core gene sets in the pooled dataset showed that EF-/DTF-breast cancers were associated with worst outcome in OS, DSS and DFS, while EF + breast cancers, no mat-ter whether they are DTF- or DTF+, were associated with better outcome in OS, DSS and DFS. FOTS-/ TGCT/CSF1- breast cancers were associated with bet-ter outcome in OS, DSS and DFS, while FOTS +/TGCT/CSF1- breast cancers were associated with worse outcome in OS, DSS and DFS.
To better understand the potential functions of the two new stromal core gene set signatures (EF and FOTS) in breast cancer, Gene Ontology (GO) and KEGG PATHWAY analysis were performed, which show that the 41 EF core genes are significantly enriched in biological processes including ‘response to wounding’ and BMP signaling. Within the 41 EF core genes, almost one fourth of them (9/41), such as
AOC3, AOX1, C6, CFD, CFH, CLU, GSN, LYVE1 and
MECOM, were related to ‘response to wounding’. The association with wound healing has been previously identified in a study of prognostic gene signatures in breast cancer [29]. However, a comparison between the EF gene list and the previously identified gene signa-tures of the “minimum number core serum response” (CSR) genes [29] necessary for tumor classification, we found that only one gene, GSN, was shared between EF core signature and CSR genes (from quiescent samples, in contrast to activated samples). The BMP pathway is well known to modulate cross-talk between stromal cells and epithelial cells [30-32], and three genes (CHRDL1, GREM2 and MSX1) involving BMP signaling were comprised of the EF core signature. For the FOTS core gene set, biological processes, including glycolysis, were enriched based on the 16 core genes. This sug-gests that the increase in glycolysis, which serves a crit-ical role in cancer cell growth and invasion [33], may also influence stromal fibroblast. FOXM1 is an example of FOTS core genes involved in both of epithelial can-cer cells and the cancan-cer associated fibroblasts. By com-paring the gene expression between isolated breast cancer-associated fibroblasts (CAFs) and normal mam-mary fibroblasts (NFs) isolated from the same patient, Mercier et al. found that FOXM1 was up-regulated in CAFs rather than the NFs [34]. TPI1 gene in FOTS core signature was up-regulated in the CL4 fibroblast, which could supply epithelial cancer cells with pyru-vate/lactate as“fuel”to help epithelial cancer cells to es-cape the anti-angiogenic treatment [35]; therefore, the TPI1 targeted therapy (or FOTS gene targeted therapy) for cancer-associated fibroblast will be an actionable way to control the progression of cancer in conjunction with anti-angiogenic therapy.
Conclusions
Our study explores the TME space as defined by the fibroblastic component, by using a wide range of fibro-blastic tumors as tools for the definition of distinct tumor stromal responses. Our data confirm the signifi-cance of the TME in breast signifi-cancer behavior and are con-sistent with our previous observations on the variability of the TME in breast cancer. By using these two novel signatures in addition to two previously identified DTF and TGCT/CSF1 signatures, we could characterize the stromal expression profile for the tumor microenviron-ment in 74% to 90% of all breast cancers. Through their association with clinical outcome, the genes within the two core gene sets of FOTS and EF indicate that they play a functional role in the progression of breast cancers. In the future, recognition of the distinct TME types in breast cancer could lead to targeted therapy that is specific for the distinct TME-based subtypes of breast cancer.
Additional files
Additional file 1:The scripts for 3SEQ and SAM analyses.This file supplies the perl script“3seq.pl”for 3SEQ analysis and R script“3seq.2class. sam.fibrous.option1.r”for SAM analysis.
Additional file 2:Statistics of 3SEQ libraries.This file summarized the yield of each 3SEQ library including total reads and uniquely mapped reads to transcriptome.
Additional file 3:The files for clustering and heatmap.This file includes the txt, atr, gtr, jtv and cdt files for clustering and heatmap.
Additional file 4:The estimation of library depth for mRNA detection of two 3SEQ libraries.This file assesses the depth of 3SEQ sequencing data.
Additional file 5:Differentially expressed genes from SAM analysis. This file provides genes differentially expressed between each type of fibrous tumor versus the other fibrous tumors, and these genes were identified by Two Class SAM analysis with FDR of 0.05.
Additional file 6:Summary of outcome for 10 fibrous tumor signatures in four breast cancer datasets.This file provides the
P-value from Log-rank (Mantel-Cox) Test of survival between the two breast cancer groups stratified by each fibrous tumor signature in four public available breast cancer datasets.
Additional file 7:Components of each dataset for combined core signatures.This file presents the breast cancer components defined by combined EF/DTF signature and combined FOTS/TGCT/CSF1 signature in four public available breast cancer datasets.
Additional file 8:GO and KEGG results for FOTS/EF core gene signatures.This file provides the gene lists for FOTS and EF core gene signatures, the GO and KEGG results for both core gene signatures.
Additional file 9:Multivariate results of FOTS/EF core signatures in four breast cancer datasets.This file provides theP-value and hazard ratio from Cox proportional hazard analysis of fibrous tumor signature and other traditional prognostic factors in four public available breast cancer datasets.
Additional file 10:Association analysis between FOTS and TGCT/ CSF1 signatures, or between EF and DTF signatures.This file provides theP-value from Chi-square and Fisher’s exact test for the association between the signatures in four public available breast cancer datasets.
Additional file 12:Additional supplementary results and discussion. This file provides some supplementary results about distribution of 3SEQ data, IHC results of Keratin, discusses understanding and reproducibility of EF and FOTS signatures, limitation and application of 3SEQ technique.
Abbreviations
3SEQ:3′end RNA sequencing; CAFs: Cancer-associated fibroblasts; DFS: Disease free survival; DFSP: Dermatofibrosarcoma protuberans; DSS: Disease specific survival; DTF: Desmoid type fibromatosis; ECM: Extracellular matrix; EF: Elastofibroma; FC: Collagenous fibroma; FFPE: Formalin fixed, paraffin embedded; FOTS: Fibroma of tendon sheath; GO: Gene ontology; IF: Infantile digital fibromatosis; KEGG: Kyoto encyclopedia of genes and genomes; NF: Nodular fasciitis; NPAF: Nasopharyngeal angiofibroma; OS: Overall survival; PF: Palmar fibromatosis; SAM: Significance analysis of microarrays; SFT: Solitary fibrous tumor; STTs: Soft tissue tumors; TGCT: Tenosynovial giant cell tumor; TME: Tumor microenvironment.
Competing interests
The authors declare that they have no competing interests.
Authors’contributions
XG, MVD and RW designed the research and wrote the paper. XG and AB analyzed the data. SXZ performed the experiments. MVD and RW supervised the research. All authors read and approved the final manuscript.
Acknowledgements
This study was supported by NIH grant 1R01-CA129927. We thank David Rimm who gave us suggestions and comments on our manuscript.
Received: 28 March 2013 Accepted: 6 December 2013 Published: 17 December 2013
References
1. Beck AH, Espinosa I, Edris B, Li R, Montgomery K, Zhu S, Varma S, Marinelli RJ, van de Rijn M, West RB:The macrophage colony-stimulating factor 1 response signature in breast carcinoma.Clin Cancer Res2009,15:778–787. 2. Beck AH, Espinosa I, Gilks CB, van de Rijn M, West RB:The fibromatosis
signature defines a robust stromal response in breast carcinoma.
Lab Invest2008,88:591–601.
3. Bremnes RM, Donnem T, Al-Saad S, Al-Shibli K, Andersen S, Sirera R, Camps C, Marinez I, Busund LT:The role of tumor stroma in cancer progression and prognosis: emphasis on carcinoma-associated fibroblasts and non-small cell lung cancer.J Thorac Oncol2011,6:209–217.
4. Finak G, Bertos N, Pepin F, Sadekova S, Souleimanova M, Zhao H, Chen H, Omeroglu G, Meterissian S, Omeroglu A, Hallett M, Park M:Stromal gene expression predicts clinical outcome in breast cancer.Nat Med2008, 14:518–527.
5. Saadi A, Shannon NB, Lao-Sirieix P, O'Donovan M, Walker E, Clemons NJ, Hardwick JS, Zhang C, Das M, Save V, Novelli M, Balkwill F, Fitzgerald RC: Stromal genes discriminate preinvasive from invasive disease, predict outcome, and highlight inflammatory pathways in digestive cancers.
Proc Natl Acad Sci USA2010,107:2177–2182.
6. Sharma M, Beck AH, Webster JA, Espinosa I, Montgomery K, Varma S, van de Rijn M, Jensen KC, West RB:Analysis of stromal signatures in the tumor microenvironment of ductal carcinoma in situ.Breast Cancer Res Treat
2010,123:397–404.
7. Webster JA, Beck AH, Sharma M, Espinosa I, Weigelt B, Schreuder M, Montgomery KD, Jensen KC, van de Rijn M, West R:Variations in stromal signatures in breast and colorectal cancer metastases.J Pathol2010, 222:158–165.
8. West RB, Nuyten DS, Subramanian S, Nielsen TO, Corless CL, Rubin BP, Montgomery K, Zhu S, Patel R, Hernandez-Boussard T, Goldblum JR, Brown PO, van de Vijver M, van de Rijn M:Determination of stromal signatures in breast carcinoma.PLoS Biol2005,3:e187.
9. Beck AH, Sangoi AR, Leung S, Marinelli RJ, Nielsen TO, van de Vijver MJ, West RB, van de Rijn M, Koller D:Systematic analysis of breast cancer morphology uncovers stromal features associated with survival.
Sci Transl Med2011,3:108ra113.
10. Lee CH, Ou WB, Mariño-Enriquez A, Zhu M, Mayeda M, Wang Y, Guo X, Brunner AL, Amant F, French CA, West RB, McAlpine JN, Gilks CB, Yaffe MB, Prentice LM, McPherson A, Jones SJ, Marra MA, Shah SP, van de Rijn M, Huntsman DG, Dal Cin P, Debiec-Rychter M, Nucci MR, Fletcher JA:14-3-3 fusion oncogenes in high-grade endometrial stromal sarcoma.Proc Natl Acad Sci USA2012,109:929–934.
11. Lee CH, Ali RH, Rouzbahman M, Marino-Enriquez A, Zhu M, Guo X, Brunner AL, Chiang S, Leung S, Nelnyk N, Huntsman DG, Blake Gilks C, Nielsen TO, Dal Cin P, van de Rijn M, Oliva E, Fletcher JA, Nucci MR: Cyclin D1 as a diagnostic immunomarker for endometrial stromal sarcoma with YWHAE-FAM22 rearrangement.Am J Surg Pathol2012, 36:1562–1570.
12. Beck AH, Weng Z, Witten DM, Zhu S, Foley JW, Lacroute P, Smith CL, Tibshirani R, van de Rijn M, Sidow A, West RB:3′-end sequencing for expression quantification (3SEQ) from archival tumor samples.PLoS One
2010,5:e8768.
13. Brunner AL, Beck AH, Edris B, Sweeney RT, Zhu SX, Li R, Montgomery K, Varma S, Gilks T, Guo X, Foley JW, Witten DM, Giacomini CP, Flynn RA, Pollack JR, Tibshirani R, Chang HY, van de Rijn M, West RB:Transcriptional profiling of lncRNAs and novel transcribed regions across a diverse panel of archived human cancers.Genome Biol2012,13:R75. 14. The van de Rijn and West Lab, Department of Pathology, Stanford
School of Medicine - Protocols. http://med.stanford.edu/labs/vanderijn-west/Protocols.html.
15. Fastx-toolkit.[http://hannonlab.cshl.edu/fastx_toolkit/index.html] 16. Li R, Yu C, Li Y, Lam TW, Yiu SM, Kristiansen K, Wang J:SOAP2: an
improved ultrafast tool for short read alignment.Bioinformatics2009, 25:1966–1967.
17. Tusher VG, Tibshirani R, Chu G:Significance analysis of microarrays applied to the ionizing radiation response.Proc Natl Acad Sci USA2001, 98:5116–5121.
18. van de Vijver MJ, He YD, van’t Veer LJ, Dai H, Hart AA, Voskuil DW, Schreiber GJ, Peterse JL, Roberts C, Marton MJ, Parrish M, Atsma D, Witteveen A, Glas A, Delahaye L, van der Velde T, Bartelink H, Rodenhuis S, Rutgers ET, Friend SH, Bernards R:A gene-expression signature as a predictor of survival in breast cancer.N Engl J Med2002,347:1999–2009.
19. Pawitan Y, Bjohle J, Amler L, Borg AL, Egyhazi S, Hall P, Han X, Holmberg L, Huang F, Klaar S, Liu ET, Miller L, Nordgren H, Ploner A, Sandelin K, Shaw PM, Smeds J, Skoog L, Wedren S, Bergh J:Gene expression profiling spares early breast cancer patients from adjuvant therapy: derived and validated in two population-based cohorts.Breast Cancer Res2005, 7:R953–R964.
20. Miller LD, Smeds J, George J, Vega VB, Vergara L, Ploner A, Pawitan Y, Hall P, Klaar S, Liu ET, Bergh J:An expression signature for p53 status in human breast cancer predicts mutation status, transcriptional effects, and patient survival.Proc Natl Acad Sci USA2005,
102:13550–13555.
21. Ivshina AV, George J, Senko O, Mow B, Putti TC, Smeds J, Lindahl T, Pawitan Y, Hall P, Nordgren H, Wong JE, Liu ET, Bergh J, Kuznetsov VA, Miller LD: Genetic reclassification of histologic grade delineates new clinical subtypes of breast cancer.Cancer Res2006,66:10292–10301.
22. Bauer M, Su G, Casper C, He R, Rehrauer W, Friedl A:Heterogeneity of gene expression in stromal fibroblasts of human breast carcinomas and normal breast.Oncogene2010,29:1732–1740.
23. Bergamaschi A, Tagliabue E, Sorlie T, Naume B, Triulzi T, Orlandi R, Russnes HG, Nesland JM, Tammi R, Auvinen P, Kosma VM, Menard S, Borresen-Dale AL:Extracellular matrix signature identifies breast cancer subgroups with different clinical outcome.J Pathol2008,214:357–367.
24. Bierie B, Moses HL:Tumour microenvironment: TGFbeta: the molecular Jekyll and Hyde of cancer.Nat Rev Cancer2006,6:506–520.
25. Bierie B, Moses HL:TGF-beta and cancer.Cytokine Growth Factor Rev2006, 17:29–40.
26. Casey T, Bond J, Tighe S, Hunter T, Lintault L, Patel O, Eneman J, Crocker A, White J, Tessitore J, Stanley M, Harlow S, Weaver D, Muss H, Plaut K: Molecular signatures suggest a major role for stromal cells in development of invasive breast cancer.Breast Cancer Res Treat2009, 114:47–62.
28. West RB, van de Rijn M:Experimental approaches to the study of cancer-stroma interactions: recent findings suggest a pivotal role for stroma in carcinogenesis.Lab Invest2007,87:967–970.
29. Chang HY, Sneddon JB, Alizadeh AA, Sood R, West RB, Montgomery K, Chi JT, van de Rijn M, Botstein D, Brown PO:Gene expression signature of fibroblast serum response predicts human cancer progression: similarities between tumors and wounds.PLoS Biol2004,2:E7. 30. Guido C, Whitaker-Menezes D, Capparelli C, Balliet R, Lin Z, Pestell RG,
Howell A, Aquila S, Ando S, Martinez-Outschoorn U, Sotgia F, Lisanti MP: Metabolic reprogramming of cancer-associated fibroblasts by TGF-beta drives tumor growth: connecting TGF-beta signaling with“Warburg-like” cancer metabolism and L-lactate production.Cell Cycle2012,
11:3019–3035.
31. Ma XJ, Dahiya S, Richardson E, Erlander M, Sgroi DC:Gene expression profiling of the tumor microenvironment during breast cancer progression.Breast Cancer Res2009,11:R7.
32. Matise LA, Palmer TD, Ashby WJ, Nashabi A, Chytil A, Aakre M, Pickup MW, Gorska AE, Zijlstra A, Moses HL:Lack of transforming growth factor-beta signaling promotes collective cancer cell invasion through
tumor-stromal crosstalk.Breast Cancer Res2012,14:R98.
33. Gatenby RA, Gillies RJ:Glycolysis in cancer: a potential target for therapy.
Int J Biochem Cell Biol2007,39:1358–1366.
34. Mercier I, Casimiro MC, Wang C, Rosenberg AL, Quong J, Minkeu A, Allen KG, Danilo C, Sotgia F, Bonuccelli G, Jasmin JF, Xu H, Bosco E, Aronow B, Witkiewicz A, Pestell RG, Knudsen ES, Lisanti MP:Human breast cancer-associated fibroblasts (CAFs) show caveolin-1 downregulation and RB tumor suppressor functional inactivation: implications for the response to hormonal therapy.Cancer Biol Ther2008,7:1212–1225. 35. Migneco G, Whitaker-Menezes D, Chiavarina B, Castello-Cros R, Pavlides S,
Pestell RG, Fatatis A, Flomenberg N, Tsirigos A, Howell A, Martinez-Outschoorn UE, Sotgia F, Lisanti MP:Glycolytic cancer associated fibroblasts promote breast cancer tumor growth, without a measurable increase in angiogenesis: evidence for stromal-epithelial metabolic coupling.Cell Cycle2010,9:2412–2422.
doi:10.1186/bcr3586
Cite this article as:Guoet al.:Next generation sequencing-based ex-pression profiling identifies signatures from benign stromal prolifera-tions that define stromal components of breast cancer.Breast Cancer Research201315:R117.
Submit your next manuscript to BioMed Central and take full advantage of:
• Convenient online submission
• Thorough peer review
• No space constraints or color figure charges
• Immediate publication on acceptance
• Inclusion in PubMed, CAS, Scopus and Google Scholar
• Research which is freely available for redistribution