B. LOUISE WEBSTER 19 66
A Thesis Submitted for the Degree of Doctor of Philosophy
The original work reported in this thesis is that of the candidate alone.
ß
.
4JJL
L
jDr. B.E» Y/esterlund has been more than generous with encouragement, guidance and valuable discussion in all phases of
this thesis. I am greatly indebted to him both for his kindness
in this and for continued access to his extensive data on planetary nebulae before publication.
I wish to thank Professor B.J. Bok for his interest in the work and Professor S.C.B. Gascoigne and Dr. D.J. Faulkner
for the benefit of many stimulating discussions. I am very
grateful to Dr. A.W. Rodgers for obtaining scanner observations of one of the objects and for his helpful comments.
It is a pleasure to thank Dr. K.G. Henize for kindly permitting me to make use of his catalogue of planetary nebulae prior to publication.
The care and cheerfulness with which Mrs. E.R.Y/ilkie typed the thesis is much appreciated.
H
1
5
2
P
la
n
e
ta
ri
e
s
P
la
Chapter 1. THE POTENTIAL OF SOUTHERN PLANETARY NEBULAE
1.1 Introduction 1
1 ,2 Physical processes and conditions 4
1.3 The evolution of a planetary nebula 6
1.4 The distances of planetary nebulae 13
1.5 Galactic distribution and kinematics 16
1.6 Groups of equidistant planetaries 19
1 ,7 The Magellanic Clouds 20
Chapter 2. THE OBSERVATIONS
2.1 Introduction 25
2-2 The photoelectric equipment 27
2.3 Calibration of the observations 29
2 r 4 The photoelectric observations 34
2.5 Qualitative observations 37
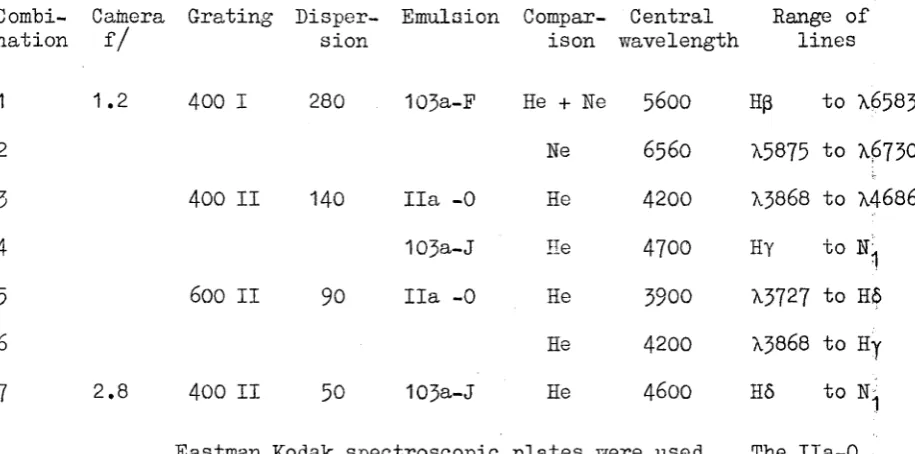
2.6 The spoctrographic equipment 39
2.7 Radial velocities 42
2.8 Relative line intensities 50
Chapter 3. DISTANCES FROM FLUXES AND DIMENSIONS
3.1 Distances from the assumption of constant mass 76
3.2 Hß fluxes in the Magellanic Clouds 79
3.3 A direct limit to the masses of Cloud planetaries 83
3.4 Masses by identification with galactic planetaries 86
3.5 Comparison with previous calibrations 90
3.6 Binary systems 92
3.7 The mass of a planetary nebula 93
3.8 Angular radii and filling factors 94
3.9 Absorption corrections and adopted distances 95
Chapter
4
. THE KINEMATICS OF THE PLANETARY NEBULAE4.1 The kinematics of planetaries in the Small
Magellanic Cloud 103
4.2 The kinematics of planetaries in the Large
Magellanic Cloud 104
4.3 The kinematics of the Large Magellanic Cloud 108
4.4 The kinematics of planetaries in the Galaxy 109
Cheap ter 5. PLANETARIES IN THE NORMA REGION OF THE GALAXY
5.1 The galactic distribution of planetaries in
Norma 114
6.2 The intensity of the nebular continuum 138
6.3 Star temperatures and luminosities 141
6.4 The evolution of the nuclei 145
CHAPTER 1
THE POTENTIAL OF SOUTHERN PLAHETARY NEBULAE
1.1 Introduction
lie physical state of a planetary nebula is, in general,
quite well understood, yet the phenomenon as a whole has not been
fitted completely satisfactorily into the framework of stellar evol
ution. It is known that a planetary is a body of gas, about a tenth
of a solar mass, surrounding with some degree of symmetry and ionized
by a hot, subluminous star from which it is presumed to have been
ejected. The gas is expanding at about 20 km/sec and the nebular
radii range from a few hundredths of a parsec, where the object can
first be recognized as a planetary, to about 0.7 parsec, where the
nebula blends into the interstellar medium.
The large accumulation of knowledge on these objects has
been extensively reviewed in the last few years by Aller (1956), Seaton (i960), Gurzadyan (1962 a), Osterbrock (1964) and Minkowski (1966).
Perek and Kohoutek (1966) have collated the observational data into a
general catalogue. The conclusions from these reviews are that there
is a large quantity of observational material, the physical mechanisms
responsible for the spectrum are satisfactorily known and the physical
conditions in the nebula are known qualitatively, but the finer details
remain to be elucidated and there is an uncertainty in all quantities
for which the derived values depend on distance, since this cannot be
It is widely accepted that a planetary nebula is formed from a not very massive star after the red giant stage and immediately before the white dwarf state. The mass in the shell is a significant fraction of the mass of such a star and must play an important role in
the evolution of the star. The evaluation of this role is hindered
by a lack of fundamental data caused by the inadequate distances. The most important of these are:
(1) the masses of the nebulae and of the nuclei,
(2) the population characteristics of the planetary subsystem,
(
3
) the position of the nuclei in the Hertzsprung-Russell(H-R) diagram.
Means of improving this situation in the Galaxy are limited. However, in the closest external galaxies to the Sun, the Magellanic Clouds, over seventy, intrinsically luminous planetary
nebulae have been identified. An unparalleled opportunity to study
a large group of equidistant planetaries is thus presented.
The primary purpose of this thesis has been to use this advantage in studying the three, poorly known characteristics mentioned
above. The first of these is intimately connected with the cali
bration of a distance scale for all objects. Information on the
second comes from the kinematics of the Cloud planetaries, the study of which is simplified by the knowledge of the relative positions of the
objects over the system. Finally, the temperature at which the central
3
One limitation of this work, at times an advantage, has been that only the brightest nebulae have been studied. Even
so the main difficulties associated with the program are observational ones. In particular, the central stars are fainter than 1 7th magni tude, yet narrow-band filters have to be employed in measuring them.
In some parts of the work it is important to have a comparison with galactic objects. The distribution of planetaries along the southern Milky Way has been studied by Henize (1 966) and shows a peak at new galactic longitude 1^'L = 330°. The region around this has been chosen for an intensive study, both as a comparison with the Clouds and to establish whether there is a true maximum in the space density in this direction or whether the interstellar absorption is abnormally low. Since the latter is partially true, we have been able to study the kinematics of objects distant from the Sun and close to, but not right at the galactic centre.
1.2 Physical processes and conditions
Ionization of the gas of the nebula by stellar ultra
violet quanta more energetic than the ionization limit is followed
by recombination with the associated emission of lines as the electrons
cascade to the ground state (Zanstra 1927? Menzel 1926). References
to a series of papers discussing this and other physical processes in
gaseous nebulae are given by Aller and Menzel (1945)- In addition
a continuum is formed from, recombination, free-free and two-photon
emission (Seaton 1955)? the free-free continuum remaining strong at
radio wavelengths. Any series of line ratios is determined by the
energy distribution of the star and the radiation field within the
nebula and references to the calculated decrements are given by
Seaton (i960). In the event that all the radiation able to ionize a given ion is absorbed, the intensities of the permitted lines of that
ion give a direct measure of the amount of this ionizing radiation
which cannot otherwise be observed below the earth’s atmosphere (Zanstra
1927? 1961). Stellar temperatures can therefore be estimated if an energy distribution, such as one of those calculated by Gebbie and
Seaton (19^3) or Bohm and Deinzer (1965)? Is assumed.
Ions in the gas can be excited, but only rarely ionised,
by electron impact. At the electron temperatures common in gaseous
nebulae, excitation generally occurs only in complex atoms and ions and
to low-lying metastable levels. The electron returns to the ground
5
dependence of the intensity of this radiation on the electron temper
ature and density permits these quantities to be evaluated from the
relative strengths of the forbidden lines (see e.g. Seaton i9 6 0).
Once the temperature and density have been found from lines of the
same ion, the chemical abundances may be estimated from the relative
intensities of both permitted and forbidden lines of different ions.
The enhancement of certain lines by the coincidental
fluorescent mechanism (Bowen 1934) has no application here.
The physical condition in the nebula can thus be deduced
from its spectrum. The ionization level within a nebula is stratified,
the atoms near the central star being highly ionized and the degree of
ionization decreasing outwards as photoionization is attenuating
radiation of progressively longer wavelength (Wilson 1930; Hummer
and Seaton 1964). Wilson (1958) has found that the shells are
expanding with velocities up to a few tens of kilometres per second.
The expansion velocities are greater for ions of lower excitation, from
which it is inferred that the outer parts are moving outwards more
rapidly than the inner regions. The general excitation level varies
considerably among the nebulae and the classification into ten groups
by Aller (1958) will be followed here.
The most recent abundance analyses by Aller (1964) show
that the helium to hydrogen ratio, 0.1
65
± 0.005 hy number of atoms,is higher than in the Sun but quite constant among the forty planetaries
the very underabundant planetary in M 15 (O'Dell, Peimbert and Kinman 1964) to the oxygen rich NGC 7027. There is some indication of a
variation in the neon to oxygen ratio. However, the heavy element
abundances are sufficiently close to normal to exclude the possibility that planetaries originate from metal-enriched peculiar stars (Aller
1959).
The electron temperatures are determined primarily by the balance between heating by photoionization and cooling by inelastic collisions, and lie between about 8000 °K and 20000 °K. The electron
7 -1
densities range from Nq ~ 10 cm in the densest planetaries known, to the low values at which the nebulae become indistinguishable from the interstellar medium (N < 1 0 cm" ). The values of both quantities depend on which line intensities are used for the determinations. The most plausible explanation for this is the presence of small scale inhomogeneities (Seaton and Osterbrock 19575 Osterbrock i 9 6 0 ) , which has been confirmed on large scale photographs of some objects (Zanstra
1955? Minkowski and Osterbrock i 9 6 0 ) .
These non-uniformities are superposed on the large scale density fluctuations responsible for the many curious but symmetrical shapes observed. In optically thick objects the outer edge is sharply defined at points where the ionizing radiation is exhausted (Stromgren 1939), but inside this edge, and throughout optically thin nebulae, the
distribution of the ionized hydrogen follows that of gas. (Unless
7
in the hydrogen Lyman continuum). The forms projected on the sky are,
in general, either ellip+ical, ring-like, biaxial or irregular. Evans
and Thackeray (1950) calculate that the distribution of axial ratios of the nebulae photographed by themselves and by Curtis (1918) is such that a considerable fraction of the planetaries must possess spherical
symmetry. Westerlund and Henize (
1966
) have amply confirmed thisconclusion in a more extensive and homogeneous photographic survey
of southern planetaries. The three-dimensional form of a ring-shaped
object has been suggested to be an ellipsoidal shell (Wilson 1950) or a dense toroidal form with faint extensions in other directions
(Khromov 1962). Each of these models is represented by certain of the
observed nebulae.
The form of the nebula has the potential to indicate the mechanism of its ejection and maintenance. Thus a flattened, equatorial nebula may result from rotationally forced ejection (Limber 1965)? whereas
spherical symmetry points to radial expulsion of gas after pulsation
or an explosion. Osterbrock (1
964
) has discussed the problem of maintaining the shape of the nebular shell and concludes that a force is
needed to restrain its outer edge. Forces supplied by mass loss from
the star (Mathews
1966
), interaction with the interstellar gas1 .3 The evolution of a planetary nebula
A relatively small dispersion in expansion velocity and
mass among planetaries permits the average lifetime of an observable shell 4
to be determined as a few times 10 years. Furthermore, the linear
dimensions of the shell serve to indicate the time interval from the
beginning of the planetary stage, so the evolution of the shell and nucleus
can be traced. Hubble (1922) was the first to notice that the spectral
character of a nucleus is related to the size of its shell and since then
it has become increasingly clear that the nuclei change drastically over
the short lifetimes of the nebulae.
No sensitive luminosity criteria are applicable to the
spectra of the central stars but a large range in this parameter is indi
cated. Features commonly seen in population I Wolf-Rayet (WR), 0 and
Of stars , which have extended atmospheres, are seen in some nuclei.
Others show broad, weak, low-luminosity features. The temperatures all
appear to be high. Aller and Wilson (1954) have measured the equivalent
widths and profiles of absorption lines in the cooler stars and derive
excitation temperatures greater than 30,000°K. The weakness or complete,
absence of observed lines in others indicates extremely high temperatures,
Greenstein and Minkowski (1964) have tentatively identified a high excit
ation line of 0 VI in two faint nuclei which must therefore have excitation
temperatures of more than 660,000°K. Broad emission lines, indicating
instability and possibly some mass loss, occur in some of the nuclei over
9
The difficulties in obtaining spectra of the faint central stars, and in subsequently interpreting' them, make photometric
methods more suitable for studying large numbers of objects. The
first uniform program of this kind was carried out by O ’Dell (1963 a) with measurements of Hß fluxes, angular dimensions and star magnitudes. The distances were calculated from a model of an optically thin nebula while the temperatures of the central stars were computed by assuming that the nebulae are optically thick and applying corrections to the
derived values. (Nuclear temperatures found from the Hß flux and the
magnitude of the star are hereafter referred to as Zanstra temperatures). O ’Dell found that the nuclei are spread over a large range in temperature and luminosity and that the radii of the nebulae increase as the nuclei, presumably, evolve from bright, cool to faint, hot positions.
Harman and Seaton (1966) established definite criteria for estimating optical depth and demonstrated that a nebula starts its life optically thick to the far ultraviolet radiation, then becomes thin progressively to quanta capable of ionizing K, He and He+ , and finally, as the luminosity of the nucleus drops, increases again in optical
depth. The first change, caused by expansion, had been realized
earlier, by Shklovsky (1956 a), for example. Certain features observed in planetaries place some of them in each of the three stages of develop
ment. Intrinsically small, dense nebulae are regular* in form and the
that neutral hydrogen is present. In rather larger objects the
Zanstra temperatures a.re lower than the star temperatures inferred
from their spectra, and faint, often irregular outer extensions to the
ionized gas confirm that ionizing radiation can escape. Minkowski
(1942)
has suggested that the presence of strongLO
II] simultaneouslywith He II in some large, low surface brightness planetaries, with
high Zanstra temperatures, points to their being optically thick.
With the correct optical depths, and temperatures
calculated from the H, He I and He II lines, Harman and Seaton (1964)
and Seaton (
1966
) showed that in the early stages of a planetary thecentral star increases in temperature and luminosity. The luminosity
ohange soon halts,but the temperature becomes even higher until degeneracy
stops the star fcom contracting and a drop in luminosity and cooling
towards the white dwarf state follows. There are features of this in
common with theoretical tracks of collapsing stars of 0.6 and 0.4
solar masses calculated by Fayashi, Hoshi and Suginoto (1962).
The evolutionary track of a planetary can be extra
polated back to investigate the nature of the object immediately pre
ceding it. Such a procedure leads to a cool supergiant or giant star
with hydrogen emission lines appearing in its spectrum after some
expansion (Deeming
1965
). The hypothesis that planetaries are evolvedstars also leads to the region of the H-R diagram above the main sequence,
but it is unlikely that the helium flash would supply enough energy to
throw off a shell at the top of the globular cluster red giant branch
11
The comparative ease with which planetaries are discovered
has resulted in much more information on their space density and distri
bution than on those of subluminous blue stars with temperatures and
luminosities like those of planetary nuclei. However, it is known that
hot stars below the main sequence are found in all population types and
are one or two orders more numerous than planetary nuclei (Cox and
Salpeter 1961; Greenstein 1966). Two of the classes, in particular,
have features in common with the nebulae. Novae are known to eject
shells with kinetic energies comparable to those of the planetaries.
The masses in the former are about a thousand times smaller, however, the
expansion velocities being correspondingly larger, and a high proportion
of the novae are binary systems (Kraft 1964) . The link between the two
phenomena would thus appear to be slender (Minkowski 1948) although
the same mechanism may be responsible for both. The spectra of some
subdwarf 0 and B stars resemble those of planetary nuclei, and the
temperature and luminosity ranges of the two classes are not dissimilar
(Greenstein 1966). It seems plausible either that a star passes through
each group in turn or that some minor difference prevents a shell from
being ejected or from being observed (see Osterbrock 19 6 4)•
The available figures on space densities and lifetimes
suggest that about 10 per cent of the white dwarfs may have passed
through the planetary stage, but there is still quite a large uncertainty
of population type than planetaries (G-reenstein 1966) so it could not
be as high as 100 per cent. However, it is possible that all stars pass down Vorontsov-Velyaminov1s
(
1953)
"blue-white sequence" and that all of those in a certain mass range do so either as planetariesor as subdwarf 0 or B s tars.
The stage immediately preceding the planetaries must
also be common to the evolution of a high proportion of the stars and
must be characterized by some sort of instability, either potential or
actual. This suggests an intrinsic variable, most of which arc also
connected with post-main-sequence evolution. The long period variables
have been suggested and are perhaps the most likely candidates. Their
kinematic and space properties cover a wide range but, like planetaries,
are mainly those of a disc population (Feast 1963)» Many of them
show hydrogen emission lines formed deep in the atmosphere and emission
lines of ionized iron and the light curves are not completely explained
by pure pulsation.
Merrill (1958) and others have suggested that planetaries
may pass through the symbiotic phase before the nebula reaches a more
conventional condition. The faint nebula around R Aqr, discovered
by Hubble, shows that gas may escape from such a system and with a type
of symmetry similar to that in some planetaries, but its expansion
velocity is probably higher than is typical for planetaries. If
13
characteristics of the cool component point to a connection of the latter
stars with the early stages of planetary formation.
1 »4 The distances of planetary nebulae
The planetary nebulae lie in the region of the H-R diagram
where spectroscopic and photometric luminosity and temperature criteria
are very insensitive. Since the nuclei cover a large luminosity range
and, furthermore, are evolving very rapidly over it, it is not possible
to derive their distances in ways similar to those for main-sequence
stars. As a consequence of its expansion, as well as of the change in
ionizing radiation, the nebular envelope also changes. Methods applicable
to all planetaries are therefore based on some assumptions regarding the
variation of the planetary with time and are calibrated by distances
found by the following means.
(a) Van Maanen (1923) measured trigonometrical parallaxes and
found a value significantly greater than the error only for NGC 7293»
(b) Proper motions have principally been measured by van Maanen
(1933) a^-d Anderson (1934). The data are inadequate to permit anything
but a mean parallax to be extracted as, for example, Barenago (1946) has
done.
(c) A few planetaries are binary systems and spectroscopic parallaxes
may be obtained for the companions. This has been done for the G8 to
KO dwarf associated with NGC 246 (Baum and Minkowski i9 6 0) and for the
super-posed on at least three other planetaries. The AO star in the direction of the centre of NGC 3132 has a velocity 17 km/sec higher than that of the nebula (Evans 1 9 6 5) and may not be connected with it. Vorontsov- Velyaminov (1 9 6 2) reports that the central star of W 68 is of spectral type B9? and Minkowski (1955) that there is an A5 star associated
with NGC 2346 (although there is no further reference to this in
There is some risk in generalizing the results for any of these binaries. Seaton (1966) regards NGC 246 as abnormal on the basis of its high He II \ 4 6 8 6 to Hß ratio. If the planetaries are highly evolved the masses of the stars from which they were formed must be greater than those of their unevolved companions which are assumed to have been formed at the same time. For the three objects with 339 to A O companions the masses would be greater than about three solar masses and the galactic distribution demonstrates that this is not true for the majority of the planetaries.
(d) The planetary in M 15 appears to be unusual in having an
abnormally bright central star and a subluminous nebula (^Minkowski 1966). It has a normal helium content but is deficient in oxygen (O’Dell,
Peimbert and Kinman 1964).
15
Osterbrock (1964). Liller’s work (19^5) on fourteen planetaries
demonstrates the difficulties in the approach, both observationally and
in the interpretation. The observed rate of expansion is affected by
the variation of expansion with ionization level, optical depth and
mass loss from the central star. It seems that the information is more
profitably used in studying these properties, as Liller has done, than
in deriving dubious distances.
(f) The upper limit to the luminosity has been measured in some
external galaxies and will be described later.
(g) Seaton (1966) assumes a homogeneous, spherical nebula and from
the observed value for the Hß brightness and an electron density from
forbidden line ratios derives the linear radii of fourteen planetaries.
The distances, which follow from the angular dimensions, are very
sensitive to the electron densities and systematic errors can follow if
density fluctuations axe present.
An observed decrease in surface brightness with increasing
radius has been the foundation of several general methods for determining
distances. Vorontsov-Yelyaminov (1954 a; b) explained the relation
in terms of constant absolute magnitude for all the nebulae. A similar
assumption had been made by Zanstra (1951) and. was developed by Berman
(1957) and Parenago (1946). The hydrogen line flux of an optically
thick nebula is determined by the radiation of the central star and is
nebula becomes optically thin, and the ionizing radiation can escape, the flux is proportional to the electron density so decreases with time and the assumption of constant magnitude breaks down.
In an optically thin nebula, in the absence of continued mass loss from the star, the mass of ionized gas remains constant and
this leads to a relation between surface brightness and linear dimensions. Shklovsky (1956 a$ b) used the fact that since the linear dimensions
calculated from this depend on the mass only to the two-fifths power, the assumption that the mass is constant can lead to quite accurate
distances. This method, employed by Minkowski and Aller (1954)?
has been recalibrated and adapted to the more meaningful Hß fluxes by O ’Dell (1962) and Seaton (1 966).
Kohoutek (196O5 1961) uses the star magnitudes and temperatures in an effort to take individual masses into account.
Minkowski (1964) outlines the principle on which the optical depth may be simply estimated and the correct method adopted for nebulae excited
by similar central stars. The initial rise in temperature and luminosity
of the nuclei found by Karman and Seaton (1964)5 makes the division less clear. Minkowski points out, however, that even if both these diffi culties are overcome, the irregularity of the gas distribution sets a limit to the attainable accuracy.
1 .5 Galactic distribution and kinematics
H
assumed that the majority of these are actually at the centre.
Minkowski (1966) points out that the excess of small diameter objects
(Minkowski 1951) relative to the distribution in the solar neighbour
hood (O'Dell 1962) indicates that discoveries in the centre are incomplete
and that the concentration may be even more pronounced. On the other
hand, Perek
(1963
a; b) has calculated the distances of all resolvedplanetaries towards the centre by the general methods described in
section 1.4. The resulting galactic distribution is quite uniform,
with no preference for a particular distance. Although many of these
planetaries must obviously lie between the Sun and the galactic centre,
the majority of them are expected to be in the central bulge. The
cause of the apparently uniform distribution is, then, the inadequacy
either of a general absorption model or of the method of finding the
distances.
On the basis of this strong concentration to the centre
direction, coupled with a moderate concentration to the galactic plane
(Minkowski and Abell
1963
)» the planetaries have been assigned to thedisc population (Oort 1959)« Recent estimates of the mean distance
from the plane range from 280 parsec (O’Dell 1962) to 500 parsec
(see Seaton
1966
), equivalent to that of stars of mass less than orequal to 1.2 solar masses. No planetary is known to be associated
with extreme population I, but those with A-type companions and the more
population I. Some membership in extreme population II is evidenced
by the planetary in M 15 and by the planetary near the north galactic
pole (Haro 1951) which, since it is faint and unresolved, must be a
considerable distance from the galactic plane. High velocity planetaries,
especially those near the anticentre, must belong to one of the oldest
populations.
A satisfactory kinematic model of the subsystem has not
been constructed because of the inaccurate distances. There are some
obvious tendencies, though. The radial velocities have been measured
principally by Campbell and Moore (1918) and Mayall and Minkowski
(unpublished). Between 8 and 12 kiloparsecs from the galactic centre
the system displays signs of differential rotation but with low angular
velocities and a higher dispersion than the extreme population I
(Minkowski 196 4). Minkowski (1966) notes, however, that since Berman
(1957) derives a value for Oort’s constant of A = 14 km/sec/kpc, the
kinematics of these two populations may be quite similar.
The most striking feature of the velocities is the
extremely large velocity dispersion of the planetaries in the centre
direction (Minkowski 1964). This discovery emphasizes the importance
of this subsystem, of which the members can be identified and studied
at large distances, in the investigation of the galactic distribution
19
1.6 Groups of equidistant planetaries
To investigate the validity of the existing ways of
finding the distances of planetaries and, hopefully, to advance to a
more satisfactory general method, accurate distances of many more
individual objects are needed. The galactic centre has frequently
been suggested as an excellent place to look for a distance dependent
parameter or combination of parameters. Perek’s work illustrates the
problems posed, in this direction, by the absorption corrections and by
contamination of the group of planetaries at the centre by objects
closer to the Sun. Other opportunities to study equidistant groups are
found in external galaxies. Here the complications of the galactic
centre are avoided, but the great advantage of knowing the angular
dimensions is lost for all but the very largest nebulae.
The most distant system in which planetaries have been
found is M 31 • Baade (1955) identified five suspected planetary
nebulae in a field rich in population II and Miss Swope (1963) measured
their mean photographic magnitude as -2.55* The similarity of M 31
to our Galaxy suggests that these objects are similar to galactic planet
aries, but their large distance modulus limits further work.
The closest galaxies to the Sun, the Magellanic Clouds,
are sufficiently far away that their constituents may be regarded as
equidistant, their foreground obscuration is small and they have been
excellent for distance studies but they have the disadvantage that they
are dwarf, irregular systems, rich in extreme population I, and there
may be some intrinsic difference in planetaries in them that would
invalidate any generalizations. The data are sufficiently plentiful
for an evaluation of this possibility to be made and it will be discussed
in the next section.
It will be interesting, in the future, to look for
planetaries in the dwarf elliptical systems, Sculptor (m-M = 19»7) and
Draco (m-M = 20.o) being the closest. Their stars appear from colour
magnitude arrays to belong to population II. Sculptor (Hodge 1965)
bears some resemblance to M 5> a globular cluster of intermediate metal
richness, while Draco shows some evidence of being extremely metal poor
(Baade and Swope 1961). Planetaries as luminous as the brightest in
the Magellanic Clouds would be found at photographic magnitudes of
16/7-Data on planetary nebulae in these systems would complement the inform
ation on the Magellanic irregulars.
1.7 The Magellanic Clouds
Before assuming similar properties for individual planet
aries and the planetary subsystem in both the Galaxy and the Magellanic
Clouds the validity of this assumption should be examined. The most
important parameters that must be compared are the chemical abundance
and the age of any system of objects. Detailed reviews on the Large
21
published by Buscombe, Gascoigne and de Vaucouleurs (1954)? Thackeray
(1963)
and Bok(1966)
and only investigations dealing with these twoparameters will be discussed.
The subsystems within the Clouds have been outlined by
Westerlund (1965)» Each contains a central body of mixed population,
a complex of population I objects, an intermediate age disc and a halo
containing old globular clusters. That the relative proportions of
these populations differs between each Cloud and the Galaxy is most
graphically illustrated by the percentage of the mass that is in the
form of neutral hydrogen. In the LMC it is between 5 and. 9 per cent
(McGee and Milton 1966) and in the SMC it is about 30 per cent (Hindman
and Sinclair 1965). The corresponding value in the Galaxy is less than
5 per cent but the percentage rises to 17 per cent in the solar
neighbourhood (Oort
1966).
Some understanding of the progress of star formation in
galaxies has been gained in the last few years. The Galaxy is thought
to have collapsed from a spherical cloud over a short time span, while
the halo population was forming (Eggen, Lynden-Bell and Sandage 1962).
Star formation was most active in the initial stages (Dixon 1965)» In
the Magellanic Clouds the comparative scarcity of objects as old as those
in the galactic halo suggests that the stars were being formed less
rapidly in the Clouds than in the Galaxy in the early lives of these
systems (Tifft
1964).
There is some evidence for subsequent discreteWesterlund (19615 1 9 6 4) finds that Shapley*s Constel lations in the Large Cloud are of the same age. Westerlund and
Mathewson (1966) suggest that the reason for bursts of star birth could by type I super-supernovae, the surface distribution of young stars
and hydrogen supporting this interpretation. The distribution of the
periods of cepheids is also consistent with discontinuous star formation
(Gascoigne 1965). Longer period cepheids (more massive) are common in
the main body of the SMC, but the cepheids in the bar of the LMC are predominantly of short period.
In the older populations, which are more relevant to planetaries, a similar phenomenon is found among the globular clusters. Gascoigne (1966) divides the colour-magnitude diagrams of these into
four main classes. Old globular clusters, similar to galactic halo
ones, are found in both Clouds. Five of the seven bright Small Cloud
globular clusters resemble galactic disc clusters and were formed,
9
practically simultaneously, about 10 years ago. NGC 17^3? in the
Large Cloud, has some features in common with these. The last group
comprises three similar clusters in the LMC unlike any found previously. If star formation occurs in bursts, as these investi gations suggest, the distribution of the ages and masses of the stars from which planetaries are formed cannot be expected to be the same in
eaeh Cloud and in the Galaxy. However, the subsystem will bear the
same relation to the other populations in all three galaxies.
23
Inherent differences, such as could be attributed to
different chemical compositions, may also be present and the available
data is summarized by Roberts
(1963).
The most obvious anomaliesarise in the period-luminosity relation for the cepheids which differs
in all three galaxies. Indications of metal deficiency in open
cluster colour-magnitude diagrams (see Arp 1959
)
are open to doubt(Feast
i960).
On the other hand, Roberts lists a large number ofinvestigations, mostly on population I objects, which find no abundance
or other anomalies in the Clouds. To these can be added the high
dispersion analysis of an LMC supergiant by Przybylski
(1965)
whichshows a fairly normal metal abundance. Dickel, Aller and Faulkner
(
1 964)
and Faulkner and Aller(1965)
Have found helium and metal abundances in gaseous nebulae in both Clouds to be only very slightly, about
30 per cent, lower than normal. Thus no inherent difference between
the Clouds and the GaRaxy that will affect the interpretation of the
planetaries has been established.
Neither has any difference between galactic planetaries
and those in the Clouds been found with the available information. All
the brighter planetary nebulae in both Clouds are thought to have been
discovered and have been discussed by Henize
(
1 9 5 6),
Koelbloed(
1 956),
Westerland and Rodgers
(
1 9 59)?
Lindsay(1961),
Svcstka(1962),
Lindsayand Mullan
(1963),
Henize and Westerlund (1963 and Westerlund and Smithnebulae primarily on the basis of their mass. It was shown that the
planetary nebulae are unresolved, fainter than M = -3.0 and generally PS
with moderately high excitation. The number per unit mass of the
galaxy is of the same order in both Clouds as in the Galaxy. Feast
(1964 a) has obtained spectrograms of nine planetaries and detects the
lines normally present in galactic objects.
Certainly, then, to a first approximation, and possibly
to quite a high degree of accuracy, the Cloud planetaries resemble their
galactic counterparts. However, when any generalization on population
characteristics, except differential ones, derived from investigations
on the Clouds is made, one should bear in mind the effect of the
CHAPTER 2
THE OBSERVATIONS
2.1 Introduction
The distance moduli of the Large and Small Magellanic
Clouds adopted in this work are (m - M)q = 18.7 and 19.0, respectively
(Bok 1966), and the absorption is taken to be A^ = 0.2 magnitudes in
front of each system (Feast, Thackeray and Wesselink i960). Since
planetary nebulae in the Clouds are fainter than M ^ = -3.0, the data
that can be collected on them in a reasonable observing time is limited.
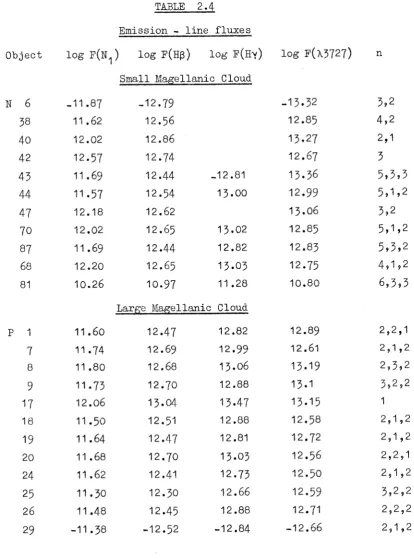
Accordingly, the observing program has been planned to measure absolute
values of the fluxes of only the strong lines, N ^ , Hß, HY and LO IIJ
k 3727» by the accurate photoelectric method. The interference filter
technique has been used, rather than that of spectral scanning, as this
enables more, and fainter objects to be observed. The intensities of
the weaker lines, particularly those of helium, are estimated relative
to the strong ones from supplementary, medium-dispersion spectrograms.
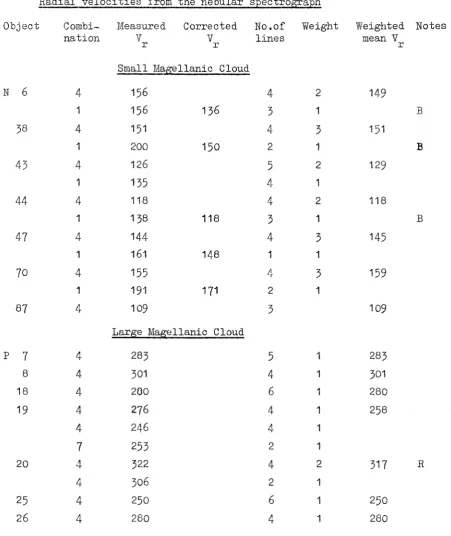
Radial velocities are also determined.
In unresolved objects the magnitude of the central star can
only be found from the flux at wavelengths between strong nebular emission,
corrected for the contribution from the nebular continuum. Narrow-band
o
filters have been chosen to isolate the wavelength regions around 3500 A,
Johnson U, B, V effective wavelengths, which facilitates comparison
with the widely used two-colour diagram.
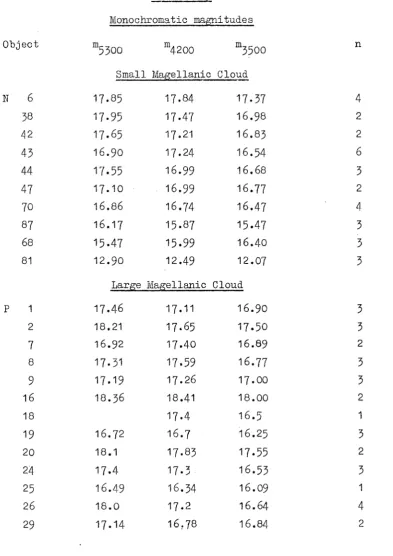
The monochromatic magnitudes of the continuum at these
three wavelengths will be referred to as m_,-_-, m.«-- and m r7AA, and the
° 3 5 0 0’ 4200 5 3 0 0’
derived monochromatic magnitude at 4861 A as • For convenience
in tables, some of the more common nebular emission lines will be denoted
by their wavelengths only. These are
Co
IIJ X 3727» [Ne III] X 3868,[S II] X 4068, X 6730, [0 III] X 4363, He I X 4471» He II X 4 6 8 6, [Ar IV]
X 4740, He I X 5875 and [n II] X 6 5 8 3.
Planetaries in the Small Cloud were selected from the
nebulae that are unresolved on the large-scale photographs of Henize and
Westerlund (1963)« In the Large Cloud the source was the catalogue of
Westerlund and Smith (1 96 3) and the objects were chosen to include most
of the brightest planetaries, but with sufficient of the fainter ones to
cover a considerable range in magnitude and surface distribution over the
Cloud, Some planetaries in common with those of Feast's work (1964 a)
were studied.
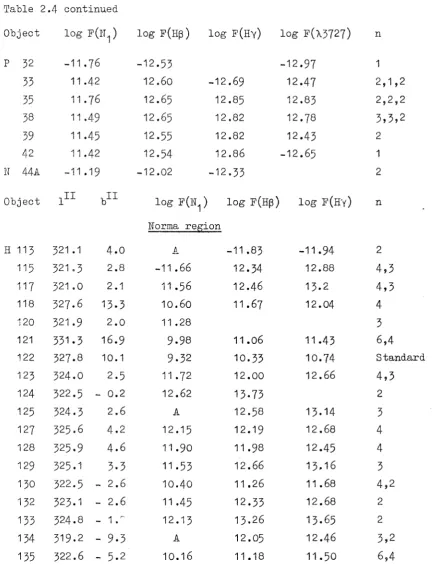
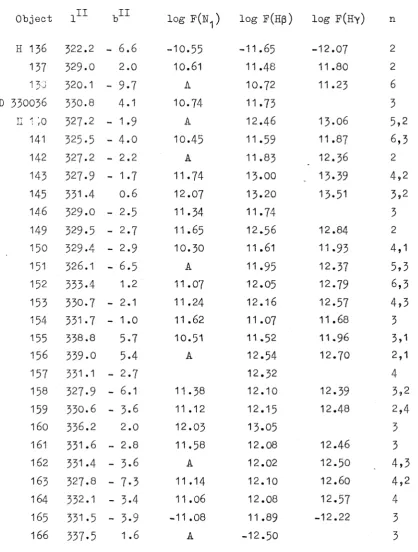
In the Galaxy, all objects, except H 168 (NGC 6164—65)y
in a region in Norma between galactic longitudes 1 ^ = 320° and 340°
that Henize (19 6 6) has identified as planetary nebulae from an Ha survey
have been observed. In order that space densities may be compared at
different galactic longitudes, N^ and Hß have been measured for planetaries
27
few objects closer to the plane were excluded because of the very uneven
interstellar absorption at low galactic latitude.
The catalogue of Perek and Kohoutek (1966) will define the
future notation for planetaries, but in the interim the objects are
referred to by their numbers in the catalogues from which they were
selected. N prefixes planetaries in the SMC, P those in the LMC and H
those in the Galaxy.
2.2 The -photoelectric equipment
The photoelectric observations were made with a single
channel photoelectric photometer attached to the Cassegrain focus of the
40-inch reflector at Siding Spring Observatory. The scale at the focus
of the f/18 bean is 11.5 seconds of arc per millimetre. The photometer
is similar to that described by Johnson (1962) and incorporates an R.C.A.
1P21 photomultiplier, always used refrigerated by dry ice. The output
current from the cell is amplified by a General Radio amplifier, type
number 12$0-A, and recorded on a Brown recorder. The steps in the volt
age range of the amplifier were calibrated at approximately yearly inter
vals and found to remain constant. The resistant steps were calibrated
during each observing run on star signals or on a constant light source,
and variations of up to 2 per cent between any two steps were found over
the eighteen months in which measurements were made.
The transmission characteristics of the interference
28
TABLE 2.1
The transmission characteristics of the filters
Peak Half
wavelength width
Feature ( A ) ( A )
continuum 5300 140
N 1 5006 30
Hß 4864 25
H y 4346 25
continuum 4200 70
LO II] 3727 25
continuum 3500 90
Peak transmission
( * )
Manufacturer60 Spoctrolab
57 Spectrolab
65 Spectrolab
32 Grubb Parsons
50 Spectrolab
30 Spectrolab
40 Schott
These were measured with a Beckman spectrophotometer both
at the beginning and towards the end of the observing period and no changes
could be detected over this interval. The accuracy in the wavelength
measures is a few angstroms, adequate for the wider-band filters and as
a check on the stability of the others, but the transmission curves of
the very narrow-band filters, , Hß and Hy, were remeasured using the
coude spectrograph. A beam converging from a tungsten filament lamp
was passed through a filter into the spectrograph and photographed at a
dispersion of 2.7 /-/mm. An argon comparison spectrum and a wedge cali
bration were produced on the plate as in the normal operation of the
instrument. Intensity tracings of the plates were calibrated for the
percentage transmission with the values from the spectrophotometer.
le
d
fi
lt
e
r
tr
ans
mis
sio
n
c
u
rv
e
29
a spectral scan of a typical planetary in Figure 2.1. In Figure 2.2
the wavelength regions occupied by the Doppler-shifted lines are shown
with respect to the very narrow filters. No correction for velocity is
necessary to the N . or Ilß fluxes but the Hy fluxes need to be corrected
both for wavelength shifts and for the contribution from LO III] \ 43^3 •
Irregularities in transmission over the filters were found
to be as high as 30 per cent. This could be expected to give rise to
appreciable errors in the measurement of planetaries of large angular
extent. In the present program the objects measured generally had
small angular dimensions similar* to those of the standards and the error
introduced was small.
2.3 Calibration of the observations
The wavelength bands chosen are narrow, and any change of
effective wavelength with energy distribution is expected to be too small
to affect the extinction coefficient. This was verified by deriving
extinction coefficients from observations of two stars of spectral types
AO and KO.
Multilayer interference filters are an effective means of
achieving such bands, but their transmission characteristics are subject
to long term changes with time. Intercomparison of intensities should
therefore only be made between objects with similar spectral features,
so that these changes will affect the transmission of light from both
selected, at convenient positions in the sky, one set applicable to the
emission line intensities and. the other to the strength of the continuum.
For the continuum measurements stars of «pectral type AO
or earlier were used. The continuum was measured in magnitudes per
unit frequency interval, adjusted to equal the Johnson V magnitude at
o
its effective wavelength, 5460 A. Since the pass-bands of the filters
avoid the hydrogen and helium lines, the secondary standards could be
calibrated by direct comparison with spectrophotometric standard stars.
The secondary standards themselves form a system consistent to 0.01
magnitudes, but the four primary standards gave different calibrations
of the colour indices in this system. Differences in the n u _ ^ band
were as great as 0.1 magnitudes. The pass-band of this filter is quite
wide. Consequently, to minimize any inaccuracy introduced by the
application of the different band-widths of scanning and filter techniques
to various energy distributions, the greatest weight in the calibration
of the southern standards was given to the primary standards closest in
spectral energy distribution to planetary nuclei. In Table 2.2, part (a),
the primary standards and their monochromatic magnitudes as measured by
Code (i960) and Oke (1964) are given. In part (b), the secondary standards set up for the present v/ork. are listed.
Secondary standards for the line fluxes were chosen,
wherever possible, from the bright planetaries with angular diameters
as well as continuum standards in each of the Magellanic Clouds, since there were no suitable unresolved emission line objects and the frequent use of very small diaphragms made a standard of stellar appearance
necessary. This situation is very sensitive to drifts in the filter
characteristics, since the intensity of the continuum source, which depends on the whole pass-band of the filter, will change in a different
way from that of the line source, at a specific wavelength. Standard
planetaries were therefore measured on several nights during each run. The calibration of the secondary standard stars changed by only 10 per cent over the observing period.
The difficulties associated with photographic photometry of emission lines are avoided by the use of photoelectric methods and the absolute fluxes and relative intensities of the strong lines are
now known for many planetaries. Whereas the absolute fluxes refer to
the emission over the whole surface of the nebula, frequently only a section of the planetary is selected by the slit of the spectrograph or scanner ./hen relative line strengths are determined. Since the distri bution of the ions around the central star depends on their excitation, the ratios of lines from a small area are not necessarily the same as
++ +
from the whole nebula. The distribution of the 0 and H ions is
similar in most planetaries but differs from that of the 0"r ions.
The published to Hß ratios are not always the same
TABLE 2 . 2
( a ) P r im a r y s t a n d a r d s f o r m onochrom atic m a g n itu d e s
O b je c t Sp V
rn5300 m4200 m3500 R e f e r e n c e s
r 2
§ Get AO 4 . 2 7 4 . 2 5 4 . 0 6 5 .1 5 0 , JM
_3
n O r i F6 3 .1 6 3 . 2 0 3 . 5 6 4 . 5 3 C, JM
V O r i BO 4 . 5 9 4 . 5 6 4 .1 8 4 . 0 7 C, JM
58 Aql AO 5 .5 7 5 .5 7 5 .5 3 6 . 8 5 0
U ) S e c o n d a r y s t a n d a r d s f o r m onochrom atic m a g n itu d e s
O b j e c t Sp V
m5300 m4200 m3500 R e f e r e n c e s
ED 3719 AO 6 .8 4 6 . 8 5 6 . 7 9 8 . 0 7 A, W
ED 25938 AO 6 . 5 7 6 . 5 6 6 . 4 6 7 . 7 0 ¥
ED 147152 B6 5 . 3 6 5 .2 9 5 .1 2 5 .7 4 M
HE) 86659* B4 6 .2 5 6 . 1 5 5 . 9 4 6 . 5 0 M
ED 158186* B3 6.81 6 . 9 5 6 .8 7 6 . 8 7 M
* Lovr w e i g h t . Used on o n l y two n i g h t s
R e f e r e n c e s
0 O ke, J . B . , Ap. J • j ,440., 689, 1964
JM J o h n s o n , H,, L . , an d Morgan, W.W., Ap. J •> U 2 . 313, 1953
A A rp, H ., A,, J . , 6 j , 118, 1958
W W e s s e l i n k , A. J . , M.N.R.A . S . , 12£, 359 , 1962
M M o r r i s , P.M. , M .N .R .A .S ., .122, 325, 1961
33
TABLE 2 .3
( a ) P r i m a r y s t a n d a r d s f o r l i n e f l u x e s
O b j e c t l o g F(1T1 ) l o g F(Hß) l o g F(Hy) l o g f(^3 7 2 7 ) R e f e r e n c e s
IG 418 > 9 . 4 0 - 9 . 5 4 - 9 . 9 2 - 9 .3 7 L,CD,LA,OCB,0
NGC 3242 8 . 6 4 9.81 L , CDO
NGC 6572 8 . 7 0 9 .7 7 10.21 L,CD,LA,OCB
ngc 7009 8 . 6 9 9 .7 6 1 0 .1 4 L,Li,OCB
0>) S e c o n d a r y s t a n d a r d s f o r l i n e f l u x e s
O b j e c t l o g F (ll^j ) l o g F(Hß) l o g F(Hy) l o g F ( \ 3727) R e f e r e n c e s
NGC 2857 - 9 . 4 3 - 1 0 . 5 6 - 1 0 . 9 5 AF
NGC 3918 8 . 8 0 10.01 AF
NGC 5882 9 . 3 2 1 0 .3 3 1 0 .7 4
NGC 6326 9 . 9 0 11.0 5 11 .41 AF
HD 3719* 9 . 7 0 9 . 8 9 9 .4 5 9 .7 0
HD :25538* - 9 .6 0 - 9 .7 4 - 9 .3 5 - 9 . 5 3
* The f l u x e s g i v e n a r e f u n c t i o n s o f t h e f i l t e r s and t h e v a l u e s a r e l i s t e d o n ly f o r c o m p le te n e s s
mean
R e f e r e n c e s
L L i l l e r , W. , Ap. J . , 122, 240, 1955
CD C a p r i o t t i , E . R . , and Daub, C . T . , Ap.. J . , V£2, 677, 1960
AF A l l e r , L . H . , an d F a u l k n e r , D . J . , IAU/URSI Symposium N o .20, 45 ( A u s t r a l i a n Acad. S e i , , C a n b e r r a ) , 1964
CDO C o l l i n s , Q .Yi., Daub, C
4 7 1 , I960
. T . , and O’D e l l , C .R ., Ap ♦ j . , 3^33.»
LA L i l l e r , W. , and A l l e r , L . H . , Ap. J . , L20, 48, 1954 OCB O s t e r b r o c k , D . E . , C a p r i o t t i , E .R . and B a u tz ,
Ap. J . , jj>ß, 62, 1963
L . P . ,
quoted as about 5 per cent. The system of southern secondary standards
set up for the present work is consistent to 1 per cent and the line
strengths of the previously measured planetaries used in its calibration
were therefore taken from both types of measurement, as specified in
Table 2.3? to give the best agreement among themselves for the southern
system. LO III was measured only in the Magellanic Clouds and IC 418
was the sole standard. The emission of both [o II] and H comes princi
pally from the outer shell of this nebula (Aller 1956), so the absolute
flux of LO II] \ 3727 can be calculated from its intensity relative to H ß .
Line fluxes derived by comparison with NGC 6572 'were found
to be systematically 10 per cent brighter than those from the other
nebulae. Its declination is +6° while the other three lie between -10°
and -20°, and it is evident that a declination effect is responsible for
the difference. NGC 6572 is small, bright, and a northern standard,
whereas the more southern primary objects are more difficult to measure
from northern latitudes. However, the calibration from the three latter
objects has been taken here, as they agree well with each other and are
widely distributed in right ascension. The values adopted for the -2 -1 logarithms of the fluxes, log F(\), are measured in ergs cm” sec” and
are listed in Table 2.3, part (b).
2.4 The photoelectric observations
The Hß fluxes were corrected for the Doppler shift in
35
curve measured on the coude spectrograph and the velocities and line
intensities given in Tables 2.11, 2.15 and 2.14 were used. In cases
for which the intensity of the oxygen line relative to that of Hy was not known, a ratio of one to five was assumed. This ratio was taken as the mean of the line ratios of planetaries that Aller (1956) uses to illustrate the medium excitation classes 5 to 8,
The continuum contributed a significant amount to the observed line fluxes in about one quarter of the objects, although it was less than 5 per cent in all but ten peculiar ones. To correct for this, four Of stars were selected on the basis that, on spectrograms from the Mount Stromlo plate files, the Hß and Hy absorption lines were
filled in with emission, giving an effectively continuous spectrum. Their energy distribution is comparable to that expected in the central
star of a planetary. Each of these stars was observed through both
the line and tne continuum filters and the contribution to the observed line intensity from the continuum was determined relative to the magnitude of the continuum. Corrections to the line fluxes were then applied.
For two planetaries with bright stars of spectral type AO in the direction of their centres, corrections were derived from similar measurements
of the AO secondary standards.
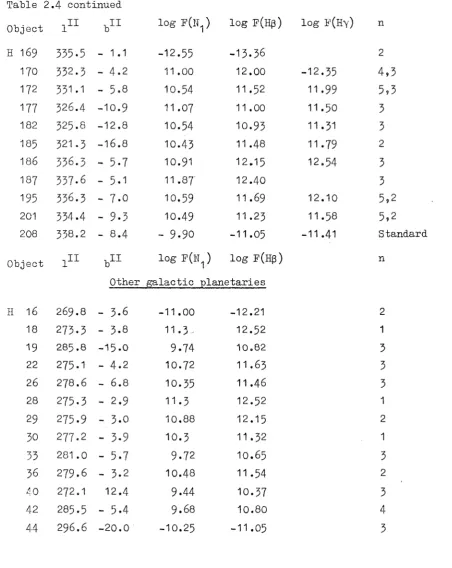
The corrected line fluxes and the continuum magnitudes
are listed in Tables 2.4 and 2.5. These, and other tables giving the
end of this chapter. The weight to be assigned to the observations is
denoted by n, and is, in general, the number of nights on which the
object was measured. Some delay in the acquisition of the Hy and
Lo
II]X
3727
led- to and Hß being observed more frequently thanthese lines. Where three numbers are specified for the lines, instead
of one, they refer to and Hß, to Iiy and to
X
3727» in this order.The probable error in a single observation, n = 1, is
a function of the magnitude or the logarithm of the flux and is given
in Table 2.6.
TABLE 2.6
The accuracy of the photoelectric observations
- log flux p.e. observed
magnitude P
observed • £ •
calculated
10 0.005 13 0.03
11 0.008 14 0.04
12 0.016 15 0.06
13 0.03 16 0.14 0.08
17 0.28 0.20
Observations in the lines could be pursued to the faint, small nebulae
with moderate results, but in planetaries with large angular dimensions
and low surface-brightness the accuracy was limited by increased noise
from the sky background and interference from field stars. Except in
these cases, no dependence of the errors on the angular diameter of a
C lo u d s w ere s m a l l. C row ding o f th e f i e l d s an d i r r e g u l a r i t i e s i n th e
f a i n t i o n i z e d g a s o f t h e b ack g ro u n d in c r e a s e d th e e r r o r s , w hich were
a b o u t 0 .1 0 i n th e l o g a r i th m o f th e f l u x .
I n th e co n tin u u m th e a c c u r a c y was l i m i t e d by p h o to n
f l u c t u a t i o n s f o r s t a r s f a i n t e r th a n 15t h m a g n itu d e . To a s s e s s t h i s
e f f e c t , t h e o r e t i c a l e r r o r s w ere c a l c u l a t e d f o r th e f i l t e r s u s e d , an
i n t e g r a t i o n tim e o f 100 se c o n d s and a quantum e f f i c i e n c y o f 10 p e r c e n t .
I t was assum ed t h a t th e sk y h a s a m a g n itu d e o f V = 1 6 .0 th r o u g h a 10 seco n d
o f a r c d ia m e te r d ia p h ra g m ( A lle n 1 9 6 2 ), t h i s b e in g c o n s i s t e n t w ith th e
d e f l e c t i o n s t h a t w ere o b ta in e d on a good n i g h t . The a c c u r a c y was lo w e re d
by th e p r e s e n c e o f th e moon, by th e u s e o f l a r g e r a p e r t u r e s and by d i f f i
c u l t i e s i n r e a d i n g s m a ll d e f l e c t i o n s on th e r e c o r d e r , b u t lo n g e r i n t e g
r a t i o n tim e s w ere u s e d to c o u n t e r a c t t h e s e . I n view o f t h i s , th e
e r r o r s fo u n d i n p r a c t i c e , w hich a r e s e e n i n T a b le 2 .6 to be o n ly a l i t t l e
g r e a t e r th a n th e t h e o r e t i c a l oncL f o r 100 seco n d i n t e g r a t i o n s , a r e
r e g a r d e d a s v e r y s a t i s f a c t o r y .
2 .5 Q u a l i t a t i v e m easu rem en ts
On s e v e r a l n i g h t s when a c c u r a t e p h o to m e try was im p o s s ib le
th e r e l a t i v e i n t e n s i t i e s o f l i n e s c o u ld s t i l l be e s t i m a t e d . The l a r g e
d i f f e r e n c e s i n th e r a t i o o f t o Hß fo u n d among p l a n e t a r i e s and e m is s io n
l i n e s t a r s a llo w e v en ro u g h v a lu e s t o g iv e u s e f u l i n f o r m a tio n . The
r a t i o was i n v e s t i g a t e d i n a b o u t s i x t y u n r e s o lv e d o b j e c t s , p r o v i s i o n a l l y
Way. Similar percentages of the light from the lines were transmitted so the relative intensity was estimated directly from the amplified
output. The sky readings were effectively the same for each filter
and had negligible effect on the result.
Identification charts were made from direct plates in the Ha + Cn II] region while the brightness of the object in visual light was determined by the green lines of LO IIIJ and H ß . Variations in the ratio of the red to green lines caused changes in the brightness of the suspected planetary relative to surrounding field stars on the
charts and visually at the telescope. In some objects for which the
red light was strong neither nor Hß could be detected photoelectrically,
and it is suspected, because of their high Ha/Hß ratios, that these might be Be stars.
The sixty stellar objects have been divided into three classes according to the line ratios and are listed in Table 2.7« Hebulae with 11^ = Hß are regarded as being probably, though not con
clusively, planetaries and are placed in class A. Class B contains
objects with Hß > 1T^ which may be either low excitation planetaries or
emission-line stars. Objects in Class C should be regarded as very
doubtful planetaries until further information is obtained. The first