WHITE DWARF STARS
A THESIS SUBMITTED FOR THE DEGREE OF DOCTOR OF PHILOSOPHY IN THE
AUSTRALIAN NATIONAL UNIVERSITY
R.A. BELL
P r e f a t o r y Note
&
/
The w ork r e p o r t e d i n t h i s t h e s i s was c a r r i e d o u t d u r in g t h e t e n u r e o f a R e se a rc h S c h o la r s h ip i n t h e D ep artm en t o f A stronom y
i n t h e R e s e a rc h S ch o o l o f P h y s ic a l S c ie n c e s o f t h e A u s t r a l i a n N a tio n a l U n i v e r s i t y . P a r t o f t h e work was c a r r i e d o u t a t K in g ’ s C o lle g e , London, P r in c e t o n U n i v e r s i t y and t h e C a l i f o r n i a I n s t i t u t e o f T echnology w ith t h e a i d o f g r a n t s from t h e U n ite d S t a t e s A ir F orce and P r i n c e t o n U n i v e r s i t y . The work r e p o r t e d h e r e i n was p e rfo rm e d w h o lly h y t h e c a n d i d a te .
«
TABLE OF CONTENTS
Chapter 1. Introduction p. 1
Chapter 2. Observations of Southern White Dwarfs p. 10
Chapter 3» Model Atmospheres for White Dwarfs p. 16
Chapter 4. The A^-670 Stars p. 26
Acknowledgement s
I am much indebted to all members of Mt. Stromlo Observatory who have helped me in this study. Professor B.J. Bok has been a constant source of encouragement and, as well as acting as one of my supervisors, kindly arranged my visit to London with Professor H. Bondi. Dr. T. Dunham also acted as one of my supervisors at Mt. Stromlo whilst Dr. F.A.E. Pirani acted as my supervisor in London. I should also like to thank
Professors L. Spitzer and M. Schwarzschild for enabling me to
1
CHAPTER 1
White dwarf stars were first discovered only fifty years ago,
when the science of astrophysics was in its infancy. The original
discovery appears to have been made by Russell (l). He had just found
from his work on trigonometrical parallaxes that all intrinsically faint stars were of spectral type M and then learnt that 40 Eri B was both
intrinsically faint and hot. Slightly, later Adams (2) gave the spectrum
of Sirius B as A or early F and van Maanen (3) described the spectrum, of
van Maanen 2. These three stars were soon realised to be the prototype
members of a class of stars of very small radius and high temperature
which consequently became known as the white dwarfs. The small radius
and high temperature of these stars implied a high density. The mass
of Sirius B was known from its double star orbit with Sirius A and its
parallax and apparent magnitude were also known. Ad a m s ’ spectra implied
a temperature of 10,000°K. This temperature and the absolute magnitude
implied a radius of about 1 9 , 0 0 0 km and this, combined with the mass of between 0 . 7 5 and 0 . 9 5 solar masses, gives a mean density of about
6 0 ,0 0 0 gm/cm123 .
(1) Russell, H.N. Remark at Symposium on Novae and White Dwarfs, Paris,
1959* Quoted by E. Schatzman, "White Dwarfs", North Holland, 1958, P* 1» (2) Adams, W.S., P.A.S.P., 27, 236,
2
Eddington
(
4
)
seems to have teen the first to argue that, whilst this density was far greater than that found in other stars or onthe earth, the figures should he taken seriously. The work of Fermi and
Dirac on quantum statistics was still in the future and so Eddington could
not give the physical basis for the existence of these high densities.
From his knowledge of the general theory of relativity he could, however,
point out that the huge density of Sirius B should produce a measurable
gravitational red shift of the absorption lines in its spectrum owing to
the higher gravitational potential at the surface of the star than at the
surface of the earth. This gravitational red shift would be the residual
shift of the spectral lines remaining after allowing for the motion of
the :star along the line of sight. It would amount to + 20 km/sec,
expressed in velocity units. A velocity of this order was found by
Adams. However the observations are very difficult ones to make
because of the close proximity of Sirius A and B. Fortunately, when
Adams made his observations the stars were nearly at maximum separation
but scattered light from Sirius A still appeared on his spectra of Sirius
B. Whilst the observations of Sirius B will undoubtedly be performed
again in the near future, the work of Eddington and Adams persuaded
astronomers that stars with a mean density of 60,000 gm/cm3 existed in
the Universe and also gave to physicists a demonstration of the correctness
of Einstein’s General Theory of Relativity.
3
After this early and important work progress was fairly slow
on the observational side but rapid on the theoretical one. Kuiper (5)
gave the spectra of 38 stars in 1941. The major theoretical advance was
made by Chandrasekhar, following the suggestion of Fowler that the
pressure in white dwarf interiors was supplied by a degenerate electron
gas. Chandrasekhar derived a one-parameter series of white dwarf models
for any given composition. The masses and radii of these models were of
the right order of magnitude. He found that as the central density of
the models increased their masses also increased but their radii decreased.
As the central density tended to infinity the radius tended to zero whilst
the mass tended to 1.44 solar masses, this latter being calculated on the
assumption that hydrogen is absent in the degenerate region of the star.
This upper limit on the mass of a white dwarf has been much used in
discussions of the latter stages of stellar evolution and of the
enrichment of interstellar matter by material which has been "processed"
in the interiors of stars. The work of Chandrasekhar on white dwarf
interiors and the existence of even denser stars, the neutron stars, will
be discussed in a later chapter.
More recent observational material on the spectra of white
dwarfs has been obtained by Luyten (6), Lynds (7 ) and Greenstein (8)
(5) Kuiper, G.P., P.A.S.P. 53, 248, 1941.
(6) Luyten, W.J., Ap.
J. 116, 283, 1952.
(7) lynds, B.T., Ap. J. 125, 719, 1957.
(8) Greenstein, J.L., Handbuch der Physik Vol L, Springer, 1958, p. l6l.
4
whilst Harris (
9
) has published. U, B, V colours and magnitudes for somestars. Luyten observed 44 stars with either the 82" or 100" telescopes
at dispersions ranging between I
65
and 340 A/mm and classified his spectrainto a number of groups. The handicaps which he faced in this project,
which he himself pointed out, were that he had to use four different spectrographs, all of low dispersion, and that the faintness of the stars
resulted in many spectra being underexposed. Luyten introduced the
notation of DA for stars shewing mainly hydrogen lines, DB for those with only helium lines, DC for a continuous spectrum and DF for the star van
Maanen 2. He also subdivided the DA stars into subclasses 0 - 7* the
lower numbers indicating broad and shallow lines and an intensity maximum in the violet, higher numbers sharper lines and an intensity maximum
shifted towards the red. Luyten pointed out that stars that he classified
as DC were distributed over quite a large temperature range. From his
magnitudes and intrinsic colours, together with trigonometric parallaxes and spectroscopic parallaxes of red dwarf companions of white dwarfs, Luyten was able to draw a plot of absolute magnitude versus colour index
for about forty white dwarfs. A rough conversion of his colour indices
into a temperature scale gave the radii of these stars. He found that
these radii lay mainly between those of the earth and Uranus.
Mrs. Iynds observed twenty-three white dwarfs with the nebular
spectrograph on the Crossley reflector of the Lick Observatory. The
5
dispersion of this instrument is V^O A/mm at H7. Seventeen of her
stars were of the DA type. Photoelectric colours on the U, B, V system were available for nineteen stars. Her data suggested a rough
correlation between the equivalent width of H7 and B-V colour. Her main interest, however, lay in comparing her observed line profiles with those calculated by Verweij. To do this she estimated the effective temperatures of the white dwarfs from their U, B, V colours and compared the half-widths of H7 and H6 as computed by Verweij for various values of log g and various effective temperatures with her observed values. Her results for H7 shewed that log g had an average value of about 7*0. Those for HÖ seemed to be better fitted by a lower value of log g and she pointed out that this was probably caused by the wings of H5 and H7 overlapping and thereby giving a false continuum. Verweij’s calculations of line profiles were based on the Holtsmark theory of line broadening. How Mrs. lynds' mean value of log g would alter if improved theories of Stark broadening were used to compute the line profiles is unknown.
Harris observed U, B, V colours for l8 white dwarfs of known trigonometric parallax and for six white dwarfs in the Hyades. From these data he could derive a more accurate colour-magnitude diagram than that of Luyten. His work and that of Johnson and Morgan shewed that white dwarfs had an ultraviolet excess. This, however, had been fore
6
stronger than that from a normal star of the same temperature.
The most extensive data on the spectra of white dwarfs are those of Greenstein (1958) and (lO) obtained using the 200-inch telescope.
Table 1 of his article in the Handbuch der Physik gives data on
8
l stars,some of which are taken from the papers of Luyten, Lynds and Kuiper. However about half the stars have been observed by Greenstein, using
dispersions of up to l
8
A/mm. U, B, V magnitudes are available for manyof these stars. Greenstein has extended the earlier classification
scheme of Luyten and as his material is more extensive and of higher quality we shall describe it in some detail.
The stars which shew only helium lines in their spectra, the
DB stars, are amongst the bluer and hotter objects. However some stars
which shew only hydrogen lines are nearly as blue and therefore nearly as hot as the DB stars, which consequently must be abnormally rich in helium.
The majority of white dwarfs are those with only hydrogen lines
in their spectra and are classified as DA. The equivalent width of Hy
can reach almost 40 A and the continuum is badly affected below H&. Neither helium lines in the hotter stars nor metal lines in the cooler
ones can be seen. A few DA stars have weak and shallow lines and are
amongst the hotter members of the class whilst a few with weak and sharp
lines are cooler members. A plot of W(Hy) versus U-V colour shews a
(10) Greenstein, J.L., Stellar Atmospheres, Vol
6
of Stars and Stellar7
maximum of about 4o A at U-V = -.45, decreasing rapidly to about 5 A at
U-V = -.20 and decreasing more slowly with decreasing U-V to about 10 A at
U-V = -1.3 0. A given colour does not correspond to a unique W(H7). This
may be caused either by abundance differences or different surface
gravities. Two objects shew hydrogen lines in emission. One of these
is a recurrent nova, WZ Sge, in which the emission lines are superposed
on the broad absorption lines of a white dwarf.
The cooler DA stars blend into the DF class. The hotter DF
stars have sharp hydrogen lines and a K line of varying strength. Later
members do not shew hydrogen lines. Ross 640 has only the H and K lines
and a blend due to Mg I in its spectrum and L745-46A has only H and K.
The DF stars are intrinsically fainter than the DA ones. Even later
type white dwarfs are hard to discover and to observe. Greenstein
classifies van Maanen 2 as DG and w489 as DK.
Some white dwarfs, over a wide range of temperature and luminosity, shew no lines or bands in their spectra and are classified
as DC. The use of spectrophotometric techniques, however, has enabled
Greenstein to observe spectral features in stars classified DC by earlier
observers. Intensity tracings of some of these stars have been
published (ll). The star Grw +70°8247 shews an asymmetric feature
centred at 4135A and weaker features at 365OA and 4475A. The atmospheric
composition required to produce this spectrum is not known at the present
8
time. It may be remarked that this star is a fairly hot one, Greenstein
giving an effective temperature of 11,500°K. Three other stars, W219,
LÖ79-14 and IlA5-l4l, two of which have been observed by Greenstein and
one by the author at Mt. Stromlo, shew a broad shallow feature centred at
4670A. More recent observations by Greenstein at Palomar shew another
broad feature centred at about 5100A. In a later chapter it will be
shewn that these features are caused by molecular carbon.
The problem of the energy sources of white dwarfs was solved
by Mestel(l2)These stars cannot produce energy by gravitational contraction
as their radius is uniquely fixed by their mass and chemical composition.
Nuclear reactions also seem to be an unlikely energy source as the pressure
inside the star is virtually independent of the temperature and there is
danger of nuclear processes, with their high temperature sensitivity,
running out of control and producing more energy than the star can
radiate. Mestel shewed that the kinetic energy of the non-degenerate
nuclei in the electron degenerate region of the star could supply a
white dwarf with energy to radiate for 1 0 9 years or longer. The kinetic
energy of each nucleus is proportional to the temperature and the total
kinetic energy of all the nuclei is thus proportional to the mass of the
star and the temperature. The majority of the mass of the star is
contained in the core, the region where the electrons are degenerate,
and the derivation of the temperature of this nearly isothermal region
9
is of extreme importance. Mestel derives this temperature by assuming
that the envelope of the star is in radiative equilibrium. This method
gives ages which are of the right order of magnitude. However it seems
that convection occurs fairly near to the surface even in white dwarfs
with effective temperatures of 12,500° or more. How this fact will
affect the current estimates of the internal temperatures of white
dwarfs is at present unknown as the models have not been carried through to the region where the temperature becomes approximately equal, to that in the core.
The aims of the present work are fourfold. In the next
chapter of this thesis some observations of the spectra and colours of
southern white dwarfs are given. The third chapter gives a series of
model atmospheres for DA white dwarfs. The main object of this chapter
is to find the values of Tg and g which best agree with a scan of ^0
Eridani B obtained by Oke. The fourth chapter shews that the A ^ 6 7 0
feature present in three white dwarf spectra is caused by molecular
carbon. The proper motions of these three stars indicate that they
may be dynamically related and this fact is also discussed. The final
10
CHAPTER 2
Observations of Southern White Dwarfs
Whilst many northern white dwarfs have been observed spectro*-scopically on several occasions, no such body of data exists for the
southern stars. Luyten and Smith (l) have published a large list of
photographic colours and magnitudes of suspected southern white dwarfs
and Luyten (2) has published finding charts for some of these stars.
The author decided to observe the brighter of these stars spectro scopically.
The spectrographic equipment available was the Zeiss spectrograph mounted at the Newtonian focus of the Mt. Stromlo
7^-inch reflector. This spectrograph is equipped with two sets of
prisms, of UBK 7 and F 2 glass, and with f/2.5 and f/l.5 camera
lenses. The dispersions available range from 90 A/mm at H7, using
the F2 prisms and f/2.5 lens, down to 290 A/mm at H7 using the UBK7
prisms and f/l.5 lens. The dispersion mainly employed by the author
was 150 A/mm at H7, using the F2 prisms and f/l.5 lens. This is
termed NB. 150 A/mm enabled the profiles of the hydrogen lines to
be measured with some accuracy and yet still enabled a reasonable number of spectra to be obtained with the spectrograph, which is
11
r a t h e r slow . The p l a t e s u s e d w ere b a k e d I I a - 0 an d th e s e w ere
d e v e lo p e d u s in g e i t h e r D-19 o r Kodak T r o p i c a l D e v e lo p e r i n s t a i n l e s s s t e e l ta n k s w ith i n t e r m i t t e n t a g i t a t i o n . The c a l i b r a t i o n p l a t e s u s e d w ere ex p o sed i n a tu b e s e n s i t o m e t e r , t h e e x p o s u re tim e s b e in g w i t h i n a f a c t o r two o f t h e s t e l l a r e x p o s u re tim e s . These p l a t e s w ere ta k e n from t h e same box o f b a k e d p l a t e s a s th o s e u s e d f o r th e
s t a r s . The s p e c t r a and c a l i b r a t i o n s p o ts w ere t r a c e d u s in g a
H ilg e r m ic ro p h o to m e te r and t h e t r a c i n g s o f t h e s p e c t r a w ere c o n v e r te d i n t o i n t e n s i t i e s u s in g t h e c a l i b r a t i o n c u r v e s d e r iv e d from th e
c a l i b r a t i o n p l a t e s .
The l i n e p r o f i l e s o f Hß, H/ and H5 a r e g iv e n i n T ab le 1 f o r f i v e s o u th e r n w h ite d w a r f s . One o f t h e s e s t a r s , L 532-81, h as a l s o b e e n o b s e rv e d by G r e e n s te in (3 ) and h i s o b s e r v a ti o n s a r e a l s o g iv e n i n t h i s t a b l e . The nam es, p o s i t i o n s and s p e c t r a l ty p e s o f t h e s e s t a r s a r e g iv e n b elo w .
Name a (1950) & S p e c t r a l ty p e
L532-81 o8h 3 9 % - 3 2 ° 4 8 ' DAs
L19-2 I k 2 5 .4 -
81
07
DAKL16-79 20 3 9 .6 - 68
16
DAL24-52
21
05.2
-82
01
DAL362-81
23
59.6
- ^323
DAsB oth L532-81 and L362-81 a r e s h a rp l i n e s t a r s w h i l s t th e o t h e r s t a r s have t h e more common b r o a d l i n e s .
O b served Hß p r o f i l e s
G r e e n s te in
L532-81
S t a r
I I 9 - 2
L362-81
1116-79
L24-52
L532-81
A-4861
- TO
.035
- 60
.031
.008
.112
.000
- 50
.065
.047
.157
.017
.011- 4o
.139
.020
.101
.215
,o4o
.025
- 30
.195
.053
.167
.283
.085
.055
- 20
.257
.110
.217
.331
.146
.119
- 10
.3 ^ 9
.213
,299
.391
.237
.226
0
.480
.405
, 4 l l
.504
.360
.48o
+ 10
.383
.250
.326
.439
.261
.292
+ 20
.325
.148
.442
.369
.183
.161
+ 30
.238
.034
.151
.300
.095
.093
+ 4o
.165
.000
.084
.233
.045
.045
+ 50
.122
.055
.185
.016
.014
+ 60
.072
.014
.120
.005
+ 70
.073
No. o f
p l a t e s
2
3
2
13
O b serv ed Hy
S t a r
A-4340
L19-2
L362-T
-
90
.01T
- 80
.043
- TO
.084
- 60
.112
- 50
.1T9
- 4o
.244
.032
- 30
.315
. 0t4- 20
.388
.135
- 10
.496
•2T9
0
• 6l4
.515
+ 10 •
439
.216
+ 20 • 34t
.100
+ 30
•2T9
.039
+
40
.231
.013
+
50
.192
+ 60
.142
+ TO
.126
+ 80
.068
+ 90
.043
N
2
3
W
40.0
13.8
P r o f i l e s
I116-T9
L24-52
L532-*
.015
.045
.023
.100
.040
.133
.0T2
.1T4
.010
.101
.244
.033
.148
.305
• 05T
.201
• 3TT
.109
.2T8
.431
.192
.3T6
.512
.245
.548
. 566
.501
• 433
.444
.224
.249
• 3T2
.136
.185
.292
.082
.150
.250
.056
.111
•1T9
.031
.082
.108
.006
• 05T
.096
.031
.056
.026
.010
2
1
3
30.0
47.0
16.4
G r e e n s te in
L532-81
.010.025
.048
.082
.135
.236
.551
.258
.139
.089
.055
.028
.011Observed H6 P r o f ile s
S ta r
119-2
L362-81
1116-79
L532-81
G reen stein
L532-81
A -4101
- 60
.006
.066
- 50
.046
.070
.000
.015
- 4o
.092
.000
.1 1 1.018
.032
- 30
.162
.022
.087
.052
.059
- 20
.227
.115
.276
.119
.112
- 10
.331
.245
.412
.2
k r ;
.225
0
.446
.623
.544
.501
.527
+ 10
.33b
.192
.351
.241
.235
+ 20
.247
.128
.249
.125
.128
+ 30
.166
.032
.170
.072
.077
+ 4o
.103
.025
.121
.027
.044
+ 50
.024
.076
.004
.018
+ 6o
.018
.055
N
2
2
2
3
12
Two other stars have been observed which do not shew
hydrogen lines. These are L7^5-^6a (cü(1950)= 7^38?0, 6(1950)=
-l?0! ? ’) and Ll45-l^l («(1 9 5 0)=
llhk2^9,
6(l9 5 0)=-6k°3k').
Greenstein (1 9 5 8) has previously classified L7^-5-^-6a as DF. This cannot be confirmed from my spectra, which are underexposed in the
region of H and K. An analysis of the tracings of L1^5-l4l shewed
that the 7^670 band, previously found by Greenstein (1 9 5 8) in the spectra of W219 and L8 7 9-lA> was possibly present in the spectrum
of this star. To check this an impartial technique, similar to
that used by Greenstein (4) was used. The plates of Ll45-l4l and
L7^+5-^6a were traced at 1 mm/min in the microphotometer and the
tracings were marked when the scanning slit passed opposite particular
iron lines. This enabled a wavelength scale to be impressed on
the tracings. The unsmoothed tracings were converted to intensities
at 5 A intervals and the intensities were added for the different
plates of each star. Before this addition, however, the intensities
of the separate plates of each star were normalized so that each
plate would carry equal weight in the analysis. The observed
intensities in the spectra of 11^5-1^1 (based on three NB plates) and L7^5-^-6A (based on two NB plates) are given in the accompanying
figure. The continuum has been drawn on these intensity curves
for each star and there is seen to be a broad band centred at about
13
4670A in the spectrum of 1245-l4l. In order to check that the
continuum of Ll45-l4l has been drawn correctly, we have taken the
continuum of L745-46A and after multiplying by the appropriate
factor to agree with the continuum of Il45-l4l at 4680A and
rotating it, to correct for different stellar temperatures and
extinctions, we have plotted it on that of Ll45-l4l. The agreement
between the two continua is seen to be good and the feature
definitely appears to be present.
Spectra of some other stars have shewn that they are not
white dwarfs. U 6O-IO8 (a(l950)= 19h4 4 % , 5(1950)= -63°07’) shews
a strong K line and many sharp hydrogen lines, without the wings
visible of L532-81 and would seem to be a dwarf or subdwarf F star,
the proper motion of 0"44 and m.pV of 10.27 making the latter more
probable. Similarly both L247-17 (a(l950)= 10ho A , b(l950) =
-50°55t) and Bruce Proper Motion star No. 9896 (cü(1950)= 5(1950)= -71°051) also seem to be F type subdwarfs.
Photoelectric photometry of some southern white dwarfs
was carried out using the 30-inch telescope of Mt. Stromlo Observatory.
The photometric equipment of this telescope has been described by
Gascoigne (5). The photometer, a Lick Observatory, 1952, f/l8
type with a 1P21 photomultiplier, refrigerated with dry ice, is
mounted at the Cassegrain focus of the telescope. The associated
A I I KI -q I Ki I
O
B
S
E
R
V
E
D
P
O
I
N
T
S ta r
V
B-V
U-B
H 4 5 - l4 l
11.44
+ .18
-.6 4
L327-186
13.77
+. 06
-.6 6
1111-44
12.06
+ .34
-.1 4
L342-53
13.37
+ .63
-.2 9
1116-79
13.25
- .06
-.8 1
L24-52
13.50
+ .27
-.5 9
L362-81
13.05
+ .07
00 —
3
amplifier has coarse and fine sensitivity ranges, the attenuation
steps being 2.5 and 0.5 magnitudes, respectively. The amplifier
output is fed to a Brown recorder. To give greater accuracy for
observations of the fainter stars the zero of the Brown recorder was run off scale and the amplifier sensitivity adjusted until both the sky and star plus sky were on scale, the difference between
them being as large as possible. A measurement of star plus sky
in one colour was followed by a measurement of sky alone in the
same colour, each observation taking about two minutes. The
extinction was measured each night by observing a red and a blue
star over a range of zenith distances. The deflections on the
tracings were converted into magnitudes and corrected for extinction, using the observations of the extinction stars and a nomogram giving
sec z as a function of declination and hour angle at Mt. Stromlo. This gave magnitudes on the instrumental system which were converted to the U, B, V system by observations of Johnson-Morgan standard
stars (6) and IC4665 (I)» The filters employed in the 30-inch
photometer are the Schott ones recommended by Johnson (8) but the transformation equations used were derived mainly for main sequence
stars and may possibly not be applicable for white dwarfs. U, B, V
colours for the stars observed are given in the table opposite.
(6) Johnson, H.L., and W.W. Morgan, Ap. J. 1 17> 313? 1953* (7) Johnson, H.L., Ap. J. 119, l8l, 195^ •
15
Deeming’s Observations of Ll45-l4l give V = 11.47,
B-V = +0.21, U-B = - . 5 8 so the agreement is good. His spectra of this star also do not exclude the presence of weak features less than 10$ deep. We have found the maximum depth of the >4670 hand to be about 8$. The temperatures of Ll45-l4l and l879-14, derived from the U, B, V colours of these stars, and using the work of Bonsack et al. (lO), are 9200°K and 9700°K. However in Chapter 4 we have assumed LÖ79-14 to have a temperature of 7500°K as our U, B, V colours were obtained on only a single night of poor quality. Greenstein (ll) moreover, has described the star as yellowish. All three >4670 white dwarfs lie above the black body curve of Bonsack et al. whereas the DA stars cluster on or below this line.
(9)
Deeming, T.J., The Observatory80,
2 2 4, i960.
(10) Bonsack, W.K., J.L. Greenstein, J.S. Mathis, W. G. Melbourne, G. Neugebauer, R.L. Newburn, K.H. Olsen, W.G. Tifft, H.D. Wahlquist and G. Wallerstein, Ap. J. 125, 139* 1957*
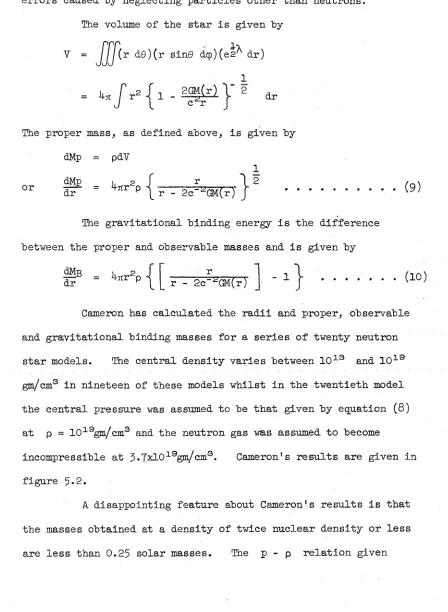
16
CHAPTER 3
Model Atmospheres for White Dwarfs
In his work on white dwarfs Greenstein (1958) derived rough
values of the effective temperatures of white dwarfs from their photo
electric colours and from the depths of the hydrogen lines. The
method used to derive temperatures from the colours followed that of
Bonsack et al. (l). This method characterizes a stellar model by T^
and P^ (effective temperature and effective mean electron pressure) and
assumes that k-^/k, the ratio of the opacity at a particular wavelength
to the Rosseland mean opacity, is independent of optical depth. The
ratio of the emergent flux to the Planck function at a particular wave
length can then be obtained from the tables of Burkhardt (2) and
Chandrasekhar (3). The U-B and B-V colour indices of a star are
expressed in terms of the fluxes at appropriate wavelengths. Greenstein,
using this technique, corrects the observed U-B and B-V of DA white
dwarfs for the effect of the hydrogen lines. He assumes that atomic
hydrogen alone gives rise to the opacity and further assumes that
(1) Bonsack, W.K., J.L. Greenstein, J.S. Mathis, W.G. Melbourne, G.
Neugebauer, R.L. Newburn, K.H. Olsen, W.G. Tifft, H.D. Wahlquist
and G. Wallerstein, Ap. J. 123, 139> 1957*
(2) Burkhardt, G., Zs. f. Ap. 13, 56, 1936.
IT
computations of U. The temperatures so derived, combined with an
approximation for the depths of the lines, gave line profiles whose
central depths were shallower than the observed values.
The white dwarf 40 Eri B provides a good check on estimates
of white dwarf temperatures. The observed value of the Einstein red
shift is
21
± 4 km/sec (4) and, using the mass radius relation and theexpression for the Einstein red shift (Greenstein 195Ö) > this corresponds
to a value of log r/p^ of - I
.85
± .03. The dynamical value of the mass (5
) is 0.43 ± . 04 M which, from the mass radius relation, leadsto a radius given by log R/Rq = - I
.83
± .02. Thus we may take log r/rto lie between the limits
The parallax of 40 Eri B is 0"200 ±.004 (6) and V = 9*50 (
7
) whenceWe find that 10,500°< Tg < 11,700°K
and
7*69
< log g < 7.83.(4) Popper, D.M., Ap. J. 120, 316, 1954.
(5) Artukhina, N.M., Astronom. J. U.S.S.R., 25, l80, 1948.
(6) Schlesinger, F., and L.F. Jenkins, Yale Catalogue of Stellar
Parallaxe s, 1952.
(7) Harris, D.L., Ap. J. 124,
665
, 1956. - 1.8l > log r/rq > - 1.88.l8
The derived temperatures give a bolometric correction of only a few hundredths of a magnitude which we neglect.
The temperature limits given above are lower than those derived by Greenstein, who obtained 15^T50°K on the assumption that the Balmer
discontinuity was that obtained from atomic hydrogen as the opacity source and 13,250°K on the assumption that the Balmer discontinuity was reduced by half by the action of some opacity source other than atomic hydrogen.
During the author’s visit to the California Institute of
Technology a spectral scan of
kO
Eri B was made available to him by Dr.J.B. Oke. This star has also been observed spectroscopically by
Greenstein at a dispersion of l8 A/mm. The existence of this high
quality observational material made it worthwhile to carry out an analysis of both the continuous and line spectra based on a series of model
atmospheres. An earlier analysis of the continuous spectrum of
ko
Eri Bby Schatzman (8), based on observations of Chalonge et al. (9), gave an
effective temperature ofl3^250°K or more. The author therefore decided
to construct 6 model atmospheres for 40 Eri B with effective temperatures of 12,000°K, 13>250°K and 15_,000°K and surface gravities of 1 0 7 and 1 0 s.
(8)
Schatzman,E.,
"White Dwarfs", North Holland,1958, pp. 31-35»
(9)
Berger, J., D. Chalonge, L. Divan, A.M. Fringant, Contributions de19
The opacity tables used, to construct these models were those of Ueno (lO)
and Ueno, Saito and Jugaku (ll). These are based on a H/He ratio of
8^:15 hy number with a hydrogen to metals ratio of 1 0 4 by number. As the
abundance ratios of H, He and metals are unknown for 40 Eri B U e n o 's
abundances, which are based on Unsold's (12) analysis of t Scorpii, will
serve as a first approximation. The models were constructed using an IBM
650 and a programme written by the author with the help of Mr. J. Grenot.
The temperature T at an optical depth t was assumed to be given by
T4 = To 4( 1 + § t ) ...(1)
where T , the boundary temperature, is related to the effective temperature T^ by
2 T 4 = T 4
o e
The variation of the gas pressure with optical depth is computed from
d Pg = g
d T K
(2)
U e n o 's table of log k is given as a table of log Pp versus 6. For
convenience this was changed, using the table of log in terms of log P^
and 0, into a table of log ~k in terms of log P and 0. This opacity
g
table was fed into the 650. The machine was supplied with the
appropriate values of 0 and log g and starting values of log P and d P
o g g
(10) Ueno, S., Contrib. of the Inst, of Astrophysics, Univ. of Kyoto, No. 42, 1954.
(11) Ueno, S., S. Saito and J. Jugaku, Contrib. of the Inst, of Astrophysics, Univ. of Kyoto, No. 43, 1954.
[image:28.526.41.501.219.687.2]20
and an estimate of the first values of
dr.
It looked up the appropriatevalues of log
~
k and integrated eqn* (2) by Simpson’s rule. This gaveanother value of It. This process continued until two values of
dr
agreed to within a certain accuracy. This accuracy was programmed to he
a function of t. When the required agreement in dj had teen obtained the
machine printed out
r,
log P , log~
k, Q
and the radiative temperaturef
d log T"1
gradient " l og P Jred* va-*-ues obtained- are given in the
accompanying tables. The adiabatic temperature gradient
is also given in the tables. This gradient was obtained from Unsold’s
graph (13). It will be seen that ^ iog""p J"ad sma^--'-er than f d log T 1
1 d i o g p (rad ^or moc^e -*-s at quite small optical depths. Miss Hack (l4) computed the emergent fluxes from model atmospheres in which the transfer of heat in the convective zones was either purely by
radiation or purely by convection. Comparing her results with the
observational data of Barbier, Chalonge and Divan (15, 16), she concluded that only for supergiants are the effects of convection non-negligible. We have consequently taken our models to be in radiative equilibrium
throughout. The computation of the continuous spectra and line profiles
(l3) Unsold, A., "Physik der SternatmoSphären", 2 Aufl. Springer 1955 P* 231. (1*0 Hack, M., B.A.N. XIII, 1, 1956.
21
of these model atmospheres was carried out using the IBM 610 Computer at
Mt. Stromlo. The ratio of the continuous absorption coefficient to the
Rosseland mean, was evaluated at wavelengths of 3272, 3535* ^-000,
^3^0 and 5250 A. The optical depths in the continuum, It^, was
evaluated from
d-r.. = dT
A K
The emergent flux of radiation, F(a), at wavelength A is given by
p 00
F(A) ■ % SA
b A)
e2(
ta)
... (3)
where S (t>) is the source function and E 9(t. ) is the second exponential
A A ^ A
integral. In all the models considered here the scattering coefficient,
a, is much smaller than k and so we may replace the source function by
A
the Planck function B.(t, )• Eqn (3) then becomes
A A
p OO
F(A) - 2J 0 BA (ta ) E 2 (xA ) ... (4)
This integral was evaluated using the Reiz two term formula (17).
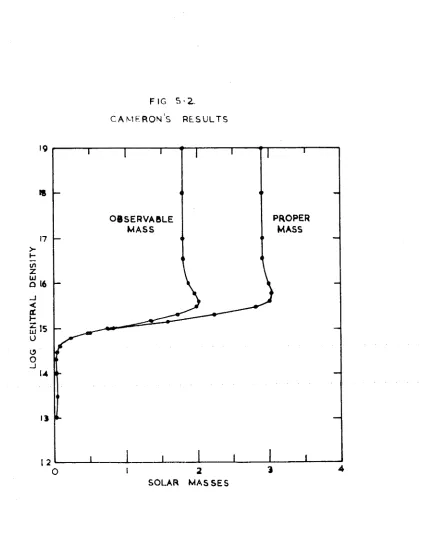
The results obtained for the 6 models are given in Table 3*1* This table shews that the slope of the continuum to the redward side of
the Balmer limit depends only very slightly on 6 Q and g whereas the
Bal-mer discontinuity depends critically on 0 n and is almost independent of
g. The model which gives the best agreement with the observed spectral
energy distribution of 40 Eri B is model B. The computed energy
distribution is compared with the observed one in the accompanying graph.
22
This model gives fairly good agreement with the observed Balmer
discontinuity but the slope of the continuum between 525OA and b j k O A
seems to be too small. This could be remedied by saying that the
star is hotter than any of our models but this would ruin the good agreement between the observed and computed Balmer discontinuities. It would also disagree with the estimates of the temperature of the star made from the mass and radial velocity data, which suggest that model B itself may be too hot.
Liller (l8) has suggested that 40 Eri B may have a high helium content and Liller and Tull (19) have constructed a series of
as yet unpublished model atmospheres for this star with Tq = 11,000,
15,000, 20,000, 25,000, 30,000 and 35,000°K, H/He abundance ratios of
0, 0.10, 0.25 and 0.40 and log g = 8. Whilst it will be of great
interest to see the continuous spectra computed from the models with T = 11,000 °K, the absence of He I lines in the bluer DA stars would
seem, in general, to argue against a high helium abundance. Another
possibility is that the H/metals ratio may be much smaller than that
assumed in the construction of our models. The desired effect is an
increase in the electron pressure relative to the gas pressure. This
will increase the opacity of H relative to that of atomic hydrogen and
(18) Private communication.
(19) Report of the Observatories of the University of Michigan, A.J.
23
thus will reduce the Balmer discontinuity of a star with given
temperature. Some other evidence of the existence of a higher
electron pressure than that given by our models may be gleaned from the line profiles.
The profile of Hy has been computed for the six models we
have calculated. Hy was chosen because the observational data for it
are probably better than for any other line as, unlike Hß, it lies in a region where the sensitivity of 103a-0 and IIa-0 plates is not rapidly changing and its redward wing is unlikely to overlap with the blueward wing of Hß.
The line absorption coefficient for a Stark-broahened hydrogen line may be written as (20)
a(AA) = { 1 + § (AA, Ne , T) }
O''
— & is the ratio of the electronic to the ionic contribution towards
on
the broadening of the line. It may be written as
(AA, Ne , T) = R (Ne , T) (AA)1/ 2
where R has been evaluated for Lyman-a, Lyman-ß, Ha, Hß, Hy and H5 by
Griem, Kolb and Shen (21). Ng is the electron density, AA the distance
from the line centre, Fq is the "normal field strength" and is given by
F = 2.61 e N 2/ 3 , and C is a constant for each line. The coefficient
o e 7
(20) Aller, L.H. and J. Jugaku, Ap. J. 1 30, 469, 1959*
24
of line absorption, k , is given by
k = N Cc(aA) ( 1 - e"hv/kT )
V Oj2
where N is the number of hydrogen atoms in the second level per gram
°> 2
of stellar material and the factor (l - e ^-v/kT^ allows for the induced
emission. We compute the optical depth in the line from the relation
dr v = kVi +_
K
and in the continuum from
dTdr = jo. dT
K
The residual intensity in the line, r.., is given by
A
A
Jo B
v(
tv) E2(
tv) drv
r
ba
(
ta
}
e
2(
ta
)
dTx
where, as before, we have replaced the source function by the Planck
function. The line profiles obtained for the various models are given
in the accompanying graph, where A = 1 - r . A comparison of these
A
A
line profiles with that observed for
ko
Eri B shews that the lines aretoo shallow in the core and too deep in the wings. The agreement
between the observed profile for HZ 43 and the computed profile for
model
B
is much better. The fact that the calculated depth of thewings is greater than the observed value could be explained by the
assumption that the continuum has been wrongly placed when reducing
the observational material. This does not explain the poor agreement
in the line centre of 40 Eri B, however. The profile of the line
25
i s v i r t u a l l y c o n s ta n t a c r o s s a l i n e . The r a t i o o f k a t 4 A from t h e v
l i n e c e n t r e t o t h a t a t 25 A i s
k„ ( M = 2 5 ( 1 + 2R) Kv ( 2 5) ij.5 /2 (-]_ +
R d e c r e a s e s m o n o to n ic a lly w ith i n c r e a s i n g N a t c o n s ta n t te m p e r a t u r e . e
A d e c r e a s e i n R w i l l i n c r e a s e k ( 4 ) /k ( 2 5 ) . T h is w i l l c a u s e a
v v
r e l a t i v e i n c r e a s e i n t h e d e p th o f t h e l i n e a t 4A from t h e l i n e c e n t r e a s com pared t o t h a t a t 25A.
C le a r l y i t w ould h e o f g r e a t i n t e r e s t t o c a l c u l a t e t h e
c o n tin u o u s s p e c t r a and l i n e p r o f i l e s f o r a s e r i e s o f w h ite d w a rf m odels i n w hich t h e r e i s a much h ig h e r p r o p o r t i o n o f m e ta ls th a n we h av e u s e d . A s, d u r in g i t s e v o l u t i o n , a s t a r i s c o n t i n u a l l y c o n s t r u c t i n g m e ta ls o u t o f h y d ro g e n and h e liu m t h e c h a n c e s t h a t i t c o n t a i n s a h ig h e r m e t a l s / h y d ro g e n r a t i o th a n n o rm al i s q u i t e good. Ueno u s e d a h y d ro g e n /m e ta l s r a t i o o f 1 0 4 by num ber. The i o n i s a t i o n o f t h e m e ta ls was n o t c a l c u l a t e d f o r e a c h m e ta l i n d i v i d u a l l y b u t by c o n s id e r i n g a "mean" m e ta l o f
M odel B
.00089
.00263
.00563
.01034
.01746
.0 2 7 9 0 .
04282
.
06384
.
0 9 2 7 8.13254
.18568
.25554
.34818
.46633
.61439
•79521
1.02128
1 .3 0 0 2 41.62594
2.0183
2.4796
3 .0 3 0 00 O = .4 0 , l o g g = 7
0
l o g Pg l o g Pe lO g K jd l o g T ||d l o g p j r a d
Jd l o g t\
|d l o g p j a d
•3999
3.301
2.956
1.07
.00086
.3996
3.505
3.155
1.24
.00219
.3992
3.667
3.313
1.38
.00412
.3985
3 .8o4
3.445
1.49
.0072
.3974
3.926
3.556
1.58
.0096
.3959
4.039
3.659
1.66
.0181
.5938
4.144
3.758
1.73
.0266
.3909
4.243
3.852
I.8 0
.0377
.3872
4.338
3.946
1.86
.0516
.3823
4.431
4.040
1.91
.0691
.3762
4.520
4.129
1.96
.0874
.3688
4.608
4.220
2.00
.110
.3601
4.695
4.315
2.04
.134
.14
.3503
4.780
4.4o6
2.06
.152
.14
.3397
4.864
4.497
2.08
.171
.14
.3287
4.947
4.582
2.08
.183
.15
.3171
5.029
4.671
2.10
.197
.15
.3052
5.111
4.758
2.09
.200
.17
.2937
5.192
4.845
2.09
.208
.17
.2824
5.273
4.931
2.09
.215
.18
.2714
5.354
5.018
2.07
.210
.19
Model C
0 n = .4 5 , lo g g = 7
T 0 lo g Pg
.00145 .4498 3 .3 0 1
.004o4 .4493 3 .5 0 5
.00796 .4487 3 .6 6 6
.01382 .4477 3 . 8o4
.02222 .4463 3 .9 2 6
.03384 .4445 4 .0 3 9
.04951 .4420 4 .1 4 4
.07052 .4388 4 .2 4 3
.09878 .4347 4 .3 3 8
.1 3 7 3 8 .4294 4 .4 3 1
.19035 .4226 4 .5 2 0
.26328 . 4 l 4 l 4 .6 0 8
.36328 .4036 4 .6 9 5
.50104 .3912 4 .7 8 0
.68611 .3771 4 .8 3 4
.92506 .3620 4 .9 4 7
1 .2 2 5 9 1 .3467 5 .0 2 9
1 .5 9 6 0 3 .3316 5 .1 1 1
2 .0 3 9 5 7 .3 17 0 5 .1 9 2
2 .5 6 2 7 3 .3033 5 .2 7 3
3 .1 7 7 7 8 .2904 5 .3 5 4
lo g Pe lOg K fd l o g T| \ d lofe P j z
2 .9 1 4 1 .2 6 .00135
3 .0 9 1 1 .3 9 .0 0 2 9
3 .2 2 9 1 .4 8 .0 05 2
3 .3 4 6 1 .5 7 .OO87
3 .4 4 7 1 .6 4 .0134
3 .5 4 1 1 .6 9 .0192
3 .6 2 9 1 .7 4 .0267
3 .7 1 6 1 .7 9 .03 6 6
3 . 8o4 1 .8 4 .0493
3 .8 9 4 I . 9 0 .0665
3 .9 8 8 1 .9 6 .0 8 7 9
4 .0 9 0 2 .0 2 .11 4
4 .2 0 0 2 .0 8 .144
4 .3 1 0 2 .1 3 .1 74
4 .4 1 9 2 .1 8 .2 04
4 .5 2 9 2 .2 1 .225
4 .6 3 2 2 .2 3 .2 3 9
4 .7 3 1 2 .2 3 .2 4 2
4 .8 2 5 2 .2 2 .2 3 8
4 .9 1 5 2 .2 1 .2 36
5 .0 0 9
fd lo g T~) )d lo g p | ad
.00135 .00337 .00619 .00998
.01494
.02133 .02958 . 04027 .05426 .07277 .09749 ..1 3 1 2 2 .18038 .25911 .37400 .53221 .76928 1 .1 5 8 7 3 1 .7 2 1 0 42.45491
3 .3 2 9 1 0 4 .2 4 2 9 9
5
. 4o488
Model D 0o = .5 0 , lo g g = 7
9 lo g Pg lo g Pe lO g K fd lo g T|
ld l0 g PJ r a d
fd lo g t\
ld lo g P Jad
.4997 3 .3 0 1 2 .7 7 2 1 .1 9 .0012
.4994 3 .5 0 5 2 .9 1 6 1 .7 6 .0022
.4 9 8 8 3 .6 6 7 3 .0 3 2 1 .3 2 .0 03 6
.4981 3 . 8o4 3 .1 3 2 1 .3 6 .0054
.4972 3 .9 2 6 3 .2 1 1 1 .3 9 .00 7 6
.4961 4 .0 3 8 3 .2 8 5 1 .4 2 .0105
.4946 4 .1 4 4 3 .3 5 8 1 .4 6 .0143
.49 27 4 .2 4 3 3 .4 3 0 1 .4 9 .0191
.49 03 4 .3 3 8 3 .5 0 4 1 .5 3 .02 5 7
.4 87 2 4 .4 3 1 3 .5 8 1 1 .5 7 .0 3 40
.4832 4 .5 2 0 3 .6 6 1 1 .6 2 .0452
. 4780 4 .6 0 8 3 .7 4 7 1 .6 8 .0610
.4710 4 .6 9 5 3 .8 4 3 1 .7 8 .08 7 9 .10
.4 60 6 4 .7 7 9 3 .9 6 4 1 .9 2 .135 .11
.4 1 + 7 3 4 .8 6 4 4 .0 9 3 1 .9 7 .1 6 4 .11
.4 3 1 8 4 .9 4 7 4 .2 3 6 2 .0 4 .203 .11
.4 12 7 5 .0 2 9 4 .3 9 5 2 .1 5 .263 .1 0
.3 8 8 7 5 .1 1 1 4 .5 6 6 2 .2 8 .3 3 7 .1 1
.3 6 3 5 5 .1 9 2 4 .7 3 0 2 .3 5 . 366 .1 3
.3 3 9 9 5 .2 7 3 4 .8 6 3 2 .3 8 .3 6 0 .14
.3 1 9 6 5 .3 5 4 4 .9 7 7 2 .3 7 .3 3 4 .1 6
.3035 5 .4 3 5 5 .0 6 9 2 .3 5 .3 1 0 .1 5
M odel E 0 O =
-hO,
l o g g =T 0 lQ g Pg
lo g Pe
.0 0 009 .
4
ooo3 .3 0 1
2 .9 5 6.00026 ,
4
ooo3.5 0 5
5 .1 5 5.00057
.39 9 93 .6 6 7
5 .3 1 5 . o o io4
.3 9 9 83
.8
o4
3 .4 4 4.00177 .3 99 7
3 .9 2 6
3 .5 5 4.00285 .3996
4 .0 3 9
3 .6 5 5. oo
44
i .39934 .1 4 4
3 .7 5 0.00663 .3990
4 .2 4 3
3 .8 3 8.00973 .3986
4 .3 3 8
3 .9 2 0.01399
.39 7 94 .4 3 1
4.001
.01975 .3971
4 .5 2 0
4 .0 8 0
.0 2748 .3 9 6 0 4 .6 0 8
4 .1 5 7
.03780 .3945 4 .6 9 5
4.231
.0 5 1 5 8 .3926 4 .7 8 0
4.305
.06987 .3 90 2
4 .8 6 4
4.3 7 7
.0 9 3 8 8 .3 8 7 0 4 .9 4 7
4.451
.12 570 .38 31
5.0 2 9
4 .5 2 9
.16811 .3 78 1
5.111
4 .6 1 0
.22409
.3 7 2 15.192
4 .6 9 6.29 879 .
3646
5.273
4 .7 8 9.39 888 •
3557
5.354
4 .8 8 6
. 53078
.3455
5.435
4 .9 8 2.70 598 •
3339
5.515
5 .0 8 3.93070 .3215
5.595
5 .1 8 21 .2 1 0 4 5 .3 0 8 8
5.675
5 .2 7 81 .5 5 3 3 0 .2961
5.755
5.375
1 .9 6 4 8 7 .2 8 3 7
5.834
5.466
lOg
Kfd lo g
t|
fd lo g
t)
ld log PJrad
ld log pJad
l . o 6 .00009
1 .2 4
.000211 .3 8
.00042
1 .1 9
.00074
1159
.00123
1 .6 8
.00195
1 .7 6 .00298
1 .8 2
.00432
1 .8 9 .00625
1 .9 4
.00862I . 9 9
.01182 .0 4
.01602 .0 9 .0216
2 .1 3
.0283
2 .1 7 .0567
2 .2 1
.0472
2 .2 6
.0613
2 .3 0
.0772
2 .3 4
.0958
.122 .3 9
.119
.1 32 .4 4
.146
.132 .4 8
.171
.1 32 .5 2
.197
.14
2 .5 5
.2 1 8.14
2 .5 6 .229 .15
2 .5 7
.238 .15M odel F
d o = l o § g = 8
T
e
l o g Pg l o g Pe lO g K jd l o g T*\l d l o g p j r a d
fd lo g \ d l o g
.00015
.45
3.301
2.913
1 .2 6 . o o o i4
. ooo
4
o .44 993.505
3.090
1 .3 9
.0 0 0 2 9.00079
.4 49 9 3 .6 6 73.225
1148
.00 0 52.00138 .4 49 8
3
.8
o4
3.339
1 .5 7
.0 0 0 8 8.00220 .4496
3.926
3.434
1 .6 3 .00135.00333
.4494
4.039
3.5 2 0
1 .6 8 .0 0 19 6.00485 .4492
4.144
3 .5 9 81 .7 2
.00272.00684
.4489
4.243
3 .6 7 11 .7 7
.00 38 2.00947
.4484
4.3 3 8
3 .7 4 3 I . 8 0 .0 05 1 0.01291 .4 47 8
4.431
3 .8 1 11 .8 4
.00 68 6.01735
.4471
4.5 2 0
3 .8 7 3 1 .8 7 .008 9 7.02307
.4462
4 .6 0 83.935
1 .9 0
.0 1 1 7.
03
o4
o.4450
4 .6 9 53.9 9 9
1 .9 3
.0 15 1.03979
4 .7 8 04.065
1 .9 6 .0 1 9 4.05180
.4417
4.8 6 4
4 .1 2 8
1 .9 8 .0243.0 6 7 0 8 .4595 4 .9 4 7
4.192
2 .0 1 .0 3 0 8.08676 .^365 5 .0 2 9 4 .2 5 9
2 .0 4
.0 3 9 0.11217
.4328
5.111
4.3 3 0
2 .0 7
.0488
.14563 .4283
5.192
4.4 0 6
2 .1 2 .0631.19108
.42251
5.273
4.492
2 .1 8 .0 8 2 6.25436
.4151
5 .3 5 44.5 9 0
2 .2 4
.107
.1 1.34308
.4056 5 .4 3 5 4 .6 9 82 .3 1
.137
.1 1.46962 .3 9 3 8
5.515
4.8 2 0
2 .3 9
.177
.11•65557
.3792
5-595
4 .9 6 02 .4 8
.225
.12.92890 .3618 5 .675
5.103
2 .5 7
.275
.13
1.32184
.3424
5.755
5.2 4 52 .6 4
.3 1 2.13
1.86053
.3225
5 .8 3 4 5 .3 7 8 2 .7 0 .3 3 8.14
2 .5 5 7 6 9 •
3039
5 .9 1 45.496
2 .7 0 .321.15
M odel G 0 Q = .5 0, l o g g = 8
T e
l o g p g
lo g Pe
lOg
Kja. lo g
t]
lo g P j ra d
fd lo g
t]
| d
lo g PJad
.
00014
.5 0 0 03.301
2.7 7 0
1 .1 9
.00012
.00037
.4 9 9 93.505
2.9 1 4
1 .2 6.00022
.0 0 0 6 2 ,k9 9 9 3 .6 6 7
3.027
1 .3 1
.00036
.0 0 0 9 9
.4998
3 .8
o4
3.123
1 .3 5
.00053
.0 0 1 4 7
A 997
3 .9 2 63.1 9 7
1 .3 8
.00075
.0 0 2 0 8
.4996
4 .0 3 9
3 .2 6 5 l .4o.00102
.0 0 2 8 5
.**995
4.1 4 4
3 .3 2 9
1 .4 2
.00137
.0 0 3 8 2 .1*993
4.2 4 3
3.3 9 0
1 .4 4
.0 0 1 8 2.0 0 5 0 5
.1*991
4 .3 3 8
3.4 4 9
1 .4 7
.00237
.0 0 6 5 9
.4988
4.4 3 1
3 .5 0 61 .4 9
.00307
.0 0 8 5 3
.4984
4 .5 2 0
3 .5 6 31 .5 1
.00394
.0 1 0 9 7
.4980
4 .6 0 8
3 .6 1 71 .5 3
.00503
.01405
.4974
4 .6 9 53.665
1 .5 5
. 0064l
.0 1 7 9 3 .1*967 4 .7 8 0
3.713
1 .5 7
. 0 0 8 l4.0 2 2 8 3
.4958
4.8 6 4
3 .7 6 51 .5 9
.0103
.0 2 9 0 0
.4947
4 .9 4 7 3 .8 2 01 . 6 l
.0130
.03684
.1*933
5.029
3 .8 7 61 .6 4
.0 1 6 6.04687
.4916
5.111
3.931
1 .6 7.0210
. 0 5 9 7 6
.4894
5.192
3.990
1 .7 0
.0 2 6 8. 0 7 6 5 1
. 4866
5.273
4.0 5 4
1 .7 3
.0341
.0 9 8 3 9
.4831
5 . 3 5 1 *4.123
1 .7 7
.0436
.12754
.4 7 8 6 5.1*354 .1 9 8
1 .8 2.0572
. 1 6 9 7 7
.4724
5.515
4.2 8 6
1 .9 2
. o8o4.23535
.4 6 3 65-595
4 .3 9 8
2 .0 4
.1 1 8.13
.33511
.4 5 1 6 5 . 6 7 54 .5 3 0
2 .1 2
.154
.12
.4 7 0 3 1
.**375
5.755
4.6 7 2
2 .1 8 .1 8 8.13
.6 8 2 1 8
.4192
5 . 8 3 1 *4.8 4 4
2.3 1
.2 6 0.12
1 . 0 4 9 1 6 .
.3948
5 . 9 1 1 * 5 .0 5 82 .4 8
• 359
.13
1 . 7 1 3 6 3 . 3 6 3 7
5.993
5.303
2 .6 6
.472
.13
2.84091
.3301
6 . 0 7 35.532
2 .7 9
.524
.14
Calculated continuous spectra for white dwarf atmospheres
The units are magnitudes and the flux from each model has been
normalized to -O^OÖ at 5 2 5 0A.
Model 3272A
B - . 0 1
C + .17
D
+.4o
E - . 0 2
F +.17
G +.37
3535A 4o o o a
-.03 -.32
+ .13 -.31
+.3^ -.29
-.04 -.32
+.14 -.31
+.33 -.30
4340A 5250A
-.24 - . 0 6
-.24 - . 0 6
-.23 - . 0 6
-.25 - . 0 6
- . 2 2 - . 0 6
u. Q ü j ( j ld
<
y
I
p
v
e
r
-
<
in
CD
m
r^
in
>o
in
in
m
*
in
m
in
CN
m
« 0 D aJ ««
3 UJ
CL —1 3 N
UJ $ -J < o O Q > oo
a UJ o 3
UJ > UJ > -J CL a K- x
CL < o UJ 3
UJ a Li. iS) CL vn CL \ -(3 z CD O *
o £ o
LL UJ O Q
lli 3 ca nc. t- lO
'H 5 Q
5 ° < o
Q.
2 o O z o <
z < in I-z LÜ in lU a a LÜ a UJ Q 0 5 u 1 H 2 O ct U. <9 rg vO ■<* CM CM 1 ■»t
S B d r U I N O V N W V
26
CHAPTER 4 The A^-670 Stars
Greenstein (l, 2) has discussed the stars W219 and
LÖ79-14 as -well as some other white dwarfs. My own observations
(Chapter 2) have shewn that the star Ll45-l4l is similar to W219
and L879-l^- in that the only feature visible in the blue region
of the spectrum is a broad, shallow band centred at ?\4670. Greenstein suggests that this may be a molecular feature, in particular C 2 "with structure blurred, altered and shifted by high pressure.", the temperature being too low to permit its identification with Hell 4686, blended with CIII, CIV and NIII
at 4630-4650A. In this chapter it is shewn that the feature is
caused by molecular carbon, the calculations being performed
without including pressure effects. The assumption is made that
the band is formed in a layer whose temperature is approximately
equal to the effective temperature of the star. The effective
temperature of W219 is 7500°K (Greenstein, (l)). That of L879-14
would seem to be about the same whereas Ll45-l4l seems rather
hotter. The calculations have been carried out for temperatures
of 7500° and 10000°K. The method used to carry out the calcul
ations is given in some detail below.