P
LATINUM GROUP ELEMENTS
:
INDICATORS OF
SULFIDE SATURATION IN INTERMEDIATE TO FELSIC
MAGMATIC SYSTEMS AND IMPLICATIONS FOR
PORPHYRY DEPOSIT FORMATION
Helen Amy Cocker
May 2016
A thesis submitted for the degree of Doctor of Philosophy of
The Australian National University
D
ECLARATIONThe work in this thesis is my own except where otherwise acknowledged.
Helen Amy Cocker
This thesis is dedicated to the memory of
Basil Wood Cocker
ACKNOWLEDGEMENTS
I would like to thank my supervisor, Ian Campbell, for his assistance, support and guidance throughout this research project, especially during the last couple of years while I have been living overseas. To Jung-Woo Park for teaching me all things PGE analysis, for your assistance with (LA)-ICP-MS, and for many helpful discussions. To the rest of my supervisory panel, Richard Arculus, John Mavrogenes, and Hugh O’Neill, for kind advice and valuable discussions. To Charlotte Allen for ICP-MS assistance and for with zircon dating advice. To Graham Mortimer for your help in the lab and Shane Paxton for assistance with rock sawing, crushing and milling, and zircon separations. To Joy McDermid, Maree Coldrick, Mary Hapel, Josephine Magro, and Mary Anne King for many kind discussions and assistance with administrative issues. I would also like to thank Clyde Leys and staff members from PT Freeport Indonesia for all your help with the Grasberg projects and acquiring samples. To Richard Price and Neville Hudson for sourcing and sending additional Taranaki samples and data. Finally, thanks to other academic, technical, administrative, and support staff at RSES for many different reasons, including providing many much-appreciated cups of tea and biscuits.
I am very thankful for the scholarships and awards and other financial sources that have helped fund this project and my Ph.D. studies; APA scholarship, Allan White Scholarship, D.A. Brown Travel Award, ANU Travel Grant, Society of Economic Geologists Hugh E. McKinstry Fund, International Platinum Symposium Student Travel Award, and further funding from Pt Freeport Indonesia. I would very much like to thank all the people who have donated to these grants. Your contributions are very much appreciated and significantly helped me through this Ph.D. research.
To my fellow RSES Ph.D. friends, flatmates, and ultimate frisbee teammates, thanks for helping me make many fun and happy memories of my time in Canberra and for bringing cake on Fridays.
ABSTRACT
Sulfide saturation during the magmatic evolution of porphyry systems is emerging as an important control on the fertility of magmas with respect to the chalcophile elements. Platinum group elements (PGE) have extreme sulfide melt-silicate melt partition coefficients that make them sensitive indicators of the timing of sulfide saturation in evolving magmatic systems. This study reports PGE and Re concentrations, measured using a NiS fire assay isotope dilution technique, of three igneous suites: 1) the El Abra porphyry Cu deposit, Chile; 2) the Grasberg-Ertsberg porphyry-skarn Cu-Au district, Papua, Indonesia: and 3) Mt. Taranaki, a young stratovolcano in New Zealand. The El Abra and Grasberg samples allow direct comparison between a Cu-only and a Cu-Au porphyry system, whereas, Mt. Taranaki samples were analysed to investigate sulfide saturation in an active magmatic system with no known associated porphyry deposit. The El Abra results show a rapid drop in Pt and Pd abundances, which is indicative of sulfide saturation, at ca. 2.5 wt. % MgO. However, at El Abra a porphyry Cu deposit was still able to form because the amount of sulfide melt that formed was small, stripping the magma of Au and PGE but not significant Cu. In contrast the Grasberg PGE results suggest that sulfide saturation did not occur during magmatic evolution of the intrusions, and so Cu, Au, and PGE were concentrated by fractional crystallisation and then partitioned into the mineralising fluid. Sulfide saturation has a first order influence on both the availability of the chalcophile elements to partition into the hydrothermal ore-fluid phase and the type of porphyry mineralisation that forms, i.e. Cu, Cu-Au, or Cu-Au-(Pd). The PGE concentrations of the Mt. Taranaki samples indicate that sulfide saturation occurred at ca. 4 wt. % MgO during the evolution of the Taranaki magmatic system. If sulfide saturation of the developing Taranaki magmas persists with each new magmatic episode then the oxidation state of the magmas, the amount of sulfide melt that forms, and the timing with respect to saturation of volatile phases will influence any future porphyry mineralisation.
TABLE OF CONTENTS
Title page ... Declaration ... Frontispiece ... Dedication... Acknowledgements ... Abstract... Table of contents ... List of figures ... List of tables ... List of appendices ...
i iii v vii ix xi xiii xvi xviii xix
CHAPTER 1. INTRODUCTION
1.1.Platinum Group Elements ... 1.1.1. PGE behaviour from mantle to crust ... 1.1.2. PGE behaviour from magmatic to hydrothermal fluids ... 1.2.Felsic arc rock suites ... 1.2.1. PGE and Re in felsic arc rocks and porphyry systems ... 1.2.2. Porphyry Cu (± Au) systems ... 1.2.3. Sulfide saturation during the magmatic evolution of
porphyry-associated systems ... 1.3.Study objectives ... 1.4.Study areas ... 1.4.1. El Abra, Chile ... 1.4.2. Grasberg, Indonesia ... 1.4.3. Taranaki, New Zealand ... 1.5.Thesis structure ...
1 1 3 4 4 5
6 7 7 8 9 10 12
CHAPTER 2. EL ABRA
Using platinum group elements to identify sulfide saturation in a porphyry Cu system: the El Abra porphyry Cu deposit, northern Chile.
Preface ... Abstract ... 2.1. Introduction ... 2.1.1. Porphyry systems ... 2.1.2. Sulfide saturation ... 2.2. Geological setting ... 2.3. Sample selection and analytical techniques ... 2.4. Results ... 2.4.1. Whole rock PGE and Re geochemistry ... 2.5. Discussion ... 2.5.1. Magmatic evolution ... 2.5.2. PGE-alloy and sulfide saturation ...
2.5.3. Relative oxidation state of the magmas ... 2.5.4. Sulfide saturation modelling ... 2.6. Conclusions ...
41 41 44
CHAPTER 3. GRASBERG – PETROLOGY AND GEOCHRONOLOGY U-Pb zircon geochronology of intrusions of the Grasberg-Ertsberg porphyry Cu-Au skarn region, Papua, Indonesia.
Preface ... Abstract ... 3.1. Introduction ... 3.2. Geological setting ... 3.3. Petrography ... 3.4. Sample selection and analytical techniques ... 3.5. Results ... 3.6. Discussion ... 3.7. Conclusions ...
45 45 45 46 51 55 56 65 68
CHAPTER 4. GRASBERG – GEOCHEMISTRY
Platinum group element geochemistry of intrusions of the
Grasberg-Ertsberg porphyry-skarn Cu-Au district, Papua, Indonesia: implications of late sulfide saturation in evolving porphyry systems.
Preface ... Abstract ... 4.1. Introduction ... 4.2. Geological setting ... 4.3. Sample selection and analytical techniques ... 4.4. Results ... 4.4.1. Assessing the effects of alteration... 4.4.2. Major element geochemistry ... 4.4.3. Trace element geochemistry ... 4.4.4. Whole rock PGE and Re geochemistry ... 4.4.5. Ce4+/Ce3+ zircon ratios ... 4.5. Discussion ... 4.5.1. Magmatic evolution ... 4.5.2. Geochemical effects of alteration ... 4.5.3. Whole rock PGE and Re geochemistry ... 4.5.4. Relative oxidation state of magmatic systems ... 4.5.5. Sulfide saturation in porphyry Cu ± Au systems ... 4.6. Conclusions ...
CHAPTER 5. TARANAKI
Using platinum group elements to identify sulfide saturation during the magmatic evolution of Mt. Taranaki, a stratovolcano in New Zealand.
Preface ... Abstract ... 5.1. Introduction ... 5.2. Geological setting ... 5.3. Sample selection and analytical techniques ... 5.4. Petrography ... 5.5. Results ...
5.5.1. Whole rock major element geochemistry ... 5.5.2. Whole rock trace element geochemistry ... 5.5.3. Whole rock PGE and Re analysis ... 5.6. Discussion... 5.6.1. Magmatic evolution of the suite ... 5.6.2. Sulfide saturation during magmatic evolution of Taranaki lavas ... 5.6.3. Sulfide blebs ... 5.6.4. The hydrothermal mineralisation potential of Taranaki ... 5.7. Conclusions...
99 99 100 101 104 105 111 111 111 115 122 122 123 127 127 130
CHAPTER 6. SUMMARY AND CONCLUSIONS
6.1. Summary of case studies ... 6.2. Sulfide saturation in magmatic systems associated with porphyry
deposits ... 6.3. Concluding statement ... 6.4. Future work ...
131
132 134 134
REFERENCES ... 135
The Journey of Mount Taranaki ... 154
APPENDICES ... A: PGE analysis ... B: Appendices to chapter 2: El Abra ... Manuscript published in Journal of Petrology ... C: Appendices to chapter 3: Grasberg – petrology and geochronology ... D: Appendices to chapter 4: Grasberg - geochemistry ... E: Appendices to chapter 5: Taranaki ... F: Hand sample photos and thin section scans of samples collected from
Grasberg-Ertsberg and Taranaki locations ... 156 157 159 169 193 239 289
LIST OF FIGURES
INTRODUCTION
1.1. Schematic diagram of a magmatic plumbing and porphyry system ... 1.2. Location map of El Abra porphyry Cu deposit ... 1.3. Location map of Grasberg porphyry Cu-Au deposit ... 1.4. Maps showing location of Mt. Taranaki ...
6 9 10 11
CHAPTER 2: EL ABRA
2.1. Map showing location of El Abra ... 2.2. Geological map of El Abra-Pajonal intrusions with sample locations... 2.3. 206Pb/238U zircon ages for the El Abra-Pajonal suite samples ... 2.4. Selected whole rock major element plots ... 2.5. Selected whole rock trace element plots ... 2.6. Rare earth element plots ... 2.7. Pt and Pd plotted against MgO ... 2.8. MgO, Sr/Y, Pd, and Ce+4/Ce+3 ratios plotted against age ... 2.9. Sulfide saturation modelling ...
16 20 23 24 25 26 32 33 43
CHAPTER 3: GRASBERG – PETROLOGY AND GEOCHRONOLOGY
3.1. Map showing location of the Grasberg deposit ... 3.2. Geology map of the Grasberg-Ertsberg district ... 3.3. Local geology map of the Grasberg Igneous Complex ... 3.4. Selected photomicrographs ... 3.5. Cathodoluminesence images of selected zircons ... 3.6. 207Pb/206Pb against 238U/206Pb concordia and cumulative probability graphs . 3.7. U-Pb ages of zircons combined from multiple samples for each intrusion .... 3.8. Comparison of age results with previous studies ...
48 49 50 52 58 60 65 68
CHAPTER 4: GRASBERG - GEOCHEMISTRY
4.1. Whole rock oxide and element ratio plots used to assess alteration in the Grasberg-Ertsberg samples ... 4.2. Whole rock major element data plotted against SiO2 for studied samples ...
4.3. Selected whole rock trace element plots for studied samples ... 4.4. Chondrite normalized REE patterns ... 4.5. Multi-element diagrams of Grasberg-Ertsberg samples ... 4.6. Whole rock PGE plots of Pt, Pd, Rh, and Re against MgO ... 4.7. Upper quartile-median-lower quartile plots showing Ce(IV)/Ce(III) ratios
in zircons ... 4.8. Pd and Pt plotted against MgO for various igneous suites ... 4.9. Pd/Pt plotted against MgO ... 4.10.Sulfide saturation modelling ...
77 78 79 80 81 87
CHAPTER 5: TARANAKI
5.1. Maps showing location and geology of Mt. Taranaki and surrounds ... 5.2. Hand sample photos and plane and reflected light photomicrographs ... 5.3. Total alkali silica and total FeO/MgO versus SiO2 plots ...
5.4. Major element plots against SiO2 ...
5.5. Selected trace element plots ... 5.6. Rare earth element and multi-element diagrams ... 5.7. PGE and Re plots ... 5.8. Pt, Pd, and Rh concentrations against MgO ... 5.9. Geochemical plots comparing Fantham’s Peak to other studies ... 5.10.Pt and Pd against MgO for various igneous suites ...
102 108 109 112 113 114 120 121 125 129
CHAPTER 6: SUMMARY AND CONCLUSIONS
6.1. Schematic diagram summarising effects of different amounts of sulfide
LIST OF TABLES
CHAPTER 2: EL ABRA
2.1. Whole rock PGE and Re results for El Abra-Pajonal samples ... 2.2. Procedural blanks PGE results ... 2.3. Reference material (TDB-1) PGE results ...
28 30 31
CHAPTER 3: GRASBERG – PETROLOGY AND GEOCHRONOLOGY
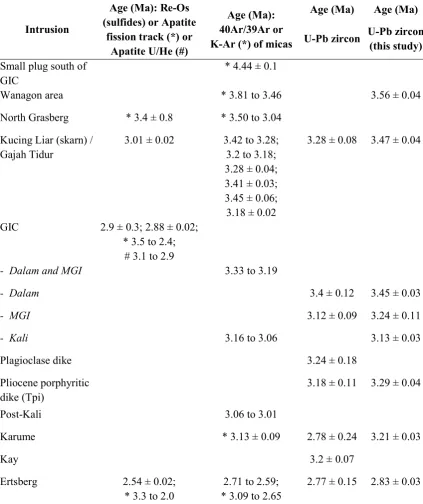
3.1. Weighted average ages for each sample ... 3.2. Ages of Grasberg-Ertsberg intrusions compared to previous studies ...
59 67
CHAPTER 4: GRASBERG - GEOCHEMISTRY
4.1. Whole rock PGE results of Grasberg-Ertsberg samples ... 4.2. PGE results for procedural blanks ... 4.3. Reference material (TDB-1) PGE results ...
83 85 86
CHAPTER 5: TARANAKI
5.1. List of samples collected with selected element concentrations ... 5.2. Whole rock PGE and Re results for Taranaki samples ... 5.3. Whole rock PGE and Re results for samples acquired from other studies ... 5.4. PGE results for procedural blanks ... 5.5. Reference material (TDB-1) PGE results ...
LIST OF APPENDICES
A. PGE ANALYSIS ... 157 B. APPENDICES TO CHAPTER 2: EL ABRA ...
Figure B1. Geology map of El Abra-Pajonal intrusions with sample locations .... Figure B2. Geology map of El Abra mine pit area with sample locations ... Figure B3. Partition coefficients for amphibole, clinopyroxene, and
plagioclase with andesite melt ... Figure B4. Pd vs. Pt and Pd vs. Cu for El Abra-Pajonal samples ... Table B1. U-Pb zircon ate results for El Abra-Pajonal samples ... Table B2. Whole rock major and trace element concentrations ... Manuscript published in Journal of Petrology ...
159 159 160
161 162 163 164 169
C. APPENDICES TO CHAPTER 3: GRASBERG – PETROLOGY AND
GEOCHRONOLOGY ... Table C1. Grasberg-Ertsberg sample locations ... Table C2. Brief sample descriptions ... Figure C1. Photomicrographs ... Figure C2. Photomicrographs ... Figure C3. Reflected light photomicrographs ... Figure C4. Photomicrographs in plane and reflected light ... Figure C5. Photomicrographs in plane light and with crossed polars ... Table C3. 206Pb/238U uncorrected, common Pb corrected, Th disequilibrium
corrected ratios for individual zircon analyses ... Table C4. Raw data table showing uncorrected and common Pb corrected
206Pb/238U, 238U/206Pb, and 207Pb/206Pb ratios ...
Table C5. Age results compared to previous studies ... 193 193 195 199 200 201 202 202
203
222 237
D. APPENDICES TO CHAPTER 4: GRASBERG - GEOCHEMISTRY ... Analytical methods ...
Whole rock major element analysis ... Whole rock trace element analysis ... Ce4+/Ce3+ratios in zircon ... Table D1. Whole rock major and trace element concentrations ... Table D2. Zircon trace element results ... Table D3. Zircon Ce ratio calculation data (part 1) ... Table D4. Zircon Ce ratio calculation data (part 2) ...
E. APPENDICES TO CHAPTER 5: TARANAKI ... Table E1. Simplified summary of the volcanic and related stratigraphy of
Taranaki ... Table E2. Sample locations for samples collected in this study ... Figure E1. Locations of samples collected during fieldwork for this study ... Figure E2. Photographs of selected sample locations ... Table E3. Brief descriptions of samples collected in this study ... Table E4. Whole rock major and trace element concentrations ... Figure E3. Whole rock major element plots against SiO2 ...
289
289 291 292 293 294 296 299
F. HAND SAMPLE PHOTOS AND THIN SECTION SCANS OF SAMPLES
COLLECTED DURING FIELDWORK FOR THIS PH.D. STUDY ... Table F1. Grasberg hand sample and thin section photos ... Table F2. Taranaki hand sample and thin section photos ...
CHAPTER 1.
INTRODUCTION
1.1 PLATINUM GROUP ELEMENTS
The Platinum Group Elements (PGE), comprising Ru, Rh, Pd, Os, Ir, and Pt, are both strongly siderophile (i.e. have an affinity for iron) and chalcophile (i.e. have an affinity for sulfur) elements. Their most significant use is as automobile exhaust catalysts but they are also used as catalysts in other industrial applications and in jewellery. Rhenium is often included with PGE studies owing to their similar physical and chemical characteristics. Their distinctive chemical properties and behaviour make them ideal trace elements to analyse in studies of magmatic processes but their very low abundance on Earth has, until recently, prevented detailed study of PGE in rocks where their concentrations have been at the sub-ppb level. Improvements in analytical techniques of these elements at very low concentration (Ravizza and Pyle, 1997; Setiabudi et al., 2007; Park et al., 2012a) now allow the study of PGE and Re abundances in rocks of intermediate to felsic compositions.
The siderophile and chalcophile nature of the PGE and their behaviour in the mantle and mafic rock associations has been studied extensively compared to investigations of PGE in felsic rocks, principally because of the greater abundances of PGE in mafic rocks and their economic association with mafic and ultramafic suites. The association of PGE with sulfides in hydrothermal mineralisation, specifically porphyry systems, has been recognised through the analysis of sulfide concentrates (Economou-Eliopoulos, 2005, and references therein). It is only recently that PGE concentrations in intermediate-felsic rocks have been studied in detail (e.g. Setiabudi et al., 2007; Park et al., 2012b; Park et al., 2013a; Park et al., 2013b; Park et al., 2015).
1.1.1 PGE and Re behaviour from mantle to crust
Barnes and Fiorentini, 2008; Lorand et al., 2008; Pitcher et al., 2009; Lorand et al., 2010; Brenan et al., 2012; Park et al., 2012a; Mungall and Brenan, 2014). In the absence of PGE alloys, sulfides or chromites, IPGE (Os, Ir, Ru) typically partition into mantle assemblages of olivine, pyroxenes and spinels during mantle melting whereas PPGE (Rh, Pt, Pd) typically partition into silicate liquids, though Pt may be compatible in clinopyroxene and Rh in spinel (Righter et al., 2004; Brenan et al., 2005; Mungall, 2005; Barnes et al., 2015). In oxidised magmas IPGE and Rh partition into spinels, particularly Cr-spinels, which can also contain PGE alloys (e.g. Pt-Fe alloys) as inclusions (Capobianco and Drake, 1990; Capobianco et al., 1994; Park et al., 2012a). Chromite is an important host to PGM and PGE-alloys and chromite crystal growth can lead to alloy saturation by generating localised reduced conditions at the chromite crystal boundary (Finnigan et al., 2008; Brenan et al., 2012). Laurite (RuS2) and PGE
alloys can also precipitate directly from melts (Brenan and Andrews, 2001; Andrews and Brenan, 2002a). However, sulfide liquid, where present, has the strongest control over PGE concentrations (Barnes et al., 2015).
Sulfide melt-silicate melt partition coefficients for PGE have been reported on the order of 103 to greater than 107 (Campbell and Barnes, 1984; Stone et al., 1990; Fleet et al., 1991; Crocket et al., 1992; Bezmen et al., 1994; Fleet et al., 1996; Crocket et al., 1997; Vogel and Keays, 1997; Fleet et al., 1999; Rehkämper et al., 1999; Andrews and Brenan, 2002b; Sattari et al., 2002; Pruseth and Palme, 2004; Fonseca et al., 2009; Mungall and Brenan, 2014), whereas for Au they vary from 103 to 104 and for Cu from 102 to 103 (Francis, 1990; Peach et al., 1990; Crocket et al., 1992; Bezmen et al., 1994; Crocket et al., 1997; Gaetani and Grove, 1997; Ripley et al., 2002; Mungall and Brenan, 2014). These values are dependent on physical and chemical conditions of the melts, for example temperature, ƒO2, ƒS2, and melt chemical composition. However,
the presence of PGE (alloy or sulfide) nuggets in solubility experiments leads to lower calculated values of the sulfide melt-silicate melt partition coefficients for the PGE (Pruseth and Palme, 2004; Fonseca et al., 2009). Therefore, recently determined sulfide melt-silicate melt partition coefficients for PGE are much higher than many previous measured values. Sulfide melt – silicate melt partition coefficients for PGE of 105-106 are used in this study.
(Campbell and Naldrett, 1979) also needs to be considered when applying partition coefficients to ore deposit models. For example, in cases where the sulfide melt-silicate melt partition coefficient of an element is large compared to R (being the mass ratio of silicate to sulfide liquid), the concentration of the element in the sulfide melt is controlled by R (Campbell and Naldrett, 1979; Campbell and Barnes, 1984; Fonseca et al., 2009).
The oxidation state of the melt has an important influence on the solubility of sulfur in melts. In relatively oxidised magmas sulfate is the stable sulfur species and readily dissolves in silicate melts. In more reduced magmas sulfide is stable, which is less soluble. Magmas generated in arc-settings above subduction zones are typically more oxidised than MORB with an ƒO2 near the sulfide-sulfate transition at ca. FMQ +
1, which can make sulfate the dominant sulfur species and delay the onset of sulfide saturation (Richards, 2015, and references therein).
Upon cooling of sulfide melts, the PGE can become differentiated through fractionation of monosulfide solid solution (mss) from the sulfide liquid. The IPGE and Rh partition into mss whilst Pt and Pd remain incompatible (Li et al., 1996; Barnes et al., 1997; Mungall et al., 2005).
1.1.2 PGE and Re behaviour from magmatic to hydrothermal fluids
analysis of native sulfur condensates, but much less compatible than Au, Cu, or Re. However, they found Pd to be less compatible relative to other PGE. Though some types of fluids can carry PGE, if sulfide saturation occurs prior to volatile saturation in an evolving magmatic system then the sulfide will scavenge PGE and other chalcophile elements, preventing their partitioning into the volatile phase and subsequent transport by hydrothermal fluids.
1.2 FELSIC ARC ROCK SUITES
1.2.1 PGE and Re in felsic arc rocks and porphyry systems
The concentrations of PGE in intermediate-felsic igneous suites have been successfully determined to much greater resolution and precision only recently. Setiabudi et al. (2007) analysed PGE in andesites from the Magerang-Imang and Nakan suites, East Kalimantan, and found that the PGE concentrations decreased with fractionation. Park et al. (2013a; 2013b; 2015) analysed PGE in several intermediate-felsic suites to determine if sulfide saturation had occurred during fractionation. The rapid decrease of PGE concentrations is indicative of the magmas becoming sulfide saturated and forming a sulfide melt.
Platinum group elements in mineralisation related to porphyry Cu deposits, rather than the host intrusions, have been investigated in several studies that found ppb to ppm levels of PGE, predominantly Pd ± Pt, associated with sulfide mineralisation or platinum group minerals (PGM) (Werle et al., 1984; Eliopoulos and Economou-Eliopoulos, 1991; Tarkian and Koopmann, 1995; Tarkian and Stribrny, 1999; Economou-Eliopoulos and Eliopoulos, 2000; Tarkian et al., 2003; Pašava et al., 2010). The Re-Os concentrations (ppm to ppb level) and isotopic compositions of sulfides from a porphyry deposit were employed by Liu et al. (2012) to date the ore mineralisation. Auge et al. (2005) analysed mineralised samples from the Elatsite porphyry Cu deposit, Bulgaria, which contains PGM (Pd tellurides, predominantly merenskyite (Pd, Pt)(Te, Bi)2) associated with base metal sulfides. Their mineralised samples contained up to 349
mineralisation at the Mount Milligan porphyry Cu-Au deposit, Canada. Although not deposited during the porphyry mineralisation stage, they proposed that the PGE tellurides precipitated in sub-epithermal conditions from lower temperature (< 300°C) fluids that originated as a contracted vapour phase from boiling of porphyry fluids. A summary of PGE in porphyry deposits can be found in Economou-Eliopoulos (2005).
1.2.2 Porphyry Cu (± Au) systems
The majority of the world’s current Cu production comes from mining porphyry Cu deposits, making the understanding of their formation and properties important for geological research, mining, and exploration alike. Porphyry deposits are typically large-tonnage, low- to medium-grade deposits. They are frequently associated with other intrusion-related hydrothermal mineralisation such as skarn and epithermal deposits (Mudd et al., 2013). Characteristics of porphyry deposits, including associated magmatic and hydrothermal processes, have been summarised in review papers including Cloos (2001), Richards (2003), Candela and Piccoli (2005), Cooke et al. (2005), Gow and Walshe (2005), Richards (2005), Seedorff et al. (2005), Sillitoe (2010), Audétat and Simon (2012), and Kouzmanov and Pokrovski (2012). A brief summary of features of porphyry Cu systems is outlined below.
Volatile saturation can be brought about by a reduction in pressure or crystallisation of the magma (Candela, 1997). For an economic deposit to form, significant quantities of ore metals and sulfur need to partition into the volatile phase to be transported and precipitated as disseminated or stockwork sulfide mineralisation. A range of factors influence the way in which porphyry mineralisation develops; these include the composition of the magma, oxidation state, timing of magmatic processes (including sulfide and ore-fluid saturation), depth of emplacement, and geodynamic setting (Candela, 1997; Cooke et al., 2005; Seedorff et al., 2005; Sillitoe, 2010). The interplay among these factors controls the quantity and type of porphyry mineralisation that will form.
Figure 1.1. Schematic diagrams showing (A) a magmatic plumbing system beneath an arc volcano and (B) a porphyry system that may develop in the upper crust. After Tosdal et al. (2009) and Zernack et al. (2012b).
1.2.3 Sulfide saturation during the magmatic evolution of porphyry-associated systems
with decreasing pressure (Mavrogenes and O’Neill, 1999). Sulfide saturation in arc-related magmatic systems has been identified as a potentially important control on chalcophile element fertility in fractionating magma systems (e.g. Park et al., 2013a; Jenner et al., 2015; Park et al., 2015). If sulfide saturation occurs in shallower-level secondary chambers the sulfide minerals that precipitate from the melt may later break down and release their chalcophile elements into the ore fluid (Keith et al., 1997; Halter et al., 2002; Halter et al., 2005; Richards, 2009; Nadeau et al., 2010; Audétat and Simon, 2012; Wilkinson, 2013; Nadeau, 2015). However, if sulfide saturation occurs in a deeper parental magma chamber, the chalcophile elements are stripped from the silicate magma and become “trapped” in sulfides within cumulate rocks and are unable to partition into the ore-forming hydrothermal fluid. Late-stage sulfide saturation is also an important process in the generation of some other types of ore deposits, such as Ni-Cu-PGE and other hydrothermal deposits (Keays, 1987).
1.3 STUDY OBJECTIVES
The principal aim in this study is to investigate PGE and Re concentrations in felsic rocks that are associated with porphyry Cu ± Au ± (Pd) deposits to determine whether PGE can be used as an exploration tool for these deposits. Platinum group elements are more sensitive indicators of magmatic processes such as sulfide saturation, than other chalcophile elements such as Cu or Au, and they are also more resilient to alteration, making them more useful than Cu or Au in porphyry environments where Cu ± Au are very mobile. If sulfide saturation in a deep magma chamber precedes the saturation of an ore-fluid during the magmatic evolution of these types of systems then the PGE, Cu, and Au will partition into the sulfide melt that forms, preventing them from partitioning into the ore-fluid and forming porphyry mineralisation.
1.4 STUDY AREAS
This study focused on two ore-bearing porphyry systems. In addition, determination of PGE and Re content of another suite was undertaken to complement the overall understanding of PGE and Re behaviour. In suites that follow an Fe-enrichment trend during magmatic evolution, for example tholeiitic magmas such as Pual Ridge, magnetite saturation reduces the ƒO2 because it reduces the Fe3+/Fe2+ ratio in the melt,
melt, thus preventing the formation of a porphyry deposit. In suites that follow an Fe-depletion trend, such as calc-alkaline magmas, there is a lack of a sudden magnetite saturation event and subsequent sulfide saturation. If the magmas are or become magnetite saturated, it is a gradual process rather than a build up of Fe and sudden precipitation of magnetite. In suites that produce a porphyry deposit, sulfide saturation has not stripped the silicate magma of ore-forming elements. The two ore-bearing porphyry suites that are included in this study are the El Abra-Pajonal suite, including the El Abra porphyry Cu deposit, and the intrusive units related to the Grasberg porphyry Cu-Au deposit. Porphyry deposits are typically associated with calc-alkaline arc-type magmas that are intermediate to felsic in composition, hydrous, sulfur-rich, and relatively oxidised. The oxidised nature of these magmas and the metal enrichment of porphyry deposits initially suggest that sulfide saturation has probably not occurred prior to volatile saturation otherwise the ore mineral constituents would not partition into the volatile phase during exsolution and thus not form a deposit. This study will investigate this hypothesis. The additional igneous suite studied is Mt. Taranaki, which is not associated with porphyry mineralisation.
1.4.1 El Abra, Chile
The El Abra-Pajonal suite, and associated El Abra porphyry Cu deposit, is a felsic intrusive igneous complex that formed in northern Chile from 35 to 43 Ma (Fig. 1.2; Valente, 2008). The petrography and geochemistry of the numerous calk-alkaline intrusive units was studied at the Australian National University by Valente (2008), however, no PGE or Re analysis of these samples has been undertaken. Petrology, whole rock and mineral geochemistry along with U/Pb geochronology suggests that the El Abra-Pajonal intrusive complex developed from crystal fractionation, assimilation, and magma mixing in a long-lived mid to deep crustal chamber that fed a series of short-lived upper crustal chambers (Valente, 2008). The suite shows an Fe-depletion trend.
Figure 1.2. Location map showing El Abra porphyry Cu deposit, Chile, as well as some of the other major porphyry Cu deposits in the region. Map modified from GeoMapApp (www.geomapapp.org), Ryan et al. (2009) and Valente (2008).
1.4.2 Grasberg, Indonesia
[image:29.595.217.439.78.436.2]Figure 1.3. Schematic location map showing Grasberg porphyry Cu-Au deposit in Papua, Indonesia. Map modified from GeoMapApp (www.geomapapp.org) and Ryan et al. (2009).
Grasberg was chosen for this study as an example of an Au-Cu-(Pd) porphyry deposit. The intrusions associated with this large deposit and those in the surrounding area have been extensively explored and a substantial amount of drill core, of both mineralised and unmineralised parts of the intrusions, was available for sampling. Zircon U-Pb dating of the intrusions was undertaken to complement the geochemistry results and further constrain the crystallisation ages of each intrusion. U-Pb dating has only recently been applied to the Grasberg-Ertsberg district and this study differs from previous in the analytical technique and corrections applied to the data.
1.4.3 Taranaki, New Zealand
[image:30.595.124.416.80.360.2]Figure 1.4. Maps showing location of Mt. Taranaki on the west coast of the North Island of New Zealand. Map modified from GeoMapApp (www.geomapapp.org) and Ryan et al. (2009).
focussed on the geochemistry of igneous samples and the eruption record from Mt. Taranaki and the surrounding ring plain (Gow, 1968; Neall et al., 1986; Kellett, 1991; Price et al., 1992; Stewart et al., 1996; Price et al., 1999; Alloway et al., 2005; Platz, 2007; Platz et al., 2007; Stewart et al., 2008; Turner, 2008; Turner et al., 2008a; Turner et al., 2008b; Zernack, 2008; Stewart et al., 2009; Turner et al., 2009; Zernack et al., 2009; Gruender et al., 2010; Turner et al., 2011a, b; Zernack et al., 2011; Zernack et al., 2012a; Zernack et al., 2012b). Analysis of PGE in samples from Mt. Taranaki has not previously been carried out.
1.5 THESIS STRUCTURE
This thesis is divided into six chapters plus appendices. Chapter 2 has already been published, a copy of which is included in Appendix B. Chapters 3, 4, and 5 are written as stand alone chapters in manuscript style for journal submission.
CHAPTER 2.
EL ABRA
Using platinum group elements to identify sulfide
saturation in a porphyry Cu system: the El Abra
porphyry Cu deposit, northern Chile
PREFACE
This Chapter is based on a manuscript published in Journal of Petrology (56: 2491-2514) that incorporates petrological, geochronological and geochemical results of samples from El Abra analysed by D. Valente as part of her Ph.D. thesis as well as the PGE geochemistry results from this Ph.D. study. The material included here is predominantly based on the PGE component of that manuscript written by H. Cocker, who carried out the PGE analysis of the samples as well as generating the petrological, geochemical, and geochronological data from the thesis of D. Valente, with other sections acknowledged as work of D. Valente where applicable. The other co-authors, J.-W. Park and I. Campbell, assisted with lab analyses, discussions of the data, and reviewed drafts of the manuscript. A copy of the manuscript is included at the end of Appendix B.
The aim of this study was to use the abundances of Pt and Pd to identify the timing of sulfide saturation, relative to fluid saturation, in an evolving magmatic system that produced a porphyry Cu deposit.
ABSTRACT
mineralisation and, if they do, whether the deposits are Cu-only or Cu-Au. This study incorporates the first comprehensive analysis of PGEs in a felsic magmatic suite associated with an economic porphyry system. The suite comprises a series of quartz monzodiorite to granite intrusions with U-Pb zircon ages between 43 and 35 Ma. Petrography and major element chemistry, including increasing Sr/Y ratios and rare earth element patterns, suggest crystal fractionation and crustal assimilation were the key magmatic processes governing the evolution of the El Abra-Pajonal suite. Plagioclase fractionation dominated the oldest intrusions, and their associated granites and aplites. Following the injection of a more primitive, wetter, mafic magma at 41-40 Ma, plagioclase fractionation became suppressed and amphibole became the dominant fractionating phase leading to the formation of the El Abra porphyry intrusion and Cu deposit. Abundances of Pt and Pd in felsic rocks from the El Abra-Pajonal intrusive complex drop rapidly in samples with MgO values below 2.5 wt. %, following sulfide saturation of the magmas, which occurs slightly before ore-fluid saturation and formation of the Cu deposit. Modeling suggests that the amount of sulfide to form was very small, enough to strip the PGE and Au from the magma but not Cu, because of the lower partition coefficient of Cu relative to the precious metals, which explains why the mineralisation at El Abra is a Cu-only porphyry deposit, rather than a Cu-Au deposit.
2.1 INTRODUCTION 2.1.1 Porphyry systems
The majority of the world’s Cu production comes from porphyry Cu deposits, making an understanding of their genesis a critical factor in Cu exploration. Porphyry deposits are typically large-tonnage, low- to medium-grade deposits. They are frequently associated with other intrusion-related hydrothermal mineralisation systems such as skarn and epithermal deposits (Mudd et al., 2013). Characteristics of porphyry deposits, including associated magmatic and hydrothermal processes, have been summarised in numerous recent review papers including Seedorff et al. (2005), Sillitoe (2010), Audétat & Simon (2012), and Kouzmanov and Pokrovski (2012) and in references therein.
originate from deeper parent bodies (Dilles, 1987; Seedorff et al., 2005; Seedorff et al., 2008; Sillitoe, 2010). The shallow ore-associated intrusions exsolve magmatic fluids, which, along with circulating meteoric water, hydrothermally alter the host rock and deposit ore minerals. There are many different aspects of porphyry formation that influence porphyry mineralisation. These include the composition of the magma, oxidation state, timing of magmatic processes (including sulfide and ore-fluid saturation), depth of emplacement, and geodynamic setting (Candela, 1997; Cooke et al., 2005; Seedorff et al., 2005; Sillitoe, 2010). The interplay among these factors controls the quantity and type of porphyry mineralisation that will form.
Figure 2.1. Location map showing El Abra deposit as well as some of the other major porphyry Cu deposits in the region. Map modified from Valente (2008).
2.1.2 Sulfide saturation
ore-fluid saturated most of the Cu and Au will be trapped within sulfides in a deep parent magma chamber and be unavailable to enter a hydrothermal fluid, which emanates from one of the shallow daughter intrusions, the El Abra porphyry. Alternatively, if ore-fluid saturation occurs before sulfide saturation most of the Cu and Au will be available to partition into the magmatic hydrothermal fluid, which could lead to the formation of an economic Cu and/or Au deposit.
The PGEs are preferred to Au and Cu for identifying sulfide saturation in evolving silicate melts for two reasons. First, the partition coefficients for Pt and Pd into an immiscible sulfide melt are approximately two orders of magnitude higher that Au and Cu (Mungall & Brenan, 2014). As a consequence, Pd and Pt are much more sensitive indicators of sulfide fractionation. Second, the original Au and Cu content of the rocks can be overprinted by secondary Cu and/or Au mineralisation making it impossible to obtain the primary concentration of these elements in samples. Although the ore forming fluid can carry Pd, the amount is trivial compared with Cu and Au. For example, the Au/Pd ratio of the primitive mantle (McDonogh & Sun, 1995) and basaltic magmas, prior to sulfide saturation (Park et al., 2013a, 2015), is typically 0.25 to 0.8 but it averages over 90 for a wide range of Pd-rich porphyries analysed by Tarkian and Stribrny (1999). Bearing in mind that the Pd content of many of the analysed samples was below their detection limit of 8 ppb, the high Au/Pd ratio of porphyry ore implies that Au is at least 100 times more soluble than Pd in the ore-forming fluid.
El Abra-Pajonal intrusive complex make an ideal study area because it is a well-exposed suite that exhibits a range of chemical compositions (quartz monzodiorite to granite), leading up to the formation of a porphyry Cu deposit. A secondary aim of this study is to determine why El Abra is a Cu-only system and to determine its place in a continuum of Cu ± Au (± PGE-enriched) systems (for PGE enrichment in porphyry systems see Tarkian and Stribrny (1999) and Economou-Eliopoulos (2005)). It does not aim to address all of the different types of porphyry systems, such as Cu ± Au ± Mo but instead attempts to understand how sulfide saturation in a crustal magmatic system controls Cu ± Au porphyry mineralisation.
2.2 GEOLOGICAL SETTING
Chile is host to numerous porphyry Cu, Cu-Mo, and Cu-Au deposits, including ten of the world’s twenty-five largest by contained Cu metal amounting to 358 Mt Cu (Camus and Dilles, 2001; Cooke et al., 2005). The deposits are situated in five N-S trending metallogenic belts in central and northern Chile, reflecting the eastward arc migration and broader regional tectonic setting, and range in age from Cretaceous to Pliocene, corresponding to the establishment of the Andean tectonic cycle (Camus and Dilles, 2001; Gow and Walshe, 2005). The host intrusive complexes are calc-alkaline granitoids and porphyries that crystallised from oxidised hydrous magmas (Ishihara et al., 1984; Kay et al., 1999; Camus and Dilles, 2001).
El Abra is an economic porphyry Cu-only deposit in northern Chile associated with the El Abra-Pajonal complex, a suite of intermediate to felsic intrusives (Fig. 2.2; Ambrus, 1977; Dilles et al., 1997). The initial Cu-oxide reserve for the El Abra deposit at the commencement of mining in 1995 was 798 million tons at 0.54 wt. % Cu (Gerwe, 2005) whereas the Cu-sulfide ore reserve was 452 million tons at 0.64 wt. % Cu (Graichen et al., 1995). The deposit occurs within a deep-seated, north–west trending shear zone that is linked to the West Fissure Fault Zone (Graichen et al., 1995; Barrett, 2004; Gerwe, 2005), a major fault that is part of the Domeyko Fault system and is associated with many other porphyry Cu deposits in the region, including, from north to south, Collahuasi District, La Escondida, Chuquicamata, and El Salvador (Fig. 2.1; Ambrus, 1977; Reutter et al., 1996; Cornejo et al., 1997; Garza et al., 2001; Ossandon et al., 2001; Richards et al., 2001; Masterman et al., 2005; Urqueta et al., 2009).
Figure 2.2 previous page. (a) Geological map of El Abra region showing location of samples used in this study. Area within dashed rectangle is enlarged in map (b). Grid references for each sample are included in Table A2. Those labeled with sample numbers (with ANU07 prefix omitted) refer to samples that were chosen for PGE and Re analysis. Simplified geological map modified from Tomlinson et al. (1995) and Barrett (1997). Post-El Abra-Pajonal units of Tertiary to Quaternary age include the Carcote ignimbrite and Tertiary and Quaternary gravels. Pre-El Abra-Pajonal units of Palaeozoic to Tertiary age include the Icanche Formation, Saturno fanglomerate, Cerro Colorado Complex, Tolar Formation, and Collahuasi Formation. Projection UTM 19K, datum South America Provisional 1956. More detailed geology maps are included in Appendix B (Figs. B1 and B2).
2.3 SAMPLE SELECTION AND ANALYTICAL TECHNIQUES
Samples were collected from all units of the El Abra-Pajonal intrusive complex including the El Abra porphyry. Fresh to weakly altered samples were targeted where possible to avoid mineralisation, although some weakly altered samples have small amounts of disseminated hydrothermal sulfide.
ANU07-110 duplicate, with 81.6%), and <65% for Ru (Ni argide interference). The method limits of detection, taken as three standard deviations of the procedural blanks, were 0.5 ppt for Ir, 1.3 ppt for Ru, 1.4 ppt for Rh, 19.7 ppt for Pt, 9.5 ppt for Pd, and 8.2 ppt for Re. Total uncertainties in the data, which primarily result from uncertainty in the blank subtraction and ICP-MS counting statistics, and the measurements of blanks are reported in the results section. The reference material TDB-1 (CCRMP-CANMET diabase) was used to assess the accuracy and precision of the measurements. Our analyses of the PGE and Re abundances in TDB-1 and error measurements are reported in the results section and are consistent with the previously reported values of Plessen and Erzinger (1998), Peucker-Ehrenbrink et al. (2003), Meisel and Moser (2004), and Savard et al. (2010).
All non-PGE data for the El Abra suite discussed in this study was analysed by Valente (2008).
2.4 RESULTS
Only the PGE results are described here in detail. The results section of the published paper (in Appendix B) contains details of the other geochemical and geochronological data. Figures pertaining to results obtained by D. Valente were drafted by H. Cocker and are included here for reference when examining the PGE results and discussion (Figs. 2.3 to 2.6). Results tables for U-Pb dating and major and trace element data are included in Appendix B (Tables B1 and B2).
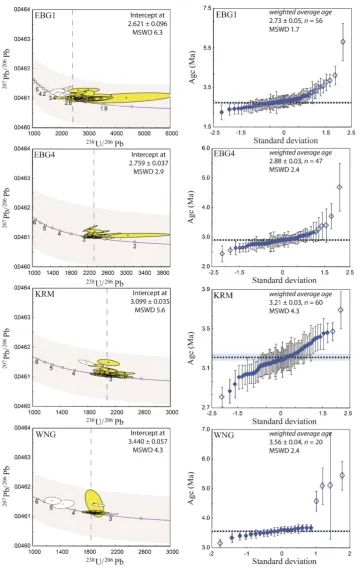
Figure 2.3.206Pb/238U zircon ages for the El Abra-Pajonal suite samples with shaded areas representing average ages for each intrusion analysed in this study. Errors shown are 2 standard deviations of the weighted average. Also shown are U-Pb zircon ages of El Abra-Pajonal, Los Picos, Fortuna, and Chuquicamata samples from Campbell et al.
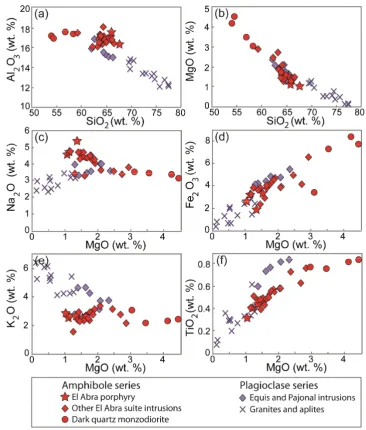
Figure 2.4. Selected whole rock major element results for El Abra-Pajonal suite
samples. (a & b) Al2O3 and MgO concentrations plotted against whole rock SiO2 values
for El Abra-Pajonal suite samples. (c to f) Na2O, Fe2O3, K2O and TiO2 plotted against
MgO. Red symbols are intrusions <41 Ma and are related to amphibole-dominant fractionation. Star symbols indicate samples are from the El Abra porphyry, which is associated with Cu mineralisation. Circles are samples from the Dark quartz
2.4.1 Whole rock PGE and Re geochemistry
Whole rock Pt and Pd abundances are reported for 21 El Abra-Pajonal samples (Table 2.1; all PGE and Re values are blank subtracted). The other analysed PGE were below or close to the method limit of detection (MDL) and are therefore not considered further. Rhenium abundances were measurable in 20 samples and range from <8.2 ppt to 46.7 ppb but show no clear trend. Measurements of blanks and reference material (TDB-1) are shown in Tables 2.2 and 2.3.
T
ab
le
2
.1
.
co
nt
in
ue
d.
Sa m p le In tr us iv e u ni t M gO C u Ir R u R h P t P d R e (w t. % ) (p p m ) (p pt ) (p pt ) (p pt ) (p pt ) (p p t) (p p t) A N U 07 -1 10 E qu is m on zo gr an it e 2. 1 54 93 1. 73 ± 0 .1 8 2. 30 ± 0. 53 5. 90 ± 0. 56 77 6 ± 1 0. 6 21 2 ± 5 .4 40 3 ± 1 0. 6 A N U 07 -1 10 * E qu is m on zo gr an it e 2. 1 1. 87 ± 0 .2 6 < 1. 3 3. 60 ± 0. 84 78 4 ± 9 .9 25 3 ± 6 .1 41 5 ± 1 1. 8 A N U 07 -1 22 * P aj on al q ua rt z m on do ni te 2. 4 < 0. 5 < 1. 3 2. 95 ± 0. 77 41 8 ± 8 .7 42 3 ± 6 .5 30 ± 3 .2 A N U 07 -1 22 P aj on al q ua rt z m on do ni te 2. 4 72 5. 38 ± 0 .2 3 < 1. 3 11 .1 7 ± 0. 67 60 4 ± 1 0. 4 79 7 ± 1 9. 3 91 ± 3 .2 A N U 00 -1 31 † C en tr al g ra no di or it e 2. 5 1. 31 ± 0 .3 0 2. 54 ± 1. 24 10 .6 3 ± 0. 75 10 17 ± 2 9. 7 10 75 ± 3 2. 2 57 70 ± 1 79 .7 A N U 07 -1 13 C en tr al g ra no di or it e 2. 7 21 35 1. 29 ± 0 .1 7 2. 50 ± 0. 58 4. 14 ± 0. 76 45 7 ± 1 0. 4 88 3 ± 7 1. 4 46 78 0 ± 8 91 .0 A N U 07 -1 13 * C en tr al g ra no di or it e 2. 7 26 .9 7 ± 0. 86 < 1. 3 4. 14 ± 0. 88 51 8 ± 1 3. 0 96 1 ± 1 5. 7 29 72 9 ± 5 49 .3 A N U 07 -1 03 C en tr al g ra no di or it e 2. 9 50 1. 13 ± 0 .1 8 < 1. 3 5. 02 ± 0. 53 46 7 ± 1 2. 7 84 8 ± 1 8. 6 15 93 3 ± 2 90 .2 A N U 07 -1 03 * C en tr al g ra no di or it e 2. 9 < 0. 5 < 1. 3 6. 22 ± 1. 10 58 5 ± 1 1. 5 77 1 ± 1 5. 0 18 24 1± 155.
T
ab
le
2
.2
.
P
T
ab
le
2
.3
.
R
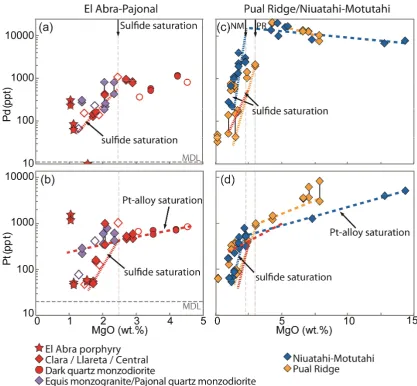
Figure 2.7. Graphs showing Pd (a & c) and Pt (b & d) plotted against MgO for samples from the El Abra-Pajonal igneous complex (left hand side; a & b) and for Pual Ridge and Niuatahi-Motutahi suites (right hand side; c & d; Park et al., 2013; Park et al., 2015) as a comparison. Red symbols are intrusions <41 Ma and are related to
amphibole-dominant fractionation. Star symbols indicate samples are from the El Abra porphyry, which is associated with Cu mineralisation. Circles are samples from the Dark quartz monzodiorite. Light purple symbols indicate intrusions >41 Ma and are related to plagioclase-dominant fractionation. Open symbols show samples that were not analysed in duplicate. Dashed lines show Pt trends prior to sulfide saturation, dotted lines show Pd and Pt trends after sulfide saturation. Solid vertical lines link duplicate samples, see Table 2.1 for more details of duplicate analyses. MDL is the method detection limit.
decreasing U-Pb age whereas those from the Plagioclase series show no clear trend (Fig. 2.8b).
2.5 DISCUSSION
2.5.1 Magmatic evolution
Although the intrusions that make up the El Abra-Pajonal suite have many similar geochemical characteristics, it is unclear if they have formed predominantly from a single deeper parent magma that experienced the injection of a more primitive, wetter melt followed by mixing of these magmas, or from separate parent magmas that followed different fractionation trends. Two distinct series can be recognised, a Plagioclase- and an Amphibole-dominant series (Figs. 2.3 to 2.8). Both evolved through a combination of fractional crystallisation and assimilation. New magma batches, originating from the deeper chamber(s), were periodically injected into a series of short-lived shallow-crustal chambers, from which our samples were collected. Evidence of assimilation, which comes from zircon inheritance and the presence of xenoliths in the intrusions, is discussed in more detail in Valente (2008).
The older Plagioclase series, which includes the Pajonal quartz monzonite, Equis monzogranite and Antena aplite, show all the characteristics of plagioclase-dominated fractionation: REE patterns with negative Eu anomalies (i.e. decreasing Eu/Eu*) that correlate with decreasing Sr/Y (Figs. 2.5c & 2.6b), REE abundances that increase with increasing fractionation, with little change in La/Lu, and Al2O3 that decreases with
increasing SiO2 (Fig. 2.4a). Major and trace element modeling by Valente (2008)
suggests that pyroxene was the dominant ferromagnesian phase. The Plagioclase series is interpreted to have formed from a relatively dry magma (Annen et al., 2006).
The younger Amphibole series includes the Dark quartz monzodiorite, Central granodiorite, Llareta quartz monzodiorite, Clara granodiorite, El Abra porphyry and Lagarto porphyry. It is characterised by HREE that decrease and La/Lu that increases with fractionation, small Eu anomalies that decrease with fractionation (Figs. 2.5c & 2.6a), and Al2O3 that varies little with increasing SiO2 (Fig. 2.4a). This type of
fractionation is attributed to amphibole-dominated fractionation with little to no plagioclase fractionation from a relatively wet magma (Annen et al., 2006; Richards, 2011a; Chiaradia et al., 2012). The spoon-shaped (concave) HREE patterns displayed by these samples are characteristic of amphibole ± titanite fractionation (Ballard, 2001, Valente, 2008).
members of the Plagioclase series. Furthermore, they have the distinctive spoon-shaped HREE patterns of the Amphibole series and clearly belong to that series. Valente (2008) suggests that the fractionation seen in these samples took place in the upper crustal intrusions from which the samples were collected to explain the variable composition of samples from the same intrusion, which is appreciably greater than for other members of that series. A drop in pressure, accompanied by loss of water, may explain why plagioclase replaced amphibole as the dominant crystallising phase. The Apolo granite samples (Fig. 2.6c) have lower REE abundances and show a wider range of positive and negative Eu anomalies than all other samples, reflecting a combination of plagioclase fractionation and cumulate processes.
The most primitive magma in the El Abra-Pajonal suite is the Dark quartz monzodiorite, which belongs to the Amphibole series. The Dark quartz monzodiorite is attributed to the entry of a new pulse of magma into the system. It is not clear whether this new pulse entered a deep chamber, which contained magma of the Plagioclase series that had been previously been crystallising plagioclase, and mixed with that magma to produce a magma with an intermediate Eu anomaly or whether the Amphibole series developed in a deeper chamber that was independent of the first series. The observation that the most primitive magma of the Amphibole series has the strongest Eu anomaly is most simply explained by the former hypothesis. On the other hand, the range of REE concentrations seen in the individual intrusions of the Plagioclase series shows that much of the fractionations occurred within the sampled upper level intrusions. As with the Rojo Grande and Apolo intrusions, loss of water during decompression may explain why amphibole crystallisation is unimportant or absent in the Plagioclase series. In either case the PGE geochemistry of both series needs to be treated separately.
fractionation dominates over plagioclase will produce melts with successively higher Sr/Y and La/Yb values (Figs. 2.3h & 2.7c; Rohrlach, 2005; Richards, 2011a). Amphibole-dominant fractionation in the deeper parent chamber, which fed the smaller higher-level chambers of the Amphibole series samples, is marked by continuously increasing La/Dy and La/Yb (Figs. 2.6 & 2.8b) and decreasing Dy, Y, Ni, Fe and Mg concentrations. These observations suggest that amphibole fractionation became increasingly important in the magmatic system from 41.7 Ma, peaking with the emplacement of the Clara granodiorite and the porphyries, which are depleted in middle-to heavy-REE and have very little or no Eu anomalies compared with older intrusive units of the Amphibole series (Fig. 2.6a). The increasing Eu/Eu* is attributed to plagioclase accumulation, which also increases Sr/Y, and the bimodal distribution as discriminating between intrusion that accumulated plagioclase phenocrysts, such as the Clara granodiorite, El Abra porphyry and Lagarto porphyry, and those that have not, which include the Dark quartz monzodiorite and Central granodiorite. The obvious inference of the increasing importance of amphibole in the magma system is that the deep parent magma chamber became increasingly hydrous, and so a greater amount of water exsolved in the shallow-level chambers, leading eventually to the formation of the magmatic hydrothermal fluids that produced the El Abra porphyry mineralisation. These trends contrast sharply with those seen in the Plagioclase series, which are produced by relatively dry magmas. Note that the higher Sr/Y seen in the Apolo granite samples (that have corresponding Eu/Eu* >1) relative to the other granites is due to plagioclase accumulation rather than fractional crystallisation. Pyroxene, although only seen in trace amounts in the Pajonal quartz monzonite, is also a likely cumulate phase in the plagioclase-dominated parent chamber of the intrusions older than 41 Ma.
2.5.2 PGE-alloy and sulfide saturation
porphyrytic to phaneritic plutonic rocks collected from shallow level intrusions. Evidence of fractionation occurring within individual intrusions (Figs. 2.4, 2.5 & 2.6) provides clear evidence that cumulate processes were operating in the deep magma chamber. Prior to sulfide saturation, Pd behaves as an incompatible element (Park et al., 2013) and its concentration in cumulate rock is controlled by a combination of its concentration in the melt and the fraction of trapped liquid in the cumulate rock. The absence of a clear trend in the El Abra-Pajonal Pd data, due to the expected increase in Pd content of the melt (compare Figs. 2.7a & c), may be explained by variations in the amount of trapped liquid in the cumulate rocks. Alternatively, lack of a clear trend in the pre-sulfide Pd data could be due to subtle magma mixing that cannot be unambiguously identified in the major or trace element data. Over the same MgO interval Pt follows a well-defined trend because it is precipitating as a cumulus Pt-rich alloy and is less affected by the amount of trapped liquid in the rocks. Its decline in Figures 2.7b and d is controlled mainly by the declining solubility of Pt in the cooling melt.
Depletion in Pt, without a corresponding decline in Pd, is attributed to alloy precipitation (Park et al., 2013, 2015). The fraction of alloy required to produce the observed decline in Pt in samples with MgO >2.5 wt. % is very small (Fig. 2.7b). Since the rate of decline of Pt in the melt is low, the bulk partition coefficient must be only slightly greater than one. If it is assumed that the alloy contains ca. 85 % Pt, as expected for an alloy precipitating from a felsic melt (Park et al., 2013), the fraction of alloy needed to produce the observed Pt decline from 700 to 450 ppt (4.2 to 2.7 wt. % MgO) is ca. 8 ppb, assuming that 30 % fractionation is required to produce the observed drop in MgO. The scatter in duplicate analyses of samples with MgO contents greater than 2.5 % is greater for Pt than Pd, which is consistent with the existence of a Pt-rich alloy, because the presence of these alloys affects the Pt but not Pd concentrations (see Park et al., 2013).
emanated from one of the shallow daughter intrusions, the El Abra porphyry. As a consequence, the ore-forming fluids did not have access to the cumulate sulfides in the deep parent magma chamber. In this context it is noted that the cumulus sulfides of the Merensky and Platinova Reefs of the Bushveld and Skaergaard intrusions, respectively (Barnes & Campbell, 1988, Keays & Tegner, this issue), and Opirarukaomappu Gabbroic Complex of Japan (Tomkins et al., 2012) are preserved at depth with no evidence of having lost either Cu or Au. Furthermore, if magmatic sulfides were contributing to the ore fluid, one might expect a correlation between Cu and Pd. A plot of Cu against Pd for the analysed El Abra samples (Fig. A4) showed no such correlation. Finally, plots of Cu (Fig. 2.5b) and Au (not shown) against MgO, prior to sulfide saturation (before the appearance of sulfide nuggets), show appreciably more scatter than the PGE plots (i.e. do not follow the same trends as the PGE), which supports the conclusion that Cu and Au are more mobile than the PGE because Cu and Au partition more strongly into the ore fluid and are more affected by hydrothermal alteration than the PGE. The decrease in Pt and Pd seen in this series is similar to that seen at Pual Ridge and Niuatahi-Motutahi (Fig. 2.7c & d), which is also attributed to sulfide saturation (Park et al., 2013a; Park et al., 2015). Once sulfide saturation was reached at 2.5 wt. % MgO the Pt concentration of samples fell below the Pt solubility curve as obtained by projecting the pre-sulfide Pt solubility curve beyond sulfide saturation (Fig. 2.7b). Prior to sulfide saturation at 2.5 wt. % MgO only the Pt data show scatter in the duplicate analyses, whereas for samples with <2.5 wt. % MgO both Pt and Pd show scatter. This difference is attributed to the presence of an immiscible sulfide melt, which sequesters both Pt and Pd, replacing the Pt-rich metal alloy as the nugget phase precipitating from the melt.
The disagreement in Pt and Pd values for duplicates from the Plagioclase series samples, which is greater than that seen in the Amphibole series, is attributed to a higher abundance of sulfide nuggets. The absence of clear trends in this series is also attributed to the abundance of nuggets, which makes sampling difficult. Although no trends can be recognised the presence of sulfide nuggets requires all samples from the Plagioclase series intrusions to have crystallised from a sulfide-saturated melt.
Significant and conclusive petrographic evidence of PGE-alloys and sulfide melt in the El Abra-Pajonal suite samples is lacking because the amount of alloy or sulfide required to produce the observed effect is miniscule, which makes them difficult to find by optical microscopy. Furthermore most of the alloys and sulfide precipitation is postulated to form in an unexposed deeper magma chamber below the sampled shallow intrusions. Sulfide melt blebs associated with sulfide saturation in an evolving magmatic system have been identified in other intrusive suites, for example the Boggy Plains pluton (Park et al., 2013b). In reflected light, yellow inclusions in phenocrysts of possible primary origin, which are rare and too small to identify with confidence, occur in several of the El Abra-Pajonal suite units (El Abra porphyry, Clara granodiorite, Central granodiorite, Dark quartz monzodiorite, Equis monzogranite). These could be sulfide melt blebs that may have formed in the deeper magma chamber and been incorporated into the sampled high-level intrusions in phenocrysts.
A sample of the El Abra porphyry, at 1.1 wt. % MgO (Fig. 2.7b) is anomalous with very high Pt but only slightly elevated Pd indicating that the anomaly is due to the presence of nuggets of Pt-rich metal alloy and not an immiscible sulfide. This interpretation is consistent with the marked difference in the Pt duplicates. If the anomalous Pt values are due to nuggets they must come from the deep chamber, probably as an inclusion in early-formed phenocrysts, because the sample that contains them formed well after sulfide saturation. Park et al. (2013) also noted a correlation between the presence of phenocrysts and metal alloy nuggets at Pual Ridge.
possible if the amount of sulfide liquid that formed at sulfide saturation was small. The sulfide melt-silicate melt partition coefficient of Cu (102 to 103) is lower than Au (103 to 104), and much lower than it is for the Pt and Pd (ca. 105-106) (Campbell and Barnes, 1984; Ripley et al., 2002; Fonseca et al., 2009; Mungall and Brenan, 2014), allowing the sulfide liquid to strip the magma of Au and PGE but not Cu. Richards (2005) recognised that fractionation of a small amount of sulfide melt would remove Au from the silicate melt but not significantly affect the Cu contents, and the results of this study are consistent with this hypothesis. Therefore both the timing of sulfide saturation relative to ore-fluid saturation and the amount of sulfide melt to precipitate are important. Where sulfide saturation preceded ore-fluid saturation it is the amount of sulfide melt that formed that controls the Cu and Au content of the melt and therefore whether the magmatic system has the potential to produce an ore deposit and, if it does, whether the deposit that forms is a Cu-only or Cu-Au.
Sulfide saturation in porphyry systems is suggested to have occurred at other deposits, for example Bajo de la Alumbrera, Argentina, and Bingham Canyon, Utah (Keith et al., 1997; Halter et al., 2002; Halter et al., 2005). These studies, along with review papers, propose that the sulfide droplets that form at sulfide saturation subsequently break down and release the chalcophile elements into exsolving fluids that form the porphyry deposits (Richards, 2009, 2011b; Audétat and Simon, 2012; Wilkinson, 2013). However, this does not appear to be the case at El Abra, nor for the magma chambers that are interpreted to underlie the Pual Ridge and Niuatahi-Motutahi volcanics (Fig. 2.7c & d) because in all cases the Pt and Pd abundances fall following sulfide saturation in a deeper magma chamber. In addition there is no correlation between Cu and Pd at El Abra (Fig. A4), as would be expected if sulfide droplets broke down and released the chalcophile elements into hydrothermal fluids, because the amount of sulfide melt that formed in the deeper chamber was very small, removing PGE and Au from the melt but not significant Cu, allowing the Cu to partition into the hydrothermal fluids that exsolved to form the El Abra porphyry Cu deposit. Leaching of Cu could also differentiate Cu from Pd, however, the samples studied here were not significantly altered or mineralised in order to minimise this effect.
may also play a role in determining Cu:Au ratios in some porphyry systems and have been discussed in more detail in Sillitoe (1997) and Richards (2009). Gold-rich porphyries are typically associated with more alkaline magmas, for example the Cu-Au porphyries in New South Wales, Australia (Wilson et al., 2003; Cooke et al., 2007; Lickfold et al., 2007), which form in post-subduction settings. In contrast, Cu-rich porphyries are often related to intrusions of weakly alkaline to subalkaline affinities that are associated with active subduction (Sillitoe, 2010). The El Abra-Pajonal suite intrusions are subalkaline magmas associated with subduction.
2.5.3 Relative oxidation state of the magmas
Changes in the Ce4+/Ce3+ in zircon suggest that the magmas of the Amphibole-series became more oxidised as the suite evolved (Fig. 2.8d) and the ƒO2 of the suite is estimated to be near the sulfide-sulfate transition. These results are consistent with those of Ballard et al. (2002) for samples from the same suite (shown as small black crosses in Fig. 2.8d). As noted earlier, the oxidation state of the melt has an important influence on the solubility of sulfur in melts. The stable species of sulfur in oxidised magmas is sulfate, which dissolves readily in silicate melts, whereas in reduced melts the stable form is the less soluble sulfide. Late sulfide saturation in the Amphibole series may be due to the magma becoming increasingly oxidised with fractionation, and that this partially offset the effect of declining temperature in the cooling parent magma chamber that is interpreted to underlie the El Abra suite of intrusions. Furthermore, the El Abra suite follows a monotonic Fe depletion trend so there is no “magnetite crisis”, which leads to a sudden drop in the oxidation state and precipitation of sulfides, as seen in Pual Ridge (Jenner et al., 2010). For these reasons the increase in the oxidation state of the Amphibole-series melts with fractionation increased the likelihood of them forming an economic Cu deposit.
2.5.4 Sulfide saturation modelling
starting at 70 % fractionation, and are shown in Figure 2.9. Note that the rate of decline of Cu, Au, and Pd is in order of their partition coefficients, as expected. Although there is some uncertainty as to the exact D values they do not affect the conclusions drawn here provided the relative order of DCu<DAu< DPd is correct because the differences
between them are so large (e.g. order of magnitude variations). If the D’s are lower than the assumed values, more sulfide precipitation is needed to produce the bulk D’s required to explain our data, if they are higher, less sulfide precipitation is required.
2.6 CONCLUSIONS
Mean U-Pb zircon ages and whole-rock and mineral chemistry for the El Abra-Pajonal suite intrusions indicate that the El Abra-Pajonal suite evolved in a long-lived, mid- to lower-crustal magma chamber over a period from 43 to 35 Ma. New magma batches, originating from this mid-crustal chamber, were periodically injected into a series of short-lived upper-crustal chambers with a periodicity of approximately one million years. Fractional crystallisation and assimilation along with injection of mafic magma at 41-40 Ma were the key magmatic processes governing the evolution of the El Abra-Pajonal suite, producing a suite of alkali feldspar granite to quartz monzodiorite intrusions. The intrusions older than 41 Ma formed by plagioclase-dominant fractionation of relatively dry magmas whereas the younger intrusions of the Amphibole series formed by amphibole-dominant fractionation of a wetter magma. The oxidation state and water content of the Amphibole-series increased with fractionation; the former leading to delayed sulfide saturation and the latter promoting early saturation of a hydrothermal fluid. This combination favored the formation of the fertile magmatic-hydrothermal fluid associated with formation of the El Abra porphyry Cu deposit.