City, University of London Institutional Repository
Citation
: Henkin, R., Slingsby, A. and van Loon, E. (2014). Designing Interactive Graphics
for Foraging Trips Exploration. Paper presented at the Workshop on Analysis of Movement Data at the Eighth International Conference on Geographic Information Science (GIScience 2014), 23-09-2014 - 26-09-2014, Vienna, Austria.This is the accepted version of the paper.
This version of the publication may differ from the final published
version.
Permanent repository link:
http://openaccess.city.ac.uk/4774/Link to published version
:
Copyright and reuse:
City Research Online aims to make research
outputs of City, University of London available to a wider audience.
Copyright and Moral Rights remain with the author(s) and/or copyright
holders. URLs from City Research Online may be freely distributed and
linked to.
City Research Online: http://openaccess.city.ac.uk/ [email protected]
Designing Interactive Graphics for Foraging Trips
Exploration
!
R. Henkin1, A. Slingsby1 and E. E. van Loon2
!
1City University London, Northampton Square, London EC1V 0HB, UK
Email: [email protected], [email protected]
!
2Institute for Biodiversity and Ecosystem Dynamics, University of Amsterdam, Science Park 904, 1098 XH Amsterdam, The
Netherlands Email: [email protected]
!
1. Introduction
GPS-based tracking devices are increasingly important means for studying animal behaviour, helping ecologists investigate what influences behaviour, how adaptable species are to environmental change and the impacts of changing resource availabilities.
Animal behaviour can be studied at a variety of scales. Here, we are interested in foraging behaviour at a trip-level. Foraging trips of animals with a central nesting place can be identified relatively easily. Studying changing characteristics of these trips can help us investigate whether different foraging strategies are employed at different stages of their life cycle, between years and between individuals. This is highly applicable to conservation efforts (e.g. Daunt et al, 2002).
We are particularly interested in the relationship between time spent on the nest, the time and distance of any subsequent foraging and whether this changes with different stages in the lifecycle and foraging area. We are designing interactive visualization techniques to help investigate these issues without having to make too many assumptions. We use interactive visualization to help us understand the data better and hope it helps us identify the temporal scales of correlating and recurring behaviour between individuals. Carry-over effects on longer timescales than the duration of the previous trip may hint at foraging drivers on longer timescales relating to different types of environmental and human influences. These issues are largely ignored in foraging ecology (e.g. Giuggioli & Bartumeus, 2010) but have been found to be important (e.g. MacIntosh et al, 2013). We also hope to combine statistical techniques with our exploratory interface to help set up and run statistical analysis for appropriate time periods and sets of individuals.
2. Design
2.1. Timeline
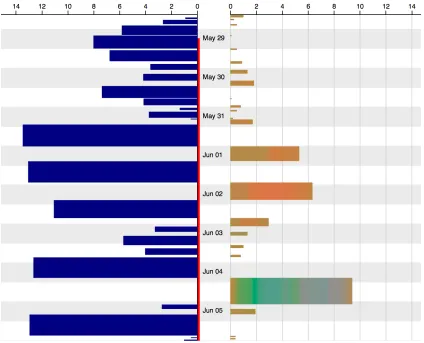
We have encoded time linearly on the vertical axis, with more recent trips at the bottom. Breeding status is encoded as colour along the vertical time axis (only “incubation” exists in Figure 1). Grey indicates night.
2.2. Nest bouts and foraging trips
Nest bouts are indicated as blue bars on the left. The subsequent foraging trip is shown as a coloured (see Section 2.3) bar on the on the right. Each pair is aligned at the time the bird leaves the nest. The widths of the bars are proportional to the time-spent (in hours) on that activity (height also indicates time-spent).
[image:3.595.87.511.226.569.2]!
Figure 1. One week of nest bout (blue bars; left) and subsequent foraging trip (coloured bars; right) sized by time-spent on the activity.
2.3. Spatial location
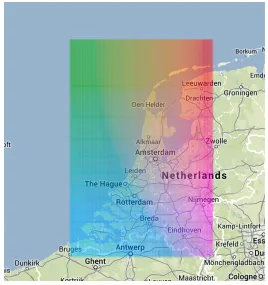
Foraging location is important for exploring and comparing foraging strategy and resource-use. We chose not to use a map-based representation, because it would be unsuitable for showing the trip structure and time information that is more important for the question we are considering. In additional, the overplotting and occlusion that would result would make it hard to interpret the trips. Instead, we encode location as colour, using a slice through the CIELab colour space that provides a two-dimensional perceptually uniform space (Wood et al, 2008).
Figure 2. 2D colour space for encoding spatial position.
Figure 2 shows how spatial location can be encoded with colour. The colour of the foraging trips in our graphic indicates the spatial location of the bird. The mapping of this colour space depends can be interactively changed in response to the area of interest. The larger the area, the less spatial discrimination we get for short trips. Locations outside this area are given the closest colour.
3. Interpretations
Here, we provide examples of some of our interpretations from the dataset and comparisons between some design choices.
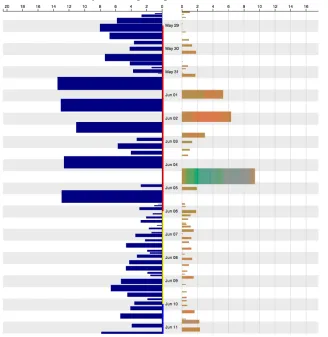
In Figure 3, we can see the bird was incubating between May 29 and June 6, with longer trips and longer bouts. During the hatching phase, the gull alternates shorter trips with shorter bouts, with no visible apparent distinction between day and night behaviour.
In Figure 4, it becomes difficult to make a comparison between the nest bouts because the scale used for the bar sizes is equal to the trip scale, which spans a considerable longer amount of time.
In Figure 5, the same chart is shown, this time with a different scale for nest bouts. With this configuration, while the relation between the nest bouts and trips is more difficult to spot, the size of the nest bouts bars is more meaningful.
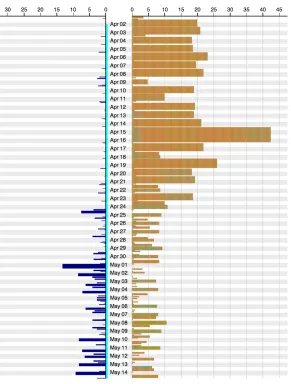
In Figure 6, a changing in behaviour within a single breeding status is apparent: a series of longer trips and short nest bouts followed by alternating nest bouts and trips with similar duration.
of occurrences for certain colours might also indicate the usefulness of certain places, such as in Figure 7, where most trips are around the same location (brown) but the bird goes to different locations in just a single trip.
[image:5.595.135.463.115.452.2]!
Figure 3. Trips of a female Lesser Black-Backed Gull, with incubation (red), hatching (yellow) and chick care (blue) phases.
Figure 4. Bars for nest bouts and trips are drawn using the same scale.
[image:5.595.168.429.513.709.2]Figure 5. The same chart is now drawn with a specific scale for nest bouts and a different one for the trips.
[image:6.595.154.445.345.729.2]Figure 7. Bird flying around the same area for all trips but one, with a variation of places described by the colour variation.
4. Further work
A number of options have already been tested for this chart and are still under scrutiny in order to answer some of the questions raised in the previous section. Changing bar attributes such as height and width, with both currently corresponding to a temporal attribute, for example, is one of the possibilities. Better interaction such as semantic zoom (Weaver, 2004), with on-the-fly resampling of the trip bars is also planned.
We are also interested in how other aspects of trips vary and are experimenting with showing differences in speed, altitude and other aspects of flight obtained from turning angles and accelerometer information.
We hope to incorporate models and other statistical to better enable visual analysis of patterns, correlations and reoccurring behaviour over different timescales. Interactive techniques will enable parameters to be set and on-the-fly statistical summary in response to the visual exploration process.
We also wish to contribute to the animal movement ecology literature by investigating foraging behaviour in these birds, the temporal scales at which behaviours correlate and carry-over effects.
!
5. Conclusions
Acknowledgements
The data we used for our research was kindly made available by UvA-BiTS (http:// www.uva-bits.nl/). R. H. acknowledges funding from CAPES, process 9076/13-1.
References
Daunt, F., Benvenuti, S., Harris, M.P., Dall’Antonia, L., Elston, D.A., Wanless, S. 2002. Foraging strategies of the black-legged kittiwake Rissa tridactyla at a North Sea colony: evidence for a maximum foraging range. Marine Ecology Process Series 245, 239-247.
Giuggioli, L. and Bartumeus, F. 2010. Animal movement, search strategies and behavioural ecology: a cross-disciplinary way forward. Journal of Animal Ecology 2010, 79, 906–909.
MacIntosh, A.J.J, Pelletier, L., Chiaradia, A. Kato, A., Ropert-Coudert, Y. 2013.
Temporal fractals in seabird foraging behaviour: diving through the scales of time. Scientific Reports, DOI: 10.1038/srep01884
Weaver, C. 2004. Building Highly-Coordinated Visualizations in Improvise. IEEE Symposium on Information Visualization 2004, 159-166, DOI: 10.1109/INFVIS. 2004.12