City, University of London Institutional Repository
Citation
:
Beecham, R. and Wood, J. (2014). Towards confirmatory data analysis?
Deriving and analysing routing information for an origin-destination bike share dataset.
Paper presented at the The 46th Annual Universities’ Transport Study Group (UTSG)
Conference, 06-01-2014 - 08-01-2014, Newcastle, UK.
This is the accepted version of the paper.
This version of the publication may differ from the final published
version.
Permanent repository link: http://openaccess.city.ac.uk/13003/
Link to published version
:
Copyright and reuse:
City Research Online aims to make research
outputs of City, University of London available to a wider audience.
Copyright and Moral Rights remain with the author(s) and/or copyright
holders. URLs from City Research Online may be freely distributed and
linked to.
City Research Online:
http://openaccess.city.ac.uk/
[email protected]
Towards confirmatory data analysis? Deriving and analysing routing
information for an origin-destination bike share dataset
Mr. Roger Beecham
PhD student in Visual Analytics giCentre, City University London Prof. Jo Wood
Professor of Visual Analytics giCentre, City University London
Abstract
Data collected from urban bike share schemes allow observed travel behaviours to be analysed on a uniquely large scale. Exploring such timed origin-destination (OD) data from the London Cycle Hire Scheme (LCHS), we previously generated detailed insights into spatiotemporal patterns of travel and suggested new hypotheses for their motivation. A limitation was that with only the origins and destinations of cycle journeys, little was known about the nature and context of likely cycled routes. In this study, we use the CycleStreets routing engine to derive routing information for every OD pair made through the LCHS. From these suggested routes, we collect heuristics for the nature of each journey. Information on the number of signalled junctions encountered, on any bridges crossed, as well as a proxy for the busyness of suggested routes is recorded. We then analyse over 5 million journeys made by LCHS members during a 12-month period (September 2011 – September 2012). Focussing on LCHS journeys that involve crossing the River Thames, we observe
differences in male and female cyclists’ apparent use of bridges, which appear to be strongly related to a commuting function. Studying heuristics of suggested routes over these bridges, we find some evidence to suggest that women may be underrepresented amongst
commuting journeys that involve a river crossing because those very journeys are
associated with relatively busy and demanding routes. We also find evidence that the nature of frequently cycled journeys involving a river crossing might explain imbalances in the direction of journeys made over the river when we select periods of more discretionary activity – when studying weekend journeys. These findings are nevertheless quite
speculative. A number of confounders cannot be easily accounted for within this analysis: the economic geography of the city, spatial interactions between docking stations at particular space-times and the relative availability of transport alternatives. Perhaps most importantly, our analysis assumes that routes suggested by the routing algorithm closely reflect individuals’ actually cycled routes.
1 Introduction
Research into cycling behaviour particularly within cities has focussed on issues of personal safety and the nature of cycling and road infrastructure. In many studies, such factors have been used to explain differences in the varying cycling behaviours of men and women (Heesch et al. 2012; Emond et al. 2009; Dill & Gliebe 2008). Exploring over 11 million journeys made through the London Cycle Hire Scheme (LCHS) we previously found distinct spatial cycling behaviours, which seemed to be consistent with much of this research (Beecham & Wood 2013). As well as being less likely than men to use the LCHS regularly and to make apparent utility journeys, women appeared to preferentially select journeys between LCHS docking stations located in more ‘pleasant’ parts of the city – either within parks, or in areas associated with low and slow-traffic streets. With only origins and
destinations, and no information about the likely routes that were involved in these journeys, however, we could only speculate about the nature of routes that each of these origin-destination pairs (OD) entailed.
In this analysis, we attempt to study the spatial cycling behaviours of men and women in more detail by deriving route information on every cycled OD pair using a popular cycle routing system – CycleStreets1. Our ambition is to use this analysis to further test findings that were generated through exploratory visual analysis, but also investigate specific themes
1
likely than men to make journeys that involve a river crossing. This finding was true even after controlling for geo-demographic and behavioural differences between male and female cyclists. Since London’s bridges are generally associated with relatively large, fast-moving roads and with roundabouts or large junctions at either side, we speculated that such journeys might be particularly stressful or demanding. Using information derived from the CycleStreets routing engine, we wish to answer following questions:
RQ1. Which bridges are most likely to be used by men and women?
RQ2. To what extent are these bridges crossed equally in either direction (northbound and southbound)?
RQ3. Are journeys that involve a river crossing generally more demanding than other journeys made between LCHS docking stations?
Related to the third research question above, we hope to use heuristics on the nature of routed journeys to ask:
RQ4. What are the discriminants of quiet ‘derived’ route choice selection?
2 Related work: urban cycling infrastructure and route choice selection
The literature on cycle behaviour and route choice is relatively large, with survey based studies into stated preferences perhaps most widespread. Typically in stated preference studies, respondents are asked to rank their preferences for different cycle facilities, or suggest a preferred cycle route given a set of pre-defined route options (Bovy & Bradley 1985; Tilahun et al. 2007; Heesch et al. 2012). More recently there has been a number of studies into cyclists’ revealed preferences. Here, cyclists might be asked to recall a route that they cycled and these routes compared against a sample of routes generated by a GIS (Larsen & El-Geneidy 2011). Elsewhere, Menghini et al. (2010) analyse GPS tracks from a comparatively large dataset of 70,000 cycle trips to reconstruct individuals’ actually cycled routes. The authors then generate a full set of alternative (non-chosen) routes from which to evaluate actually cycled routes. A similar approach is taken by Broach et al. (2012) using a GPS dataset of 164 cyclists’ journeys.
3 Methods
3.1 Data processing
In this research we use the CycleStreets routing engine to generate suggested routes for every cycled OD pair in the LCHS dataset. CycleStreets is designed specifically for cyclists and aims to suggest practical routes, taking into account the quality of cycling infrastructure, the likely busyness of roads and expected travel times given a number of attributes. The routing algorithm uses various tags collected as part of the OpenStreetMap2 (OSM) project, and working with the Department for Transport, its creators have converted detailed survey data on cycling infrastructure for use in OSM. As a result, the cycle routing considers factors such as: path and surface type and quality, travel time (based on path type and its distance), the presence or absence of signage, the presence or absence of obstacles and traffic calming measures, as well as whether or not a path is lit.
The algorithm works by generating a map of available routes, simplified into a network of straight lines joining nodes – the nodes represent junctions or route start and end points. Distances from the beginning of a journey to all nearby nodes are calculated. For each node, the current distance travelled and route taken is recorded. If it is possible to travel between nodes using a shorter route, then that route is selected as the optimum way of travelling between nodes. The process is repeated until the best route is selected – defined as the route that minimises distances between nodes. In order to generate practical routes, various costs are imposed on distances between nodes; and this is how the more detailed attributes collected through OSM are incorporated into the routing algorithm.
CycleStreets allows its users to select four different types of suggested route: shortest path, fastest route, balanced (a mix between travel time and route quietness) and quietest route. For the purposes of this analysis we specify the fastest route. This option may result in bikes being routed on larger or faster roads at certain sections. The reason for selecting this over the balanced or quietest option is that for many, use of the LCHS is occasional, and after qualitatively evaluating routes suggested by CycleStreets for some key journeys, we believe that this option suggests routes that do not require extensive familiarity with London’s road and cycle network.
CycleStreets provides a web Application Programming Interface (API) to its routing system. Spatial coordinates representing an OD pair are passed to the API through an HTTP request, and data on each route returned as XML. Along with a String of coordinates representing waypoints for each route, the following are returned by the API: section length (m), surface type, travel time, turn instructions, count of signalled junctions or crossings and section elevations. Also returned is a ‘quietness’ score for every planned route. The quietness score ranges from 0% (not at all quiet) to 100% (most quiet) based on a qualitative evaluation of each road or path collected though OSM. Most quiet (quietness score of 100%) are cycle tracks and park paths -- generally off-road routes. Slightly less quiet are ‘quiet streets’, at 75% quietness, and shared-use facilities at 80%; ‘busy roads’ are given quietness scores of 50% or less. For each route a single quietness score is provided, taking into account the relative distance travelled on such roads or paths. We set up a crawler to the CycleStreets API to harvest routing data on all c.200,000 cycled OD pairs in the LCHS dataset. The processed data are stored in an SQLite database.
One of the reasons for collecting these data was that we might use heuristics on suggested routes to make judgements about how challenging those journeys are. Existing research on safety and cycling infrastructure suggests that the nature and extent of road junctions and roundabouts, the presence of cycle paths, road user speeds and the presence of right (in the UK and Australasia) and left (elsewhere) turns variously affect both real and perceived levels of safety (Wang & Nihan 2004; Hels & Orozova-Bekkevold 2007). As well as the quietness scores, then, we ensure that turn instructions and crossings data for each route are stored and processed by our crawler.
As discussed, one weakness of our methodology is around the probable mismatch between LCHS users’ actually cycled routes and those suggested by the CycleStreets routing engine. One means of partially evaluating how well suggested routes might reflect actually cycled journeys is to make a comparison of travel times. We evaluate each routed travel time amongst the distribution of actually cycled travel times for each OD pair. We do this on all OD pairs where travel times should tend to a normal distribution: where that journey has been repeated at least 30 times; this amounts to c.36,000 OD pairs. We then convert each routed travel time for an OD pair
(
rtt
od)
into a z-score, given the distribution of actuallycycled travel times for that OD pair
(
attod
)
:zscore= rttod attod
std(attod)
One problem with this approach is that we assume that travel times follow a normal distribution. Studying journeys between individual OD pairs, and their associated travel times, we consistently observe distributions with heavy tails (Figure 1a). To correct for this, for each OD pair of actually cycled travel times we remove the right tail -- the 95th percentile – before calculating z-scores that represent the routed travel time. Figure 1b shows a frequency distribution of these z-score values. Whilst most z-scores lie within a relatively small band of values, the distribution is slightly positively skewed from zero; suggesting that routed travel times are faster than actual travel times, but that this difference is systematic. As well as calculating z-scores for each routed travel time, we compute the skewness and kurtosis for the distribution of actually cycled travel times of every OD pair. In only 7% of occasions are values for kurtosis (>2) and skewness (>1) large, suggesting a long right tail. The systematic differences in actual and routed travel times therefore perhaps cannot be explained by the fact that the travel time distributions are non-normal. Instead, the differences might be explained by the fact that, not included in the routed travel time is the time spent undocking and wheeling a bike to a road at the start of a journey, and returning a bike to its docking station at the end of a journey. In addition, LCHS bikes themselves are very heavy, with a limited number of gears; it is conceivable that the average speeds suggested by CycleStreets (varies by road type and elevation, but typically 12mph) are significantly faster than those likely to be cycled using an LCHS bicycle.
Assuming these factors do overly inflate LCHS travel times, we add an additional 30 seconds to the routed travel times (for undocking and docking bikes) and increase all routed travel times by 10% (to adjust for the weight and nature of LCHS bikes). Doing so has the effect of centring the z-scores (Figure 1c): 78% of (adjusted) routed travel times lie within one standard deviation of actually cycled travel times for the journeys they aim to represent. If we were to randomly select actual travel times from each OD pair’s distribution in the LCHS dataset separately we would expect 68% of these z-scores to lie within one standard deviation of the mean. This analysis perhaps suggests, then, that suggested travel times do relate to the distributions they are supposed to represent, and that for a large portion of OD pairs, routed travel times are relatively close to the centre of these distributions.
3.1 Presenting results
The analysis that follows is structured around our four research questions, which essentially serve as research hypotheses that are subsequently tested statistically. When comparing frequencies of, for instance, male and female cyclists’ suggested use of bridges, we
calculate Pearson’s residuals from the Chi-statistic to compare observed frequencies against what would be expected given equality of proportions between men and women:
= obsp exp
exp
data, very small differences are statistically significant. We therefore report various measures of effect size (Coe 2002) when making such comparisons.
[image:6.595.118.521.111.657.2]4.1 Analysing suggested use of bridges
An important finding from earlier exploratory analysis was around differences between men’s and women’s LCHS journeys across the River Thames (Beecham & Wood 2013). We consistently found fewer women, and fewer journeys made by women, over bridges than men. In total, 19% of the 5.05million journeys taken by LCHS members between September 2011 and September 2012 involved a river crossing, with river crossings representing 15% of women’s journeys and 19% of journeys taken by men. This was true even after controlling for geodemographic differences in the population of male and female LCHS cyclists. We investigate this finding in more detail here by studying the likely bridges used by LCHS cyclists, given routes suggested by CycleStreets. Since there is clearly a more limited set of options for crossing the river, we speculate that deviations between actually cycled usage of bridges and those suggested by CycleStreets may be comparatively small.
4.1.1 What are the differences between men’s and women’s routed use of bridges?
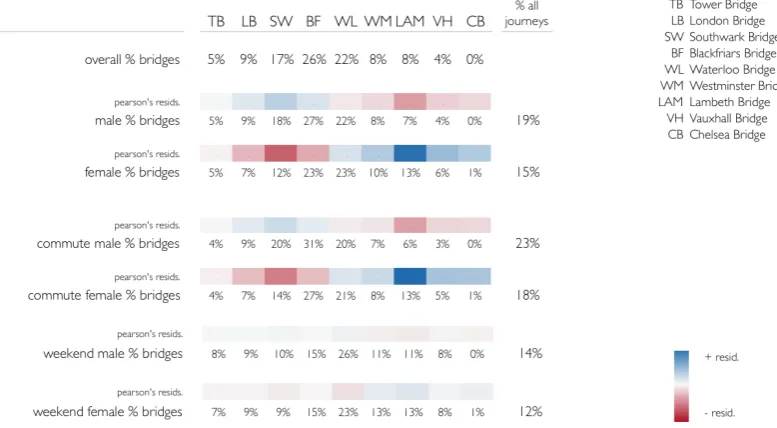
Figure 2 Routed journeys over bridges for various subsets of the LCHS cycling population. % figures show suggested usage of each bridge as a proportion of all bridge crossings. Above each subset, we calculate Pearson’s residuals from the Chi-static to test for equality of proportions between men’s and women’s use of bridges: we assume there is no difference in the relative number of journeys over each bridge for men and women. These are signed values and we map the residuals onto a global diverging colour scale in order to compare across different tests (all journeys; commuter-only journeys; weekend journeys). The commuter classification through which commuter journeys are defined is discussed in detail in Beecham et al. (in press).
Figure 2 gives relative frequencies for members’ use of bridges as defined by the routing algorithm. In the top row, journeys over each bridge are expressed as a proportion of all journeys involving a river crossing. Below that, the same percentage figures are reported by gender and later by gender and commuter and gender and weekend journeys. Above each category, Pearson’s residuals from the Chi-statistic are calculated assuming equality of proportions over bridges for each subset of men and women. For instance, we assume that there should be equal relative numbers of journeys over Blackfriars bridge for men and women.
[image:7.595.77.466.290.504.2]4.1.2 To what extent does commuting explain gendered differences in usage of bridges?
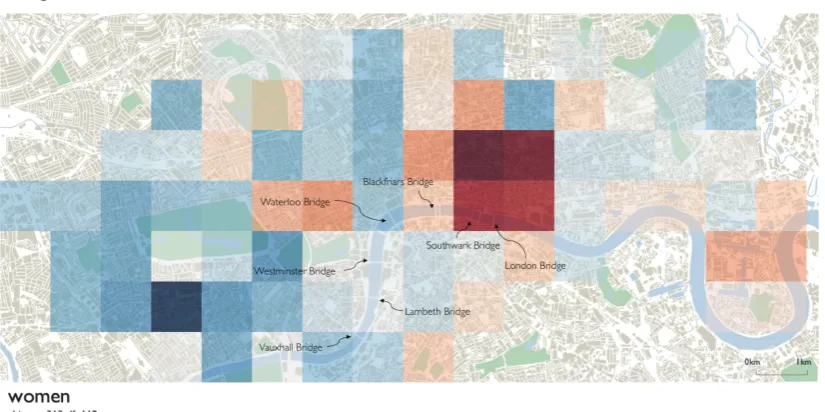
Figure 3 The LCHS area is divided into 1km grid cells. In each cell observed frequencies of ‘derived’ workplaces for male and female cyclists are recorded, and Pearson’s residuals from the Chi-statistic are mapped onto a red-blue colour scale assuming equality of proportions between men and women. Grid cells where women’s workplaces are overrepresented compared to men’s are blue; those where women’s workplaces are underrepresented are red.
There may be a combination of reasons for these differences in the spatial travel behaviours of men and women. One explanation might be related to differing attitudes to travel. Previous research on LCHS usage has found that women’s journeys are typically constrained within more ‘pleasant’ parts of the city, perhaps associated with low traffic streets and distinct cycle lanes: in west London and centrally within the Bloomsbury area (Beecham & Wood 2013). Elsewhere, female cyclists have been shown to express a particularly strong preference, both perceived and real, for cycling off-road, on separated cycle lanes and low traffic boulevards or streets (Emond et al. 2009; Dill & Gliebe 2008; Heesch et al. 2012).
A second contributory factor is that observed spatial travel behaviours must also be motivated by where individuals need to travel. We previously developed a technique for deriving docking stations for each LCHS commuting member that represents their likely workplace (Beecham et al. in press). Contrasting the geography of women’s workplaces with those of male LCHS cyclists (Figure 3), it appears that the gendered differences in men’s and women’s usage of bridges may in fact relate to where LCHS members’ jobs are perhaps located. We can confirm this by studying relative frequencies of routed journeys over bridges in Figure 2 in more detail. When filtering only by journeys labelled as commutes (rows 3 and 4), the differences between male and female usage of bridges are reinforced. Men are 1.5 times (Relative Risk ratio, RR) more likely to cross Southwark bridge than women and women are 2.3 times (RR) more likely to cross Lambeth bridge than men when we compare commuting journeys that involve river crossings. In contrast, there is greater convergence between men and women when journeys not associated with commuting (weekend journeys) are compared. The colour values for Pearson’s residuals in Figure 2 become lighter and there is greater convergence in the relative number of journeys that involve a river crossing made by men and women.
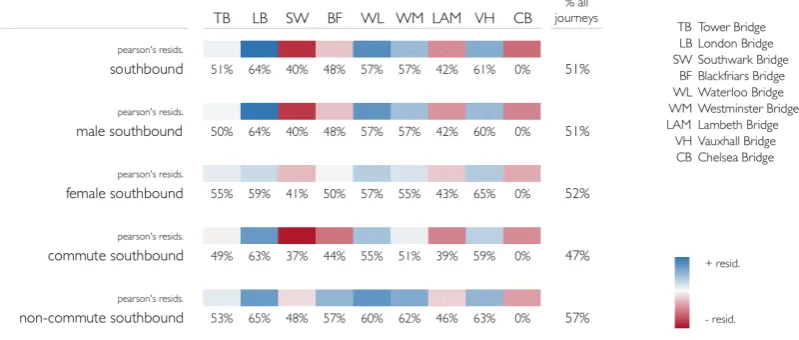
Certain bridges -- Southwark, Blackfriars and Lambeth -- tend to be crossed more northbound than southbound, and for others the reverse is true. It is rarely the case that there is a perfect balance in the number of northbound and southbound journeys over bridges, and overall bridges are slightly more likely to be crossed southbound than northbound (right column of Figure 4). There is some convergence between men and women in this respect. Both men and women are more likely to cross Southwark, Blackfriars and Lambeth northbound and more likely to cross the other bridges southbound. This imbalance is perhaps also related to commuting. Bridges associated with men’s commuting (Southwark and Blackfriars) and also women’s commuting (Lambeth) are even more likely to be crossed northbound when filtering on commuting journeys, and of all commuting journeys that involve a river crossing, 53% of crossings are northbound across the river.
[image:9.595.78.478.347.517.2]To an extent, we might expect this imbalance in favour of northbound commuting journeys: commuting members make relatively more morning than evening commuting journeys (55% of commutes take place in the morning peak), and workplaces tend to be located north of the river. However, non-commuting journeys that involve a river crossing have an imbalance in the opposite direction: 57% of non-commuting journeys involving a river crossing are southbound journeys. Part of the reason for this alternate imbalance might be due to the fact that 21% of all river crossing journeys are to three large docking stations at Waterloo, and which serve as hub stations. Even excluding Waterloo, however, it is still the case that 55% of non-commuting journeys happen southbound across the river.
Figure 4 The relative balance of southbound-northbound journeys over each bridge, as suggested by CycleStreets, is shown by expressing southbound journeys as a proportion of all journeys. Pearson’s residuals from the Chi-statistic are mapped to a diverging red-blue colour scheme, assuming equality in proportions in the relative number of southbound-northbound journeys.
4.1.4 Are suggested routes over bridges more busy or demanding than other journeys, and can the busyness or challenge of these routes also explain any differences?
As discussed, one suggested explanation for the fact that, globally, we find fewer women making journeys across bridges than men, was that the bridges themselves might be
perceived to be difficult to negotiate. This is because London’s bridges tend to be associated with relatively fast-moving, multiple-lane roads and often require riders to negotiate large roundabouts and signalled junctions at either side. This might also be one partial explanation for the fact that we see fewer journeys over bridges at times when more discretionary rather than utility journeys are made – for instance at weekends. Collecting heuristics on the nature of routed journeys, it might be possible to identify whether journeys over particular bridges are in fact more demanding than others.
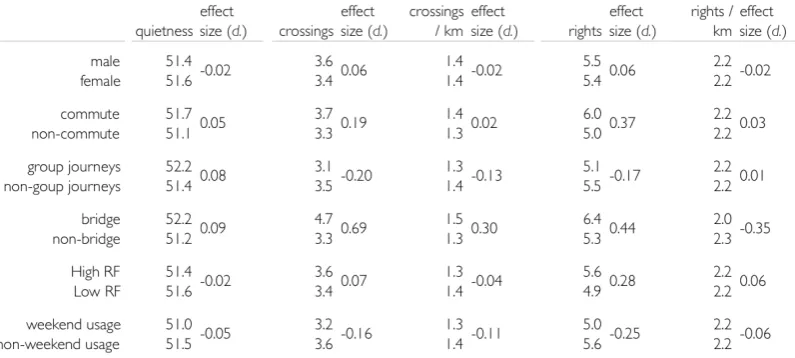
that do not, although the difference here is small (52.2 for river crossings; 51.2 for non-river crossings, Cohen’s d. 0.1). Studying other route heuristics, such as absolute numbers of signalled crossings and right turns and numbers of crossing and turns per km travelled, it appears that journeys involving a bridge crossing are perhaps more technically demanding than other journeys. There is a moderate difference between the average number of signalled junctions or crossings encountered for journeys that involve a bridge crossing and those that do not (4.7 for bridge crossings; 3.3 for non-bridge crossings, Cohen’s d. 0.7). There is also a small-to-moderate difference between the number of right turns for journeys that involve a river crossing and those that do not (6.4 bridges, 5.3 non-bridges, Cohen’s d
0.4); although this is not the case when we normalize by the distance travelled for these journeys.
Figure 5 Average quietness scores, number of signalled junctions or crossings and number of right turns for all
journeys made by various subsets of the population. Effect sizes (Cohen’s d.) between subsets are also reported.
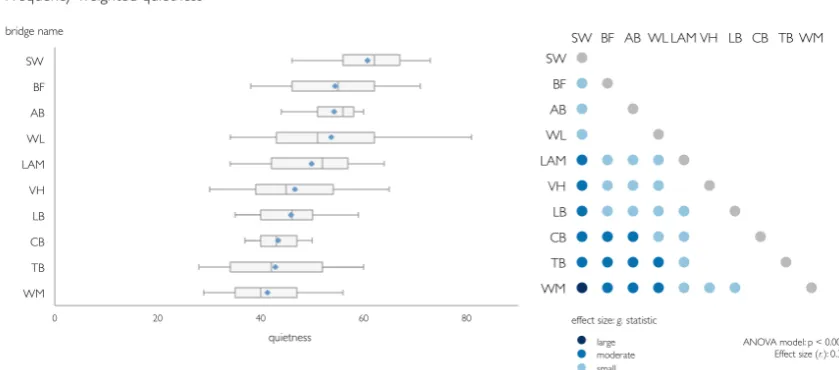
There is greater variation in quietness scores when comparing between bridges. Journeys over Southwark, Blackfriars and Waterloo tend to be associated with higher quietness scores than Westminster, Chelsea, Victoria and Tower Bridge. Journeys over Southwark bridge are associated with particularly high quietness scores (Figure 6). Importantly, journeys over bridges with relatively high levels of female usage are in fact less quiet than those associated with men’s usage (Figure 6). Assuming these suggested routes in fact do approximate to individuals’ actual route choice, one might tentatively suggest that we find women underrepresented amongst river crossings because the journeys they must make to commute involve greater levels of risk than those for men.
[image:10.595.122.520.203.382.2]Figure 6 Distribution of quietness scores for observed journeys over bridges, as suggested by CycleStreets are shown as box plots (left) and frequency-weighted average quietness scores compared statistically (right).
4.2 Studying the discriminants of quiet route choice selection
4.2.1 Is there a relationship between journey frequency and suggested quietness?
That we find fewer non-commuting, ‘discretionary’, journeys made northbound across the river, where we observe lower quietness scores, and that we find fewer commuting journeys made by women that involve a river crossing, also involving lower quietness scores, we might speculate that route quietness is positively related to journey frequency: the more ‘quiet’ derived routes are generally likely to be cycled more frequently than less quiet routes. To test this hypothesis, we construct Pearson’s correlation coefficients on these two variables – quietness and journey frequency – for all OD pairs. Whilst quietness scores are normally distributed, journey frequencies (by OD pair) are very strongly positive skewed. We therefore first log10 transform frequency values for each OD pair to contrive a more normal distribution. Running correlation coefficients on various geodemographic and behavioural subsets of the member population -- on commuting and non-commuting journeys and on group and non-group journeys (Beecham & Wood conditionally accepted) -- we find a very weak positive correlation (from 0.08-0.18) between journey frequency and quietness score. That there is so little differentiation in these correlation coefficients, even when filtering on more ‘discretionary’ journey characteristics such as group cycling, might suggest that individuals’ route choice, or rather OD pair choice, is not strongly influenced by quietness. As discussed, there are various confounders that cannot easily be accommodated within this analysis. Choice or popularity of OD pair is likely to be motivated by that pair of docking stations’ visibility or by an individual’s knowledge or experience of the scheme; and journeys are likely to be concentrated between parts of the city where particular activities, such work or shopping, take place. With no apriori knowledge of individuals’ travel requirements or full set of circumstances, and without modelling for the usability of the scheme at particular space-times, it is very difficult to generate an ‘expected’ model of docking station usage against which observed patterns can be evaluated. There are also of course wider problems of measurement validity – the fact that we conflate derived routes with actual routes.
4.2.2 What are the discriminants of quiet route choice selection?
[image:11.595.78.498.91.276.2]the reverse is true of journeys taken at weekends. The effect sizes for these comparisons are nevertheless quite small.
Since the individual heuristics themselves – quietness, turn and crossing frequency -- are not particularly discriminating, one means of extending this analysis more formally may be to create a composite measure of route ‘stressfulness’ that takes into account the three route heuristics appearing in Figure 5, and use this composite as a dependent variable in a regression analysis. The behavioural and demographic variables appearing in Figure 5 would then be used as predictor variables. The same confounders we discuss in Figure 4.2.1 would nevertheless apply, and would need to be accounted for in any proposed model.
6 Conclusion
In this research, we use a popular cycle routing algorithm to make inferences about the suggested routes used by LCHS cyclists. Our analysis has enabled early insights into spatial travel behaviours generated through exploratory data analysis (Beecham & Wood 2013) to be explored in some detail. We observe differences in male and female cyclists’ apparent relative use of bridges, which appear to be strongly related to a commuting function. Studying heuristics on suggested routes over these bridges, we find some evidence to suggest that women may be underrepresented amongst commuting journeys that involve a river crossing because those very journeys are associated with relatively busy and
demanding routes. We also find evidence that the nature of frequently cycled journeys involving a river crossing might explain imbalances in northbound-southbound journeys when we select periods of more discretionary activity – when studying weekend journeys. These latter two claims are nevertheless quite speculative. A number of confounders cannot be easily accounted for within this analysis: the economic geography of the city, spatial interactions between docking stations at particular space-times and the relative availability of transport alternatives. Whilst this analysis has enabled previously identified research themes to be explored in greater detail, we suggest that for genuine explanatory claims around LCHS cyclists’ route preferences to be made, actual trajectories of cycled journeys do need to be known.
6 References
Aultman-Hall, L., Hall, F. & Baetz, B., 1997. Analysis of Bicycle Commuter Routes Using Geographic Information Systems: Implications for Bicycle Planning. Transportation Research Record, 1578(1), pp.102–110.
Beecham, R. & Wood, J., conditionally accepted. Characterising group cycling journeys using interactive graphics. Transportation Research Part C: Emerging Technologies.
Beecham, R. & Wood, J., in press. Exploring gendered cycling behaviours within a large-scale behavioural data-set. Transportation Planning and Technology, pp.1–15.
Beecham, R., Wood, J. & Bowerman, A., in press. Studying commuting behaviours using collaborative visual analytics. Computers, Environment and Urban Systems.
Bovy, P.H.L. & Bradley, M.A., 1985. Route choice analyzed with stated preference approaches. Transportation Research Record, (1037).
Annual conference of the British Educational Research Association (BERA), University of Exeter, UK, 12-14 September 2002.
Dalton, Alice, Jones, Andrew & Ogilvie, David, 2013. Model behaviour: GPS v GIS to examine our journey to work. In 21st GIS Research UK (GISRUK) conference. University of Liverpool, UK, 3-5 April 2013.
Dill, J. & Gliebe, J., 2008. Understanding and measuring bicycling behavior: A focus on travel time and route choice. Bicycling, 29(December), pp.1 – 70.
Emond, C.R., Tang, W. & Handy, S.L., 2009. Explaining Gender Difference in Bicycling Behavior. Transportation Research Record: Journal of the Transportation Research Board, 2125(-1), pp.16–25.
Heesch, K.C., Sahlqvist, S. & Garrard, J., 2012. Gender differences in recreational and transport cycling: a cross-sectional mixed-methods comparison of cycling patterns, motivators, and constraints. International Journal of Behavioral Nutrition and Physical Activity, 9(1), p.106.
Hels, T. & Orozova-Bekkevold, I., 2007. The effect of roundabout design features on cyclist accident rate. Accident; analysis and prevention, 39(2), pp.300–307.
Larsen, J. & El-Geneidy, A., 2011. A Travel Behavior Analysis of Urban Cycling Facilities in Montréal, Canada. Transportation Research Part D: Transport and Environment, 16(2), pp.172–177.
Menghini, G. et al., 2010. Route choice of cyclists in Zurich. Transportation Research Part A: Policy and Practice, 44(9), pp.754–765.
Tilahun, N.Y., Levinson, D.M. & Krizek, K.J., 2007. Trails, lanes, or traffic: Valuing bicycle facilities with an adaptive stated preference survey. Transportation Research Part A: Policy and Practice, 41(4), pp.287–301.
Wang, Y. & Nihan, N.L., 2004. Estimating the risk of collisions between bicycles and motor vehicles at signalized intersections. Accident; analysis and prevention, 36(3), pp.313–321.